
EVALUATION OF LOCAL ORIENTATION FOR TEXTURE
CLASSIFICATION
Dana Elena Ilea, Ovidiu Ghita and Paul F. Whelan
Vision Systems Group, Dublin City University, Glasnevin, Dublin 9, Ireland
Keywords: Texture, image orientation, local distributions, observation scale, classification.
Abstract: The aim of this paper is to present a study where we evaluate the optimal inclusion of the texture orientation
in the classification process. In this paper the orientation for each pixel in the image is extracted using the
partial derivatives of the Gaussian function and the main focus of our work is centred on the evaluation of
the local dominant orientation (which is calculated by combining the magnitude and local orientation) on
the classification results. While the dominant orientation of the texture depends strongly on the observation
scale, in this paper we propose to evaluate the macro-texture by calculating the distribution of the dominant
orientations for all pixels in the image that sample the texture at micro-level. The experimental results were
conducted on standard texture databases and the results indicate that the dominant orientation calculated at
micro-level is an appropriate measure for texture description.
1 INTRODUCTION
Texture is a fundamental property of digital images
that has received a significant amount of attention
from the computer vision community. This is
motivated by the fact that the objects in digital
images are not characterised only by their shapes but
also by the structural relationship between the pixels
that define their imaged surfaces. Based on this
observation, a large number of studies have been
dedicated to the development of a robust texture
descriptor that is able to adapt to the local
characteristics in the image. In this sense, the texture
has been analysed based on the model that has been
employed to describe it. While there is not a widely
accepted definition for texture in the vision
community, most of the developed techniques
approach the texture either from a structural or a
statistical perspective (Haralick, 1979; Dyer et al,
1980). In statistical approaches, the texture is
described by the spatial distribution of the pixels in
the image (Chellappa et al, 1998) while in structural
approaches the texture is defined as a relational
arrangement of texture primitives (Materka and
Strzelecki, 1998; Petrou and Sevilla, 2006). In this
paper we propose a hybrid statistical-structural
approach where the texture is described in terms of
the distribution of orientations calculated at micro-
level for all pixels in the image. The distributions of
edge orientations have been previously used for
image segmentation (Flores and Leon, 2003; Ojala
et al, 2002-a; Liu and Wang, 2003), retrieval (Zhou
et al, 2003; Manjunath and Ma, 1996) and tracking
(Marimon and Touradj, 2007) while our aim is to
evaluate the robustness of these measures when
applied to texture classification. While the
orientation of the texture is highly influenced by the
observation scale, in this work we attempt to
quantify the importance of the scale and size of the
texture unit (where the local dominant orientation is
calculated) on the classification results. This paper is
organised as follows. Section 2 describes the
estimation of the dominant orientation in the image.
Section 3 details the implementation of the texture
classification framework. Section 4 describes the
experimental results while in Section 5 are provided
concluding remarks.
2 ESTIMATION OF EDGE
ORIENTATION
The local orientation in the image is obtained by
calculating the first derivatives in two orthogonal
directions (Kass and Witkin, 1987) and the edge
orientation can be simply determined using the
expression illustrated in equation 1.
357
Ilea D., Ghita O. and Whelan P. (2008).
EVALUATION OF LOCAL ORIENTATION FOR TEXTURE CLASSIFICATION.
In Proceedings of the Third International Conference on Computer Vision Theory and Applications, pages 357-364
DOI: 10.5220/0001084603570364
Copyright
c
SciTePress
⎟
⎠
⎞
⎜
⎝
⎛
∂∂
∂∂
=Θ
⎥
⎦
⎤
⎢
⎣
⎡
∂
∂
∂
∂
=∇
xF
yF
arctg
y
F
x
F
f
/
/
,, (1)
where
∇ defines the gradient operator and Θ is the
edge orientation. The gradient is computed for each
pixel in the image and this operation is traditionally
carried out by filtering the image with operators
such as Sobel in the
x and y directions. The
estimation of the gradient using small kernels is not
appropriate since this operation is sensitive to image
noise. Thus, in this paper we have calculated the
partial derivatives in the image by filtering the
image in the
x and y directions with the filters that
implement the derivatives of the Gaussian function.
This is achieved by filtering the image with 1-
dimensional (1D) operators that are calculated using
the expression illustrated in equation 2.
)(,
2
1
)(
2
2
2
2
xG
x
x
G
exG
x
σ
σπ
σ
−=
∂
∂
=
−
(2)
where σ is the scale of the Gaussian function (see
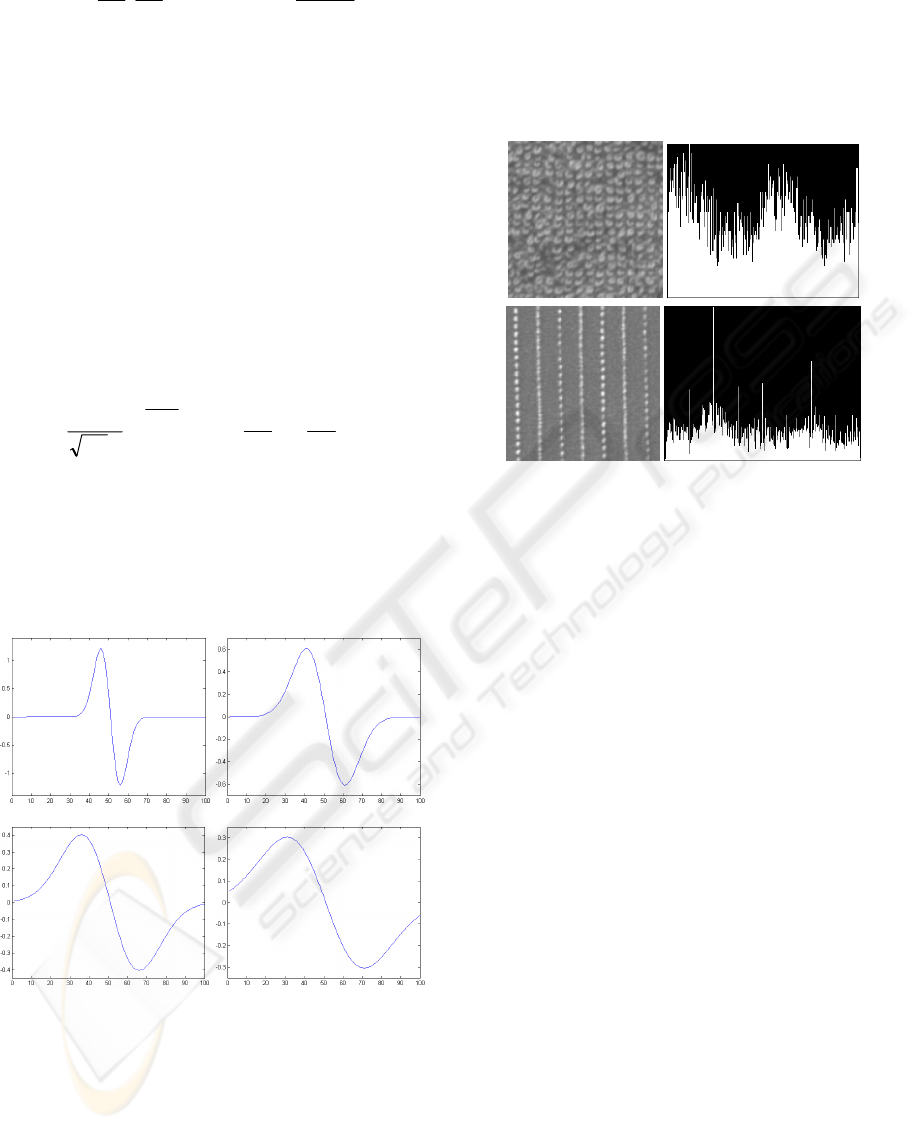
Figure 1 for a plot of the derivative of Gaussian
function for different scale parameters. For clarity
purposes the plots illustrated in Figure 1 were
generated by varying the parameter
x in equation 2
in the interval [-50, 50]).
(a) (b)
(c) (d)
Figure 1: The derivative of Gaussian function. (a) σ=0.5.
(b) σ=1.0. (c) σ = 1.5. (d) σ=2.0.
The main advantage of the calculation of the partial
derivatives using the derivative of the Gaussian
resides in the fact that the Gaussian has a smoothing
effect and the scale parameter controls the amount of
noise reduction. After the calculation of the partial
derivatives, the weak edge responses were
eliminated by applying a non-maxima suppression
procedure (similar to that described in (Canny,
1986)) and the edge orientation is determined for
each pixel using the expression illustrated in
equation 1. The distributions of the edge orientations
calculated for two different textures from the Outex
texture database (Ojala et al, 2002-b) are illustrated
in Figure 2.
Figure 2: Distributions of edge orientation calculated for
two textures (top - isotropic and bottom - oriented) from
the Outex database (Ojala et al, 2002-b).
The distribution of the edge orientations illustrated
in Figure 2 provides the primary discrimination
between textures. Its main disadvantage is the fact
that this distribution is calculated over the entire
image and is not able to robustly sample the texture
orientation at micro-level. Thus, in this paper we
propose to evaluate the dominant orientation of the
texture calculated at micro-level for all texture units
that are defined as the local neighbourhood around
each pixel in the image. The distribution of the
dominant orientations calculated for all texture units
is then employed to capture the local orientation of
the texture at macro-level.
2.1 Estimation of the Dominant
Orientation of Texture at Micro
and Macro-Level
The problem of analysing the texture orientation at a
given observation scale is not a straightforward task
as the orientation of the texture may be isotropic at
macro level but having strong orientation at micro-
level. This problem has been addressed in the paper
by Germain et al, 2003 where they analysed a
texture that is formed by sinusoidal curves having
the same period. In this regard, when the texture is
evaluated at a micro-level in a small neighbourhood
(say 3×3 or 5×5) the texture appears to have a strong
orientation. But when it is analysed at macro-level
VISAPP 2008 - International Conference on Computer Vision Theory and Applications
358
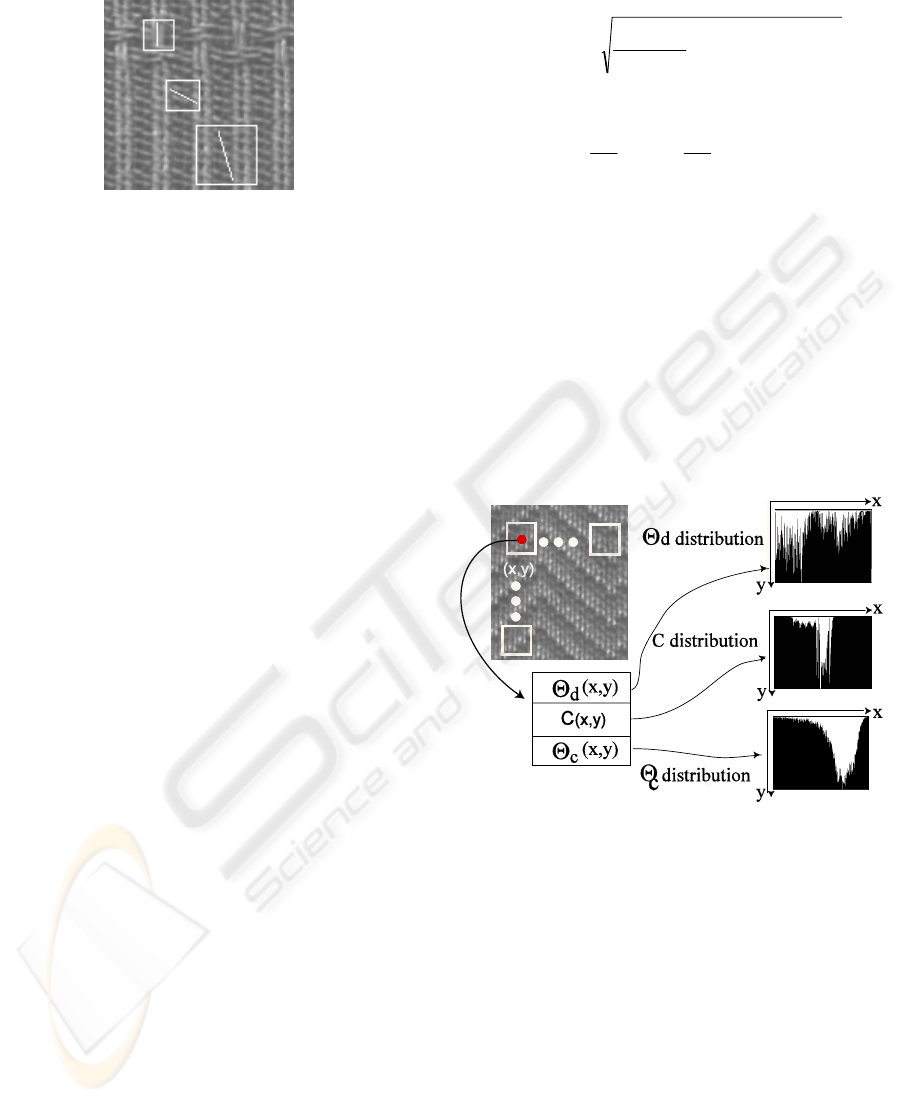
the texture appears to be isotropic. This process can
be clearly visualised in Figure 3.
Figure 3: The variation of the orientation of texture at
different observation scales.
The next problem is how to extract the dominant
orientation of the texture in a local
k×k
neighbourhood. In our implementation we elected to
determine the orientation of the texture by
constructing the histogram of orientations for all
pixels in the local neighbourhood and the dominant
orientation is selected as the dominant peak in the
histogram as follows,
() ( )()
∑∑
−=−=
Θ
∈
ΘΘ
Θ==
2/
2/
2/
2/
,,)(,
k
ky
k
kx
Di
iyxihihH
δ
U
,
where
D ]2,0[
π
∈ ,
()
⎩
⎨
⎧
≠
=
=
ji
ji
ji
0
1
,
δ
(3)
)max(arg
Θ
=Θ H
d
(4)
where Θ is the local orientation,
Θ
H is the
distribution of local orientations and
d
Θ is the
dominant orientation of the texture in the
neighbourhood
k×k.
3 TEXTURE CLASSIFICATION
The dominant orientation in the image is a powerful
local texture descriptor but it is not robust in
sampling the difference between textures that are
subjected to illumination variation and image
inversion. Thus, we need to augment the local
texture orientation with measures such as local
orientation coherence and contrast that are
calculated in the local neighbourhood
k×k where the
dominant orientation of the texture has been
estimated. In our implementation, the contrast
measure is sampled by the mean gray-scale value
calculated in the
k×k neighbourhood and the
orientation coherence (
c
Θ ) is calculated using the
weighted standard deviation of the edge orientation
of all pixels in the neighbourhood as follows:
()
∑
Θ−Θ
+
=Θ
×
∈
×
∈
kk
wnm
ave
kk
wnm
yx
c
k
gg
ji
,
2
,
2
22
)(
),(
(5)
where (
i,j) are the coordinates of the pixel of
interest,
y
F
g
x
F
g
yx
∂
∂
=
∂
∂
= ,
are the partial
derivatives calculated for all pixels in the window
kk
w
×
and
ave
Θ
is the average edge orientation
calculated for all pixels in the window
kk
w
×
. From
the k×k neighbourhood around each pixel in the
image three measures are calculated, namely the
dominant orientation (
d
Θ
), the contrast value (C)
and the orientation coherence (
c
Θ ). It is useful to
mention that these three measures define the texture
composition at micro-level while their distributions
calculated over the entire image define the features
that describe the texture at macro-level. This process
is illustrated in Figure 4.
Figure 4: The calculation of the dominant orientation,
contrast and orientation coherence distributions.
To sample the image at different observation scales,
the orientation, contrast and orientation coherence
distributions are calculated for different values of the
window parameter k. In our implementation the size
of the local window is varied from 3×3 to 11×11.
These distributions are concatenated into a feature
vector that is used to train an SVM classification
scheme (Chang and Lin, 2001). Figure 5 illustrates
the shape of the macro-level distributions when the
dominant orientation is calculated for all pixels in
the image in neighbourhoods of differing sizes. It
can be noticed that the distribution of the local
dominant orientations in the image shows apparent
peaks when calculated in small neighbourhoods
(3×3) and shows an even distribution of the
EVALUATION OF LOCAL ORIENTATION FOR TEXTURE CLASSIFICATION
359
dominant orientations when calculated in larger
neighbourhoods such as 7×7 and 11×11. This is
motivated by the fact that the dominant orientation
calculated in small neighbourhoods samples the
local orientation of the texture while the dominant
orientation when calculated in larger
neighbourhoods tends to sample the anisotropic
character of the texture with the increase in the size
of the neighbourhood.
(a) (b)
(c) (d)
Figure 5: The distribution of the dominant orientations
when the window parameter k is varied. (a) Input texture
image from Outex database. Distribution of the dominant
orientation for texture units in (b) 3×3, (c) 7×7 and (d)
11×11 neighbourhoods.
4 EXPERIMENTS AND RESULTS
The experimental results in this paper were
conducted on three Outex databases (TC 00000, TC
00001 and TC 00002) and on databases that were
constructed by splitting recursively the images
contained in the Brodatz database (Brodatz, 1966).
The Outex databases are formed by 24 classes of
standard textures as illustrated in Figure 6 (canvas,
carpet and tile).
The database TC 00000 consists of 480 texture
images where the image size is 128×128. Database
TC 00001 is formed by splitting the images that
form the database TC 00000 in four parts and this
results in 2212 texture images where the image size
is 64×64. Database TC 00002 is obtained by
splitting the texture images contained in the database
TC 00001 into four parts and this generates 8832
images where the image size is 32×32.
Figure 7: Samples of the Brodatz (Brodatz, 1966) textures
used in our experiments.
The Brodatz database (Brodatz, 1966) used in
our study consists in a set of 36 texture images. This
database is formed by near-isotropic textures and the
original images were split in 4 (database BD 00000),
16 (database BD 00001) and 64 sub-images
(database BD 00002). Database BD 00000 consists
of 144 texture images (image size: 256×256),
database BD 00001 has 576 texture images (image
size: 128×128) and database BD 00002 comprises
2304 images (image size: 64×64). A number of
Brodatz textures used in our experiments are
depicted in Figure 7.
In our experiments half of the images contained
in each database were used for training while the
remaining half was used for testing. As an example,
when the experiments were conducted using the
Outex TC 00000 database, 240 images were used for
training and 240 images were used for testing. As
indicated earlier, the similarity between the training
and test textures was evaluated using an SVM
classification scheme where polynomial kernels
were employed to map the feature space. In this
study we have conducted a number of experiments
to evaluate the discriminative power of the texture
features described in the previous section when the
size of the texture images and the size and the
number of windows applied to sample the texture
orientation are varied. Also a number of tests were
conducted to determine the optimal value of the σ
parameter that controls the scale of the derivative of
Figure 6: The 24 textures contained in the Outex database
(Ojala et al, 2002-b).
VISAPP 2008 - International Conference on Computer Vision Theory and Applications
360

Gaussian function that is applied to compute the
partial derivatives in the image.
4.1 Influence of the Parameter σ on the
Classification Results
The aim of these tests is to evaluate the influence of
the parameter σ (that sets the scale of the derivative
of the Gaussian function) on the classification
results. To isolate the effect of this parameter on the
classification results, the feature vector that
describes the texture is formed only by the
distribution of the dominant orientations when
calculated in the smallest (3×3) neighbourhood. The
classification results when applied to the Outex and
Brodatz databases are illustrated in Table 1 (to limit
the size of Table 1, the results of the experiments are
reported only for databases TC 00000, TC 00001,
BD 00000 and BD 00001).
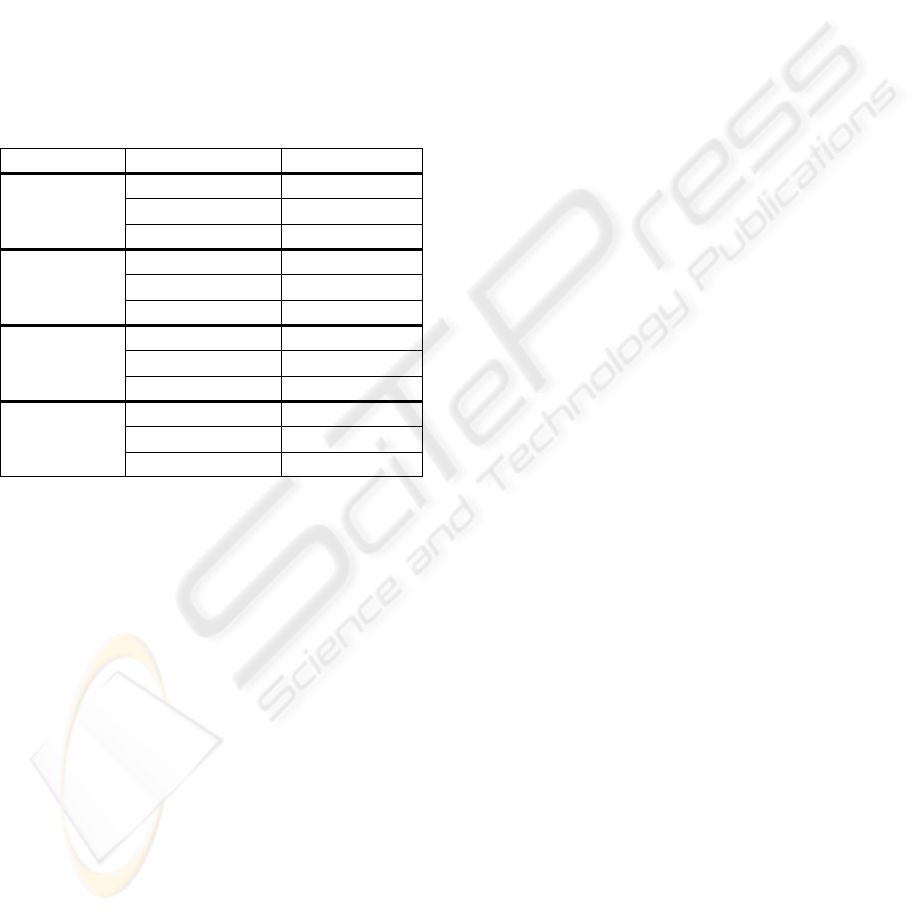
Table 1: The influence of the parameter σ (scale of the
derivative of Gaussian function) on the classification
results.
Database Parameter σ Accuracy [%]
TC 00000
(128×128)
0.5 91.66
1.0 95.00
1.5 92.91
2.0 89.58
2.5 80.83
TC 00001
(64×64)
0.5 78.21
1.0 69.78
1.5 65.43
2.0 47.91
2.5 33.33
BD 00000
(256×256)
0.5 91.66
1.0 83.33
1.5 75.00
2.0 72.22
2.5 81.94
BD 00001
(128×128)
0.5 94.44
1.0 93.40
1.5 92.36
2.0 90.97
2.5 82.63
These experimental results (see Table 1) indicate
that the best classification results are obtained when
the scale parameter σ
is set to low values in the
range [0.5, 1]. There are two reasons behind these
results. The first is motivated by the fact that with
the increase value of the scale parameter the edges
derived from weak textures are eliminated and the
second reason consists in the requirement to increase
the size of the derivative of Gaussian filters with the
increase of the scale parameter σ (this can be clearly
observed in Table 1 where the classification
accuracy is drastically reduced when the dominant
orientation is calculated for images with a small size
such as those contained in database TC 00001).
Based on the results depicted in Table 1, we have
decided to set the scale parameter σ of the derivative
of Gaussian operator to 0.5 to limit the impact of
undesired texture filtering and the windowing effects
caused by the convolution with large kernels.
4.2 Classification Results when the
Window Size is Varied
A second set of experiments was conducted to
evaluate the influence of the window size
kk
w
×
on
the classification results. To isolate the effect of the
window size, we have conducted the experiments
where the dominant orientation distribution was
used alone (Table 2) and to evaluate the
complementary character of the texture distributions
discussed in Section 3, the dominant orientation
distribution was used in conjunction with the
contrast and orientation coherence distributions
(Table 3).
Table 2: The influence of the widow size on the
classification results (only the dominant orientation
distribution is employed in the classification process).
Database Window size Accuracy [%]
TC 00000
(128×128)
3×3 91.66
7×7 82.91
11×11 71.25
TC 00001
(64×64)
3×3 78.21
7×7 65.71
11×11 55.58
TC 00002
(32×32)
3×3 45.48
7×7 33.69
11×11 28.39
BD 00000
(256×256)
3×3 91.66
7×7 66.66
11×11 63.88
BD 00001
(128×128)
3×3 94.44
7×7 82.63
11×11 76.73
BD 00002
(64×64)
3×3 85.42
7×7 67.73
11×11 60.27
The experimental results depicted in Table 2
indicate that the discriminative power of the local
dominant orientation distribution decreases with the
increase of the window size. These results were
expected since the local orientations calculated for
larger windows sample the anisotropic properties of
the texture. Another important conclusion resulting
from the tests depicted in Table 2 is that the
EVALUATION OF LOCAL ORIENTATION FOR TEXTURE CLASSIFICATION
361

dominant orientation distribution is not efficient in
sampling the properties of small textures (see the
classification results obtained for database TC
00002).
Table 3: The influence of the widow size on the
classification results (dominant orientation, contrast and
orientation coherence distributions are employed in the
classification process – see Section 3).
Database Window size Accuracy [%]
TC 00000
(128×128)
3×3 97.08
7×7 95.00
11×11 84.16
TC 00001
(64×64)
3×3 95.54
7×7 87.50
11×11 78.21
TC 00002
(32×32)
3×3 70.01
7×7 60.19
11×11 45.40
BD 00000
(256×256)
3×3 97.22
7×7 91.66
11×11 84.72
BD 00001
(128×128)
3×3 99.30
7×7 94.44
11×11 93.75
BD 00002
(64×64)
3×3 94.96
7×7 88.11
11×11 85.51
The inclusion of the contrast and local
orientation coherence distributions not only
increased the overall classification accuracy but also
we note that the discriminative power of the joint
distribution (dominant orientation, contrast,
orientation coherence) is significantly higher than
the discriminative power of the dominant orientation
distribution especially when applied to small texture
images (see the classification results for database TC
00002). However, from the results depicted in
Tables 2 and 3 we can draw some useful
conclusions. The most important finding is that the
distribution of the dominant orientations that are
calculated at micro-level is appropriate to describe
the texture at macro-level. In this regard, when the
local orientation is calculated in a small
neighbourhood this results in a fine sampling of the
texture orientation. Conversely, when the local
orientation is calculated for large texture units, the
distribution of local orientations samples better the
anisotropic character of the texture. The behaviour
of this distribution of local orientations is interesting
as it offers the possibility to sample the properties of
the texture orientation at different sampling rates by
calculating the joint distributions when the window
sized is varied. Another important finding resulting
from the experiments summarized in Tables 2 and 3
is that the inclusion of the contrast and orientation
coherence in a joint texture distribution improves the
discriminative power offered by the distribution of
the local orientations.
Thus, the last experiment was conducted to
evaluate whether the sampling of the orientation of
the texture at different resolutions improves the
overall classification results. In this regard, we have
conducted a number of tests on Outex (Ojala et al,
2002-b) and Brodatz (Brodatz, 1966) databases
where the texture orientation is sampled by the
dominant orientation, contrast and orientation
coherence distributions that are calculated for
texture units with differing sizes in the range 3×3 to
11×11. The experimental results are depicted in
Table 4.
Table 4: Multi-resolution classification results. (3×3 + 7×7
joint distributions), (3×3 + 11×11 joint distributions) and
(3×3 + 7×7 + 11×11 joint distributions).
Database Window size Accuracy [%]
TC 00000
(128×128)
3×3 + 7×7 97.91
3×3 + 11×11 96.66
3×3 + 7×7 + 11×11 97.50
TC 00001
(64×64)
3×3 + 7×7 95.64
3×3 + 11×11 92.80
3×3 + 7×7 + 11×11 94.12
TC 00002
(32×32)
3×3 + 7×7 76.87
3×3 + 11×11 69.06
3×3 + 7×7 + 11×11 73.25
BD 00000
(256×256)
3×3 + 7×7 100
3×3 + 11×11 100
3×3 + 7×7 + 11×11 100
BD 00001
(128×128)
3×3 + 7×7 99.65
3×3 + 11×11 98.26
3×3 + 7×7 + 11×11 98.95
BD 00002
(64×64)
3×3 + 7×7 94.62
3×3 + 11×11 93.75
3×3 + 7×7 + 11×11 94.18
The results shown in Table 4 clearly indicate that
the classification accuracy increased when the
texture orientation was sampled at different
resolutions. From these results the best classification
results have been achieved when the orientation of
the texture is sampled by the (3×3 + 7×7) joint
distribution. We note that the classification results
did not improve when the joint distribution was
calculated for all resolutions (3×3, 7×7, 11×11).
These experimental results indicate that in the
classification process the local sampling of the
texture orientation at micro-level has a greater
discriminative power than the texture anisotropy that
is sampled when the local orientation is estimated in
larger neighbourhoods. The classification results are
consistent when applied to two different texture
databases and their discriminative power is
VISAPP 2008 - International Conference on Computer Vision Theory and Applications
362
comparable with that offered by other texture
descriptors such as Local Binary Patterns (Ojala et
al, 2002-a), Coordinated Cluster Representation
(Sanchez et al, 2003) and the statistical features
calculated from grey-level co-occurrence matrices
(Haralick, 1979).
The computational complexity of the algorithm
applied to calculate the dominant orientation,
contrast and orientation coherence distributions from
one texture image at different observation scales is
depicted in Table 5. The experiments have been
conducted using a 2.4 GHz AMD X2 4600 PC and
running Windows XP.
Table 5: Computational complexity of the algorithm
applied to calculate the dominant orientation, orientation
coherence and contrast distributions.
Image Size Window size Time[sec]
256×256
3×3 0.710
7×7 0.920
11×11 1.296
128×128
3×3 0.170
7×7 0.219
11×11 0.312
64×64
3×3 0.035
7×7 0.046
11×11 0.078
32×32
3×3 0.016
7×7 0.031
11×11 0.047
5 CONCLUSIONS
The aim of this paper was to evaluate the
discriminative power of the local texture orientation
in the classification process. The main contribution
of this work resides in the methodology proposed to
calculate the orientation of the texture at macro-level
as the distribution of dominant orientations
calculated for all texture units in the image that
sample the texture orientation at micro-level. The
distribution of the dominant local orientations in the
image proved to be a robust texture feature when
applied to classify large texture images, but its
discriminative power was significantly lower when
applied to the classification of small texture images.
Thus, in this paper we proposed to complement the
distribution of dominant orientations in the image
with two additional distributions that measure the
local contrast and local orientation coherence in the
neighbourhood where the local dominant orientation
was calculated. The inclusion of these two measures
proved to be appropriate especially when the new
joint descriptor was applied to the classification of
texture databases containing images defined by
small textures. Another important finding resulting
from this investigation is the fact that the
classification accuracy has improved when the
orientation of the texture was sampled at different
resolutions. One advantage of the texture extraction
approach detailed in this paper over other texture
descriptors such as Local Binary Patterns (Ojala et
al, 2002-a) and grey-level co-occurrence matrices
(Haralick, 1979) resides in the fact that the proposed
orientation distributions can be further extended to
be rotational invariant since they are π-periodic with
respect to the orientation of the texture. The
experimental results reported in this paper are
promising and indicate that the distribution of local
texture orientation is a robust feature that can
describe the texture at macro-level. In our future
studies we will further develop the proposed texture
analysis technique to produce a rotation invariant
representation and to analyse the effect of the non-
even illumination on texture classification accuracy.
ACKNOWLEDGEMENTS
This work was funded in part by the Science
Foundation Ireland (Research Frontiers Programme)
and the OVPR-DCU Research Fellowship
Programme. The authors would also like to thank
Dr. Antonio Fernandez, University of Vigo, Spain,
for his insightful comments on this work.
REFERENCES
Brodatz P., 1966. Textures: A Photographic Album for
Artists and Designers. Dover Publications, New York,
1966.
Canny J., 1986. A computational approach to edge
detection. IEEE Transactions on Pattern Analysis and
Machine Intelligence, 8(6), pp. 679-698.
Chellappa R., Kashyap R.L., Manjunath B.S., 1998.
Model based texture segmentation and classification,
In The Handbook of Pattern Recognition and
Computer Vision, C.H. Chen, L.F. Pau and P.S.P
Wang (Editors) World Scientific Publishing.
Chang C., Lin C.J., 2001. LIBSVM: A library for support
vector machines, www.csie.ntu.edu.tw/~cjlin/libsvm.
Dyer C.R., Hong T., Rosenfeld A., 1980. Texture
classification using gray level co-occurrence based on
edge maxima, IEEE Transactions on Systems, Man,
and Cybernetics, 10, pp. 158-163.
Flores M.A., Leon L.A., 2003. Texture classification
trough multiscale orientation histogram analysis, In
EVALUATION OF LOCAL ORIENTATION FOR TEXTURE CLASSIFICATION
363

Scale Space Methods in Computer Vision, LNCS
2695, pp. 479-493.
Germain C., Da Costa J.P., Lavialle O., Baylou P., 2003.
Multiscale estimation of vector field anisotropy
application to texture characterization, Signal
Processing, 83, pp. 1487-1503.
Haralick R.M., 1979. Statistical and structural approaches
to texture, In Proc of IEEE, 67, pp. 786-804.
Kass M, Witkin A, 1987. Analyzing oriented patterns,
Computer Vision, Graphics, and Image Processing,
37(3), pp. 362-385.
Liu X., Wang D., 2003. Texture classification using
spectral histograms”, IEEE Transactions on Image
Processing, 12(6), pp. 661-670.
Manjunath B.S., Ma W.Y., 1996. Texture features for
browsing and retrieval of image data, IEEE
Transactions on Pattern Analysis and Machine
Intelligence, 18(8), pp. 837- 842.
Marimon D., Touradj E., 2007. Orientation histogram-
based matching for region tracking, In 8
th
International Workshop on Image Analysis for
Multimedia Interactive Services, Santorini, Greece.
Materka A., Strzelecki M., 1998. Texture analysis
methods – A review, Technical Report, University of
Lodz, Cost B11 Report.
Ojala T., Pietikainen M., Maenpaa T., 2002.
Multiresolution gray-scale and rotation invariant
texture classification with local binary patterns, IEEE
Transactions on Pattern Analysis and Machine
Intelligence, 24(7), pp. 971-987.
Ojala T., Maenpäa T., Pietikainen M., Viertola J.,
Kyllonen J., Huovinen S., 2002. Outex – a new
framework for empirical evaluation of texture analysis
algorithms, In Proc. 16th International Conference on
Pattern Recognition, vol. 1, Quebec, Canada, pp. 701–
706.
Petrou M., Sevilla P.G., 2006. Image Processing: Dealing
with Texture, John Wiley & Sons, 2006.
Sanchez-Yanez R.E, Kurmyshev E.V., Fernandez A.,
2003. One-class texture classifier in the CCR feature
space, Pattern Recognition Letters, 24, pp. 1503-1511.
Zhou J., Xin L., Zhang D., 2003. Scale-orientation
histogram for texture image retrieval, Pattern
Recognition, 36, pp. 1061-1063.
VISAPP 2008 - International Conference on Computer Vision Theory and Applications
364
