
MUL
TIRESOLUTION MESH SEGMENTATION OF MRI BRAIN
USING CLASSIFICATION AND DISCRETE CURVATURE
Sami Bourouis, Kamel Hamrouni
Ecole Nationale d’Ing
´
enieurs de Tunis
Laboratoire de Syst
`
emes et de Traitement du Signal : LSTS
Enit, BP-37, Le Belv
´
ed
`
ere 1002 Tunis, Tunisia
Mounir Dhibi
Ensieta E312, 2 rue Francois Verny 29806 Brest Cedex -9, France
Keywords:
Brain segmentation, MRI, Statistical classification, Progressive meshes, Mesh segmentation, discrete curva-
tures.
Abstract:
This paper presents a method for brain tissue segmentation and characterization of magnetic resonance imag-
ing (MRI) scans. It is based on statistical classification, differential geometry, and multiresolution representa-
tion. The Expectation Maximization algorithm and k-means clustering are applied to generate an initial mask
of tissue classes of data volume. Then, a hierarchical multiresolution representation is applied to simplify pro-
cessing. The idea is that the low-resolution description is used to determine constraints for the segmentation at
the higher resolutions. Our contribution is the design of a pipeline procedure for brain characterization/labeling
by using discrete curvature and multiresolution representation. We have tested our method on several MRI
data.
1 INTRODUCTION
Medical image analysis is a complex task because
medical images usually involve a large amount of
data. The process of generating 3D views to visu-
alize structural information and spatial anatomic rela-
tionships is so difficult, which is usually carried out
in the clinician’s mind. Magnetic Resonance Imaging
provides three-dimensional description of the human
brain which serves as a reference for clinical investi-
gations as well as for functional studies. Geometric
modelling, mesh representation and mesh segmenta-
tion of anatomical structures in 3D images are becom-
ing an increasingly important processing step for vi-
sualization, analysis and interpretation of the brain ac-
tivity. Moreover, geometric measurement of the cor-
tex helps in understanding brain anatomy and func-
tion. In addition, the patient brain surface labeling
provides a map of the brain folds where the neuro-
radiologist and the neurosurgeon can easily track the
features of interest.
The 3D mesh representation is widely used to rep-
resent 3D objects in various applications. It is also
used to modelize and visualize complex objects and
scenes, which cannot be modelled by any geometric
functions. One interesting problem in analysis of sur-
face mesh is the mesh segmentation. The problem
is to cluster vertices of a mesh that are close to each
other and have similar property (e.g., curvature or dis-
tance to a fitting plane) into the same group. Mesh
segmentation has become an important component in
the field of medical applications and computer graph-
ics. For example, the need to precisely locate the site
of functional activation within an automatic frame-
work requires the characterization/labeling of the sur-
face mesh.
In the last several years, many algorithms have
been proposed in this growing area, offering a di-
versity of methods and various evaluation criteria.
For example, Mangan and Whitaker (Mangan and
Whitaker, 1999) proposed an approach using the wa-
tershed algorithm for partitioning 3D surface meshes.
In their method, total curvature is computed and used
in segmentation. Initial segments are set up from local
minima of the total curvature. However, in some ob-
jects, local minima of the total curvature is not easy
to find. Jaume et al. (Jaume et al., 2002) proposed
an algorithm that matches progressively an atlas la-
beled mesh to the patient brain mesh from the largest
folds to the smallest ones. Then they transfer the la-
bels from the matched mesh to label the patient mesh.
Due to the surface meshes produced at increas-
421
Bourouis S., Hamrouni K. and Dhibi M. (2008).
MULTIRESOLUTION MESH SEGMENTATION OF MRI BRAIN USING CLASSIFICATION AND DISCRETE CURVATURE.
In Proceedings of the Third International Conference on Computer Vision Theory and Applications, pages 421-426
DOI: 10.5220/0001078704210426
Copyright
c
SciTePress

ing complexity, the need for an accurate simplifica-
tion of surface meshes is becoming more and more
urgent. This need is not only due to rendering speed
reasons, but also to allow fast transmission of 3D
models in network-based applications. Indeed, effi-
cient simplification algorithms may optimize initial
meshes and replace them by nearly indistinguishable
approximations and can hope to automate these tasks.
In recent years, the problem of surface simplifica-
tion has received increasing attention. Several dif-
ferent algorithms have been formulated for simpli-
fying surfaces. Schroeder et al. (Schroeder et al.,
1992) proposed an algorithm ”decimation of triangle
meshes” to reduce the number of triangles in a trian-
gle mesh, while preserving the original topology and
forming good approximation to the original geometry.
Another algorithm has been proposed by Rossignac
and Borrel (Rossignac and Borrel, 1993). It is one
of the few works which is able to process arbitrary
polygonal input. Others algorithms have been pub-
lished that simplify models by iteratively contracting
edges. The essential difference between these algo-
rithms lies in how they choose an edge to contract.
Some notable examples of such algorithms are those
of Hoppe (Hoppe, 1996) and Ronfard et al. (Ronfard
and Rossignac, 1996).
This work is initially motivated by the need to
describe and characterize 3D data in the analysis of
functional imaging data. We propose in this paper
a pipeline steps for the problem of 3D mesh seg-
mentation of the brain in magnetic resonance images.
Our algorithm uses three stages to segment MRI im-
age. Initially, data is classified into three main classes
in order to extract white matter (WM), gray matter
(GM), cerebral-spinal fluid (CSF). Then, we generate
a discrete representation of each tissue class and we
create a mutiresolution representation for each one. In
the third stage, we segment the obtained meshes using
a criteria based on discrete curvature. The proposed
framework is presented in figure 1.
2 DISCRETE REPRESENTATION
OF BRAIN TISSUES
The proposed framework uses a combination of sta-
tistical classification, isosurface extraction, multires-
olution representation and brain labeling. These steps
address various problems in computer graphics, sci-
entific visualization, analysis and interpretation of the
brain activity and many others. In the next sections
we explain in details our method and present some
results.
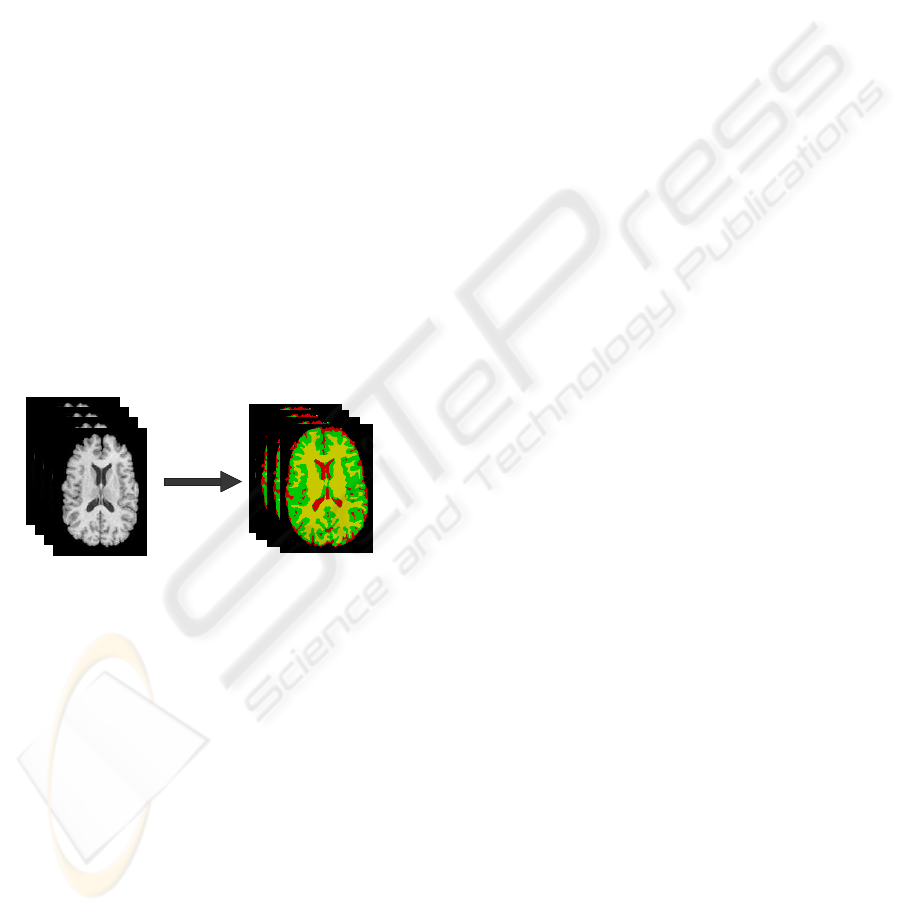
Figure 1: The general principle of the method.
2.1 Expectation Maximization
In statistical classification, each object is represented
by d features, and the goal of classification becomes
finding compact and disjoint regions for classes in a
d-dimensional feature space. Such decision regions
are defined by decision rules that are known or can
be trained. In the case of unsupervised classifica-
tion, the Expectation Maximization (EM) algorithm
(Dempster et al., 1977), is an efficient iterative proce-
dure to compute the Maximum Likelihood (ML) esti-
mate in the presence of hidden data f. In short, the EM
alternates between two steps: an expectation (E) step
and a maximization (M) step. In the E-step, the miss-
ing data are estimated given the observed data and
current estimate of the model parameters. In the M-
step, we compute the maximum likelihood estimates
of the parameters by maximizing the expected likeli-
hood found in the E-step. The parameters found in
the M-step are then used to begin another E-step, and
the process is repeated.
Let us consider the mean parameter µ
k
and the
variance parameter σ
k
of the intensity distribution
of the k-th tissue class grouped in θ
k
such as θ
k
=
{µ
k
,σ
k
}. We denote also π
k
the prior probability of
each class k and γ
k
i
the posteriori probability calcu-
lated in each voxel i for each class k. In the expec-
tation step, we calculate the posteriori probability ac-
cording to the following formulas:
γ
k
i
= P(x
k
/y
k
,θ
k
) =
π
k
i
f
k
(y
i
/θ
k
)
∑
K
l=1
π
l
i
f
l
(y
i
/θ
l
)
(1)
In the maximization step, we estimate data driven pa-
rameters by:
π
k
=
∑
K
l=1
γ
k
i
N
µ
k
=
∑
K
l=1
γ
k
i
y
i
∑
K
l=1
γ
k
i
σ
2
k
=
∑
K
l=1
γ
k
i
(y
i
−µ
k
)(y
i
−µ
k
)
∑
K
l=1
γ
k
i
(2)
VISAPP 2008 - International Conference on Computer Vision Theory and Applications
422
2.2 K-means Clustering
K-means clustering is a popular clustering algorithm
because it is simple and usually converges to a reason-
able solution. Here, we apply the k-means algorithm
in order to define classes that represent statistical dis-
tributions of intensity values in the voxels and to ex-
tract different tissues. K-means works as follows:
• Obtaining the initial k means input,
• Assigning each measurement vector in a sample
container to its closest mean among the k number
of means,
• Calculating each cluster’s mean from the newly
assigned measurement vectors (updates the cen-
troid (mean) of k clusters),
• Repeating step 2 and step 3 until it meets the ter-
mination criteria.
In the context of Medical Imaging, each class is
typically associated to a particular type of tissue and
can therefore be used as a form of image segmenta-
tion. Fig.2 illustrates the classification of an MRI data
into three classes (k=3): GM, WM and CSF. Parame-
ters are estimated using EM.
Volumetric Data
Classification
Volumetric Data
Classification
Figure 2: k-means clustering.
2.3 Generating Mesh
Representing the surface as explicit geometry is ef-
ficient when used with the conventional computer
graphics approaches for shading and viewing. Fur-
ther, it greatly reduces the necessary data storage and
provides a data structure that can be measured. In our
case, the initial volumetric MRI data is transformed
into a triangulation using a standard isosurface ex-
traction algorithm -Marching Cubes- (Lorensen and
Cline, 1987). Marching cubes provides an accu-
rate three-dimensional polygonal representation that
can be used for other image processing. A cube is
bounded by eight pixels located in two adjacent slices.
Each vertex is coded as either inside or outside the ob-
ject relative to the surface-defining threshold. Based
on the configuration of vertices that lie inside and out-
side the object, the cube is triangulated. The triangles
indicate where the surface passes through the cube.
However, the output from the marching cubes usu-
ally contains multiple small ”useless” meshes. Since
these meshes are physically disconnected from each
other. In order to reduce aliasing artifacts in images,
we use the algorithm proposed in (Whitaker, 2000).
Briefly, the algorithm is as follows: The binary vol-
ume is used as a set of constraints in an iterative relax-
ation process of an initial estimate of the surface. The
surface is allowed to deform under curvature flow. A
set of constraints is introduced in its movement which
fits the surface to the volume in such a way as to min-
imize surface area, producing a smooth estimation.
3 MESH SEGMENTATION
A surface’s behavior can be described by dividing the
surface into distinct regions of elliptic behavior and
hyperbolic behavior. The regions of elliptic behavior
can be classified into convex and concave regions by
considering the direction of the surface normal.
3.1 Mesh Simplification
Marching Cubes is very efficient but usually produces
more than the necessary number of polygons needed
to represent an object accurately. It records all details
associated with the original data regardless of whether
these details are insignificant. The result contains an
enormous number of extremely small triangles that
prevent interactive render of models. Therefore, the
problem is how to create a new set of surfaces, which
are less complex than the original one without mod-
ifying the overall geometric information. To solve
this problem, we have resorted to mesh simplifica-
tion techniques. Indeed, if we segment the surface at
a high resolution, the segmentation will be too com-
plex. A way to accelerate this process and preserve
topology is to create a low-resolution representation
of the model by using the PM algorithm. Thus, mesh
segmentation at a low resolution defines constraints
for more complex features detected at the higher res-
olution.
The PM algorithm (Hoppe, 1996) is attractive be-
cause it simplifies a model by minimizing an energy
function. Indeed, the method provides four visual
benefits. It uses many polygons to represent areas of
high curvature. It aligns long edges along directions
of low curvature. It adjusts the aspect ratios of trian-
gles to match the local curvature. Finally, it places
edges and vertices near sharp features of the original
MULTIRESOLUTION MESH SEGMENTATION OF MRI BRAIN USING CLASSIFICATION AND DISCRETE
CURVATURE
423
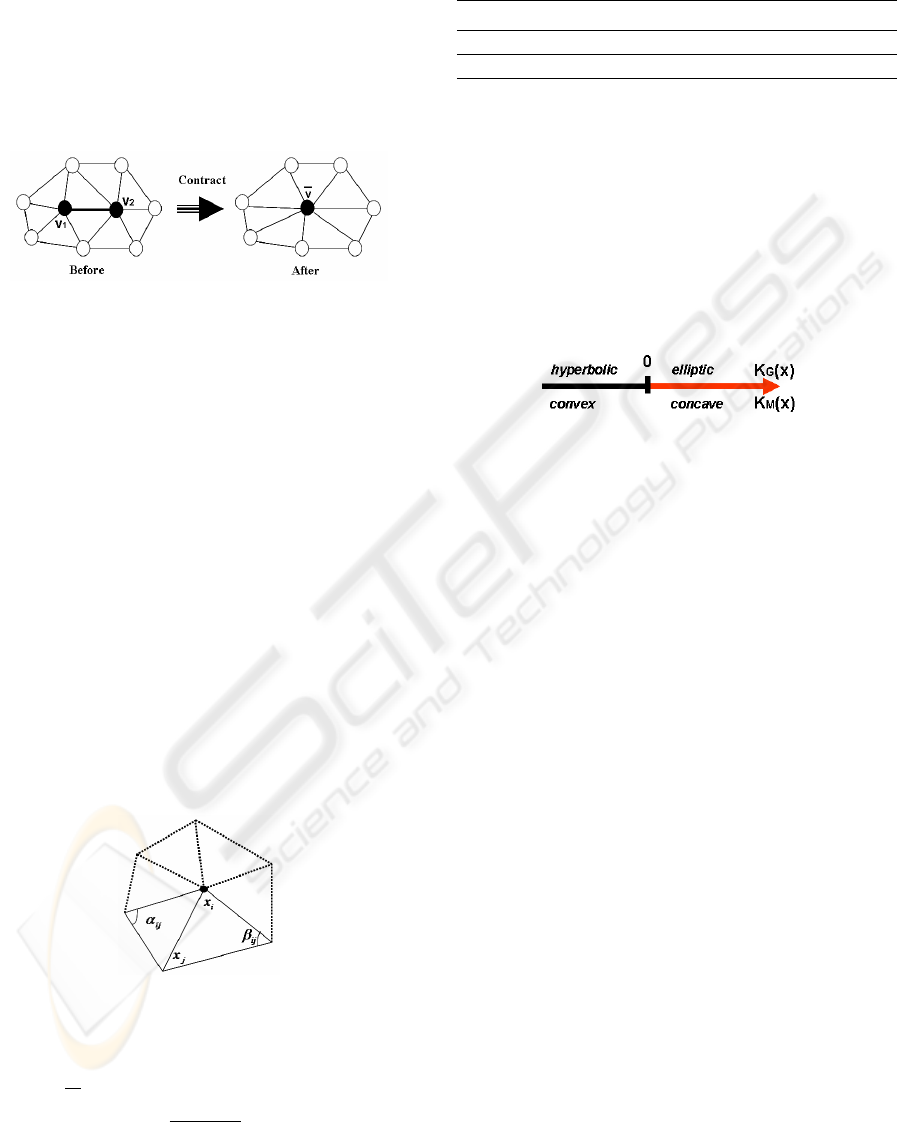
model. An iteration of this algorithm uses an edge
collapse operation. This operation (Fig. 3) selects
an edge and replaces it with a single vertex. This re-
moves one vertex, three edges, and two faces. The
edge collapse operation is attractive because it allows
the new vertex to be placed in a manner that helps
preserving the location and the shape of the original
surface.
Figure 3: Edge collapse operation .
3.2 Curvature-based Segmentation
In surface analysis, we compute gaussian curvature
and mean curvature, and later use them to classify the
surface type of vertices. The major complication is
that curvature cannot be directly evaluated for trian-
gle meshes because it is mathematically defined for
smooth surfaces only. However, discrete differential-
geometry operators have been developed which can
estimate curvatures on triangulated manifolds.
many approximation schemes for curvature esti-
mates meshes have been developed such as (Max,
1999; Hamman, 1993). We apply here some op-
erators, which are derived recently by Meyer et al.
(Meyer et al., 2002), to estimate curvature informa-
tion at each vertex in the mesh. We denote k
H
and k
G
,
the Mean and the Gaussian curvature operators. In
our algorithm, we calculate these operators according
to the following formulas:
Figure 4: 1-ring neighbors and angles opposite to an edge.
(
k
H
=
1
2A
∑
j∈N(i)
(cot(α
i j
) + cot(β
i j
))(x
i
− x
j
)
k
G
=
2π−
∑
] f
j=1
Θ
j
A
(3)
Where α
i j
and β
i j
are the two angles opposite to the
edge in the two triangles sharing the edge (x
i
,x
j
) as
Table 1: Possible combinations of surface types according
to discrete curvature criteria.
Mean(x
i
) convex convex concave concave
Gauss(x
i
) hyperb elliptic hyperb elliptic
Color green yellow blue red
depicted in figure. 4. Θ
j
is the angle of the j-th face
at the vertex x
i
and ] f denotes the number of faces
around this vertex.
If the value of k
G
is negative, then we have a
hyperbolic behaviour, otherwise it is an elliptic one;
then, the regions of elliptic or hyperbolic behaviour
is convex if the k
H
value is negative, otherwise it is
concave. This mechanism is illustrated in the figure
5.
Figure 5: Curvature-based criteria for surface characteriza-
tion.
4 EXPERIMENTAL RESULTS
We have performed a series of experiments on brain
MR images. Resulting segmentations are depicted in
Figures 6, 7 and 8. Each label corresponds to a dif-
ferent color. The two curvatures used are mean and
gaussian. By combining the operators k
H
and k
G
, we
can encode surface types with different color accord-
ing to table 1. In our case, this leads to four cases (
table 1).
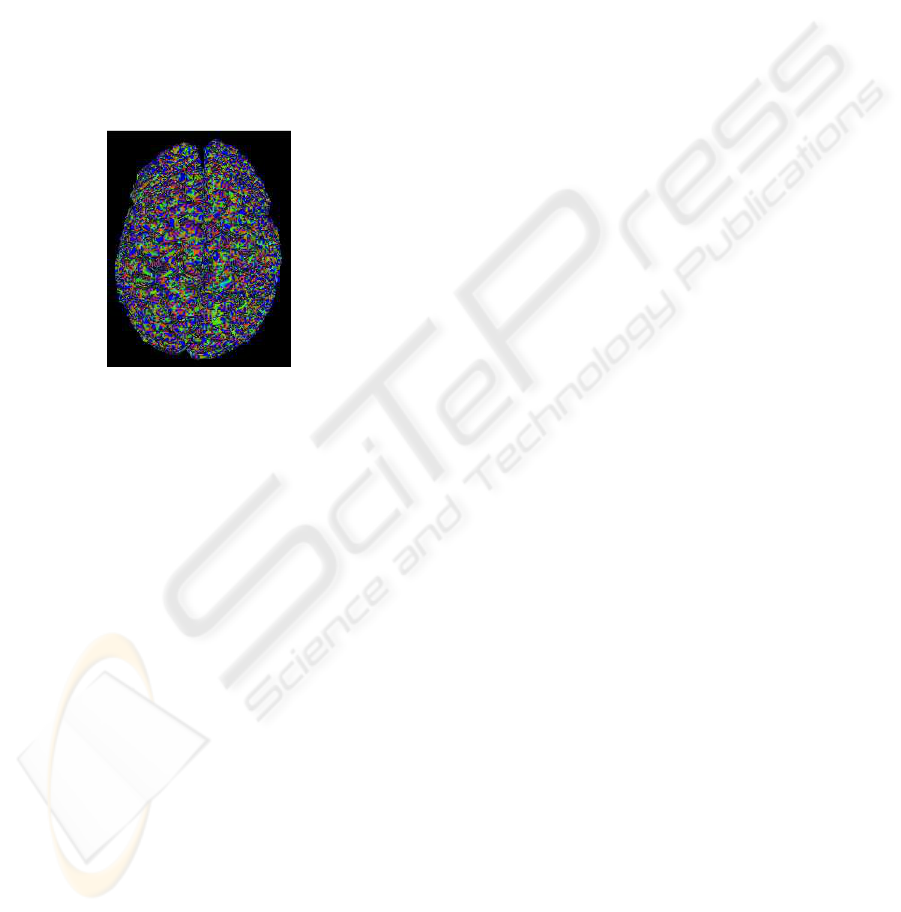
Our segmentation consists of regions of the same
type of curvature according to Table 1 by encoding
surface types with colors. Figure 6 shows the labeling
of the cortical surface into elliptical convex regions
(yellow), elliptical concave regions (red), hyperbolic
convex regions (green), and hyperbolic concave re-
gions (blue). These segmentations are performed in
the case of multiresolution representation as shown
in figures 7 and 8). An inherent difficulty in the in-
terpretation of these results is that there is no def-
inition of what is correct. Some papers use expert
opinion from neurologists on where sulci and gyri ex-
ist. However, visual results can be interpreted given
the idea that gyri are the surfaces top of the brain
folds (ridges), and that sulci are the surfaces within
the brain folds (basins). For example, it will be easy
to distinguish between elliptic and hyperbolic forms.
The final labels resulting from our segmentation are
depicted graphically in figures 7 and 8. Each label
VISAPP 2008 - International Conference on Computer Vision Theory and Applications
424
corresponds to a different color in all obtained res-
olutions. According to these results, we notice that
segmentation at low-resolution (10% of the original
data) leads to an extraction of the major surface fea-
tures/characteristics, whereas when the algorithm is
applied to the surface at high resolution (100%), it
does not necessary produces more relevant structure
information but includes small features, which do not
contribute very much to the overall shape. In addi-
tion, low-resolution description can be used to deter-
mine constraints for the segmentation at higher reso-
lution. For instance, these first results are encourag-
ing but further investigation is required to extend the
algorithm to a large range of data.
Figure 6: Segmentation of the cortical surface according to
table 1.
5 CONCLUSIONS
In this paper, an automated approach for brain MRI
segmentation and discrete mesh characterization is
proposed. We have currently explored and outlined
the importance of multiresolution representation to
simplify processing, segment meshes and accelerate
medical analysis. Our technique has a great interest
in the study of structural and functional characteris-
tics of the brain. It is also relatively computationally
efficient. At this stage, we have only applied the ap-
proach to a few experimental cases and we have pre-
sented some preliminary results to demonstrate its po-
tential: the method gives satisfying results for mesh
labelling in the case of multiresolution representation.
Even if they have not yet been compared to manual
or other automatic segmentation results, we think that
they are encouraging and faster than manual proce-
dures. However, there are some future works to do.
Clinical validation remains to be done, which will re-
quire additional work. Future validations will com-
pare our segmentation with manually labelled data
and other segmentation results. Finally, the same
framework can be used and extended to segment and
quantify abnormal brains.
REFERENCES
Dempster, A., Laird, N. M., and Rubin, D. (1977). Maxi-
mum likelihood from in complete data via the em al-
gorithm. Journal of the Royal Statistical Society, 1:1–
38.
Hamman, B. (1993). Curvature approximation for tri-
angulated surfaces. In: Gerald Farin et al., edi-
tors, Geometric Modelling, Computing Supplemen-
tum, Springer-Verlag, Vienna, Austria, pages 139–
153.
Hoppe, H. (1996). Progressive meshes. SIGGRAPH ’96
Proc, pages 99–108.
Jaume, S., Macq, B., and Warfield, S. (2002). Labeling
the brain surface using a deformable multiresolution
mesh. MICCAI, pages 451–458.
Lorensen, W. and Cline, H. (1987). Marching cubes:
A high-resolution 3-d surface construction algorithm.
ACM Comput. Graph, 21:163–170.
Mangan, A. and Whitaker, R. (1999). Partitioning 3d sur-
face meshes using watershed segmentation. IEEE
Transactions on Visualization and Computer Graph-
ics, 5.
Max, N. (1999). Weights for computing vertex normals
from facet normals. Journal of Graphics Tools,
4(2):1–6.
Meyer, M., Desbrun, M., and Schroder, P. (2002). Dis-
crete differential-geometry operators for triangulated
2-manifolds. International Workshop on Visualization
and Mathematics, Berlin, Germany,.
Ronfard, R. and Rossignac, J. (1996). Full-range approxi-
mation of triangulated polyhedra. Computer Graphics
Forum, Proc. Eurographics ’96, 15:1–38.
Rossignac, J. and Borrel, P. (1993). Multi-resolution 3d ap-
proximations for rendering complex scenes. In Falci-
dieno, B. and Kunii, T., editors, Theoretical Aspects of
Computer Software, Modeling in Computer Graphics:
Methods and Applications, pages 455–465.
Schroeder, W., Zarge, J., and Lorensen, W. (July 1992).
Decimation of triangle meshes. Computer Graphics
(SIGGRAPH ’92 Proc.), 26:65–70.
Whitaker, R. (2000). Reducing aliasing artifacts in iso-
surfaces of binary volumes. IEEE Volume Visualiza-
tion and Graphics Symposium, 21:23–32.
MULTIRESOLUTION MESH SEGMENTATION OF MRI BRAIN USING CLASSIFICATION AND DISCRETE
CURVATURE
425
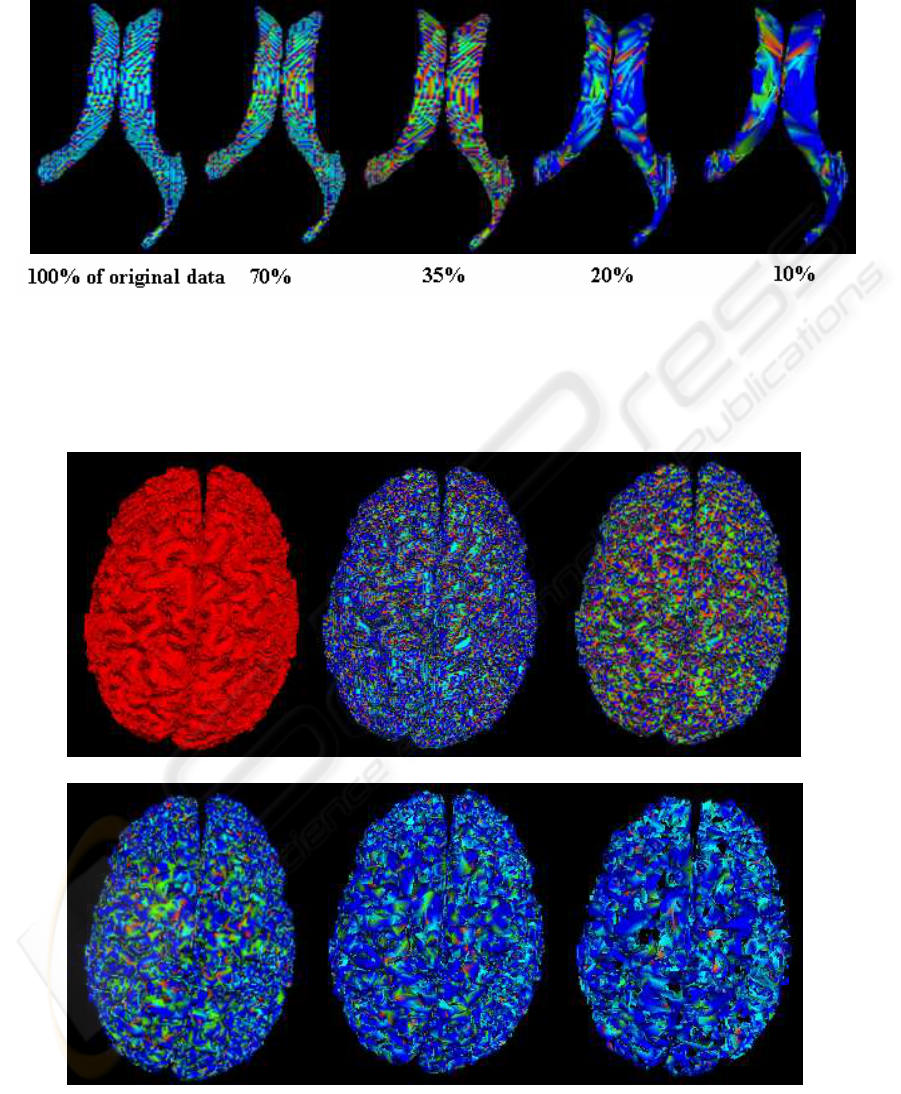
Figure 7: Segmentation of ventricle surface at different resolutions according to table 1.
100% of original data
50%
20%
10%
3%
100% of original data
50%
20%
10%
3%
Figure 8: Segmentation of cortical surface at different resolutions according to table 1.
VISAPP 2008 - International Conference on Computer Vision Theory and Applications
426
