
HISTORICAL DOCUMENT IMAGE BINARIZATION
Carlos A. B.Mello, Adriano L. I. Oliveira
Department of Computing Systems, Polytechnic School of Pernambuco, University of Pernambuco, Brazil
Ángel Sánchez
Superior School of Experimental Science and Technology, Rey Juan Carlos University, Spain
Keywords: Document Processing, Image Thresholding, Historical Documents, Entropy.
Abstract: Preservation and publishing historical documents are important issues which have gained more and more
interest over the years. Digital media has been used to storage digital versions of the documents as image
files. However, this digital image needs huge storage space as usually the documents are digitized in high
resolutions and in true colour for preservation purposes. In order to make easier the access to the images
they can be converted into bi-level images. We present in this work a new method composed by two
algorithms for binarization of historical document images based on Tsallis entropy. The new method was
compared to several other well-known threshold algorithms and it achieved the best qualitative and
quantitative results when compared to the gold standard images of the documents, measuring precision,
recall, accuracy, specificity, peak signal-to-noise ratio and mean square error.
1 INTRODUCTION
This research takes place in the PROHIST Project
(ProHist)(Mello et al., 2006) whose main objectives
are the development of methods for effective
preserving and publishing historical documents. The
documents are digitized in 200 dpi, true colour and
stored in JPEG with 1% of loss. Even in this format,
each image occupies in average 400 KBytes. In spite
of the large use of broadband Internet, it is very
difficult to access an archive with thousand of such
images. So we must provide means to decrease the
file size. Re-digitization of the complete archive
with lower resolutions is not a possible solution as
the documents can not be digitized several times; the
digitization process can alter the physical features of
the paper itself. The best solution comes as a
reduction of the number of colours. The main
information of the document is the text. For several
applications, the colour of the paper is not relevant.
In order to read a document, we just need to preserve
the colours that belong to the ink. To achieve this
objective, thresholding algorithms (Parker, 1997) are
used to convert into white the colours classified as
paper and to turn black the colours classified as ink.
However, this is not a simple task when we deal
with images of historical documents which have
unique features as:
1) Some documents are written on both sides of the
paper allowing the presence of the phenomenon
know as bleed-through (when the ink transposes
from one side of the paper to the other side);
2) In other documents, the ink has faded;
3) Some documents have large black borders,
adhesive marks or are damaged;
4) Other documents present the paper too darkened.
All of these elements must be considered for the
creation of a new thresholding algorithm.
Our archive contains a group of more than
30,000 images of documents from the end of the 19
th
century onwards. It is composed by letters,
documents and forms, at most.
In this paper, we present a new method for
thresholding greyscale images of historical
documents. The method is composed by two
different entropy-based algorithms. According to the
threshold value defined by the first algorithm, the
second one is executed or not.
Next, we present some entropy-based
thresholding algorithms that establish the base for
the new method presented in Section 3. Section 4
presents an evaluation of their performance and
Section 5 concludes the paper.
108
Mello C., Oliveira A. and Sánchez Á. (2008).
HISTORICAL DOCUMENT IMAGE BINARIZATION.
In Proceedings of the Third International Conference on Computer Vision Theory and Applications, pages 108-113
DOI: 10.5220/0001078201080113
Copyright
c
SciTePress
2 ENTROPY-BASED
BINARIZATION ALGORITHMS
Entropy (Shannon, 1948) is a measure of
information content. In Information Theory, it is
assumed that there are n possible symbols, s, which
occur with probability p(s). The entropy associated
with the source S of symbols is:
∑
=
−=
n
i
ii
spspSH
0
])[log(][)(
(1)
where the entropy can be measured in bits/symbols.
This value can be broken into two parts: the entropy
of black pixels, Hb, and the entropy of the white
pixels, Hw, bounded by threshold value t, where:
∑
=
−=
t
i
ii
spspHb
0
])[log(][
and (2)
∑
+=
−=
255
1
])[log(][
ti
ii
spspHw
There are several entropy-based thresholding
algorithms in literature as: Pun (Pun, 1981), Kapur
et al (Kapur et al., 1985), Li-Lee (Li et al., 1993),
Wu-Lu (Wu et al., 1998), Renyi (Sahho et al.,
1997), Mello-Lins (Mello et al., 2000) , Mello et al.
(Mello et al., 2006) and Silva et al.(Silva et al.,
2006). Some of these algorithms are more important
for our currently work and are going to be briefly
reviewed. More information about the others can be
found at (Sezgin et al., 2004).
Pun’s algorithm analyses the entropy of black
pixels, Hb, and the entropy of the white pixels, Hw,
as defined in Eqs. 2. The algorithm suggests that t is
such that maximizes the function H = Hb + Hw.
Mello-Lins algorithm (Mello et al., 2000)
classifies the document into one of three possible
classes based on Shannon’s entropy and the
threshold value is evaluated as mw.Hw + mb.Hb,
where Hw and Hb are as defined by Pun and the
constants mw and mb are defined according to the
class of the document.
A correction of the initial threshold value is
proposed by Mello et al. (Mello et al., 2006) with
the use of ROC curves (McMillan et al., 2005). The
throc algorithm changes the initial threshold value
based on the behaviour of the ROC curve evaluated
for each new cut-off value. According to the curve,
this value can be increased or decreased. To improve
the performance of the algorithm, it is suggested the
use of percentage of black (Parker, 1997) to define
the initial threshold value.
It was presented in (Silva et al., 2006) a new
entropy-based thresholding algorithm based on
empirical experiments, where the threshold value is
defined by the minimization of the function
|e(t)| = |H’(t)/(H/8) –
α
(H/8)|
where
α
is defined empirically, H’(t) is the entropy
of the a posteriori source and H is the entropy of the
a priori binary source. This algorithm, called Silva-
Lins-Rocha, however, does not work well in images
with black borders as it erases most part of the text
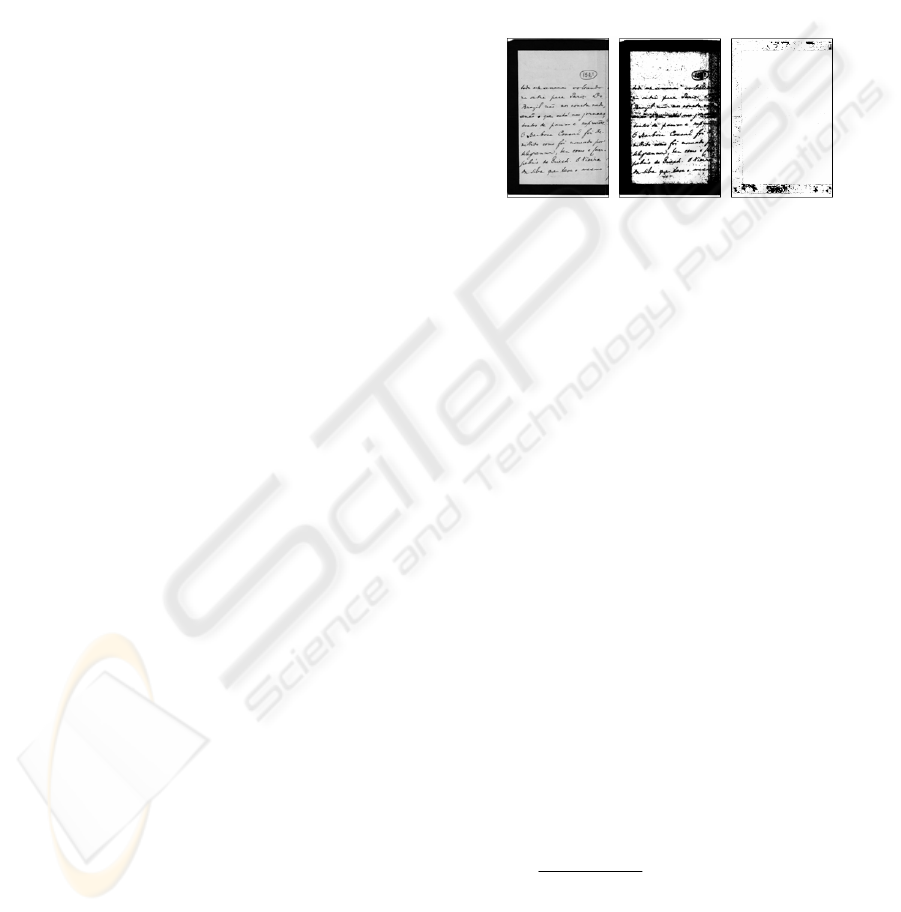
information as can be seen in Figure 1-right. Figure
1 presents another sample document and the results
generated by Pun and Silva-Lins-Rocha algorithms
Figure 1: (left) Sample document, (centre) bi-level image
generated by Pun algorithm and (right) the image
produced by Silva-Lins-Rocha algorithm.
3 NEW ALGORITHMS
In this Section, we present two algorithms that work
together in order to achieve high quality bi-level
images. The first algorithm evaluates an initial
threshold value. In some cases, this threshold value
is greater than the most frequent colour in the image.
We assume that this should not happen as in
documents the most frequent colour must belong to
the background. A cut-off value higher than this
colour suggests that most part of the paper (not the
ink) will remain in the binary image which is not
desired. So, in these cases the second algorithm is
called to evaluate a new threshold value. First, the
images are converted into greyscale for the
processing.
3.1 First Tsallis Entropy Based
Algorithm
According to Tsallis (Tsallis, 1988), an universal
definition of entropy is given by:
1
)(1
)(
−
−
=
∑
α
α
α
i
ip
SH
(3)
where p(i) is a probability as in the classical
definition of entropy and
α
is a real parameter which
value is not defined by Tsallis.
Shannon’s entropy (H) established in Eq. 1 settles
that if a system can be decomposed into two
HISTORICAL DOCUMENT IMAGE BINARIZATION
109

statistical independent subsystems, say A and B,
then H has the extensive or additivity property. This
means that H(A+B) = H(A) + H(B).
Tsallis entropy (Eq. 3) can be broken into two
parts:
)()()( BHAHSH
wb
ααα
+=
(4)
where
∑
=
−
−
−
=
t
i
b
b
ip
X
AH
0
)(
1
1
1
)(
α
α
αα
and (5)
∑
+=
−
−
−
=
255
1
)(
1
1
1
)(
ti
w
w
ip
X
BH
α
α
αα
with X
b
+ X
w
= 1.
The boundary t is the most frequent colour in the
image; as most part of a document image belongs to
the paper, it can be expected that this most frequent
colour is part of the background. H
b
α
is the measure
of the pixels below the colour t and H
w
α
is the
measure of the colours above the threshold t. The
variable t is also used to define the values of X
b
and
X
w
as X
b
is the percentage of colours below t and X
w
is the percentage of colours above t. We considered
the
α
parameter equal to 0.3 for our application.
Different values
α
of produce low quality images.
At first, the documents are classified into one of
three groups. This classification is made based on
the value of Shannon entropy (H) defined in
Equation 1 but with the logarithmic basis taken as
the product of the dimensions of the image (width x
height). As defined in (Kapur, 1994), changes in the
logarithmic basis do not alter the definition of the
entropy. The three classes are:
• Class 1 (H
≤
0.26): documents with few parts of
text or where the ink has faded;
• Class 2 (0.26 < H < 0.30): common documents
with around 10% of text elements;
• Class 3 H
≥
0.30: documents with more black
elements than it should have; this includes
documents with a black border or documents
with back-to-front interference.
These boundaries between classes were defined
empirically analyzing a set of 500 images
representatives of the complete archive. Our data
base is composed of 17% of documents from class 1,
40% from class 2 and 43% from class 3.
Also, as in Pun’s algorithm, the values of Hb and
Hw (Eq. 2) are evaluated, using the most frequent
colour (t) as the separation point. As we are working
with document images, it is reasonable to expect that
the most frequent colour belongs to the paper.
For each of these classes, an analysis must be
made to process the images that belong to them as
can be seen next. The final threshold value, th, is:
αα
wb
HmwHmbth **
+
=
(6)
where mb and mw are multiplicative constants that
are defined for each class as follows.
Class 1 Documents:
This class groups documents with few text areas
along them. This can be found in cases where the
letter has just few words or the ink has faded
severely. In this class, we can also find most part of
the typewritten documents as, in general, the
typewriter ink is not so strong as handwritten
characters making them more susceptible to
degradation of their colours.
Although the images of this class have similar
features in many ways, they differ in basic aspects
as, for example, typewritten documents in general
occupy most part of the sheet of paper (opposing to
the fact that this class groups documents with few
text parts). Because of this, we also consider the
distribution of the pixels of the original image. For
this purpose the value of Hw or Hb is used; we
choose Hw with no loss of generality. For these
images, we have:
• If (Hw
≥
0.1), then mb=2.5 and mw=4.5
(typewritten documents with dark ink and bright
paper);
• If (0.08<Hw<0.1), then mb=mw=6 and
α
=0.35
(documents with the ink faded);
• If (Hw
≤
0.8), then mb=mw=4 (documents with
dark ink and paper).
Class 2 Documents:
This class contains the most common documents of
the archive. Their thresholding just needs a boost in
H
b
α
and H
w
α
to achieve the best solution. So, in
general, the algorithm defines mb = 2.2 and mw = 3.
Some darkened documents need another treatment.
If a document belongs to class 2 and Hw > 0.1, then
the value of mw decreases by half (i.e., mw = 1.5),
unless the most frequent colour is greater than 200
(brighten documents) for which mw = 9.
Class 3 Documents:
These are the documents with more black pixels
than expected in a normal document. Here, we can
have documents with black borders or documents
with ink bleeding interference (documents written in
both sides of the paper). In these cases, the system
must deal with the paper and the transposed ink
turning them to white. Because of this, the mb
parameter is fixed as 1 (as the images do not need a
boost in their black components). In most
VISAPP 2008 - International Conference on Computer Vision Theory and Applications
110
documents, we have mw = 2. Some cases, however,
must be considered when the documents have
brightened paper again. In this class, brighten paper
documents are the ones with most frequent colour (t)
greater than 185:
• If (t >= 185) then
o If (0.071 < hw < 0.096) then mw = 9;
o If (0.096 <= hw < 0.2) then mw = 6.
As said before, if th > t, then the threshold value is
not accepted and a new value is evaluated according
to the next algorithm.
3.2 Second Tsallis Entropy based
Algorithm
Once again, we use the concept of Tsallis entropy.
However, now the α parameter is the main element
in the definition of the threshold. Three classes of
documents are defined as before but with small
changes in their boundaries. Now we have:
• Class 1: H ≤ 0.23;
• Class 2: 0.23 < H < 0.28;
• Class 3: H ≥ 0.28.
Each class groups the same types of documents as
before. Let t be the most frequent colour in the
greyscale image to be binarized and p(i) is the a
priori probability of the grey value i to be present in
the image. If the grey value of a pixel is below t,
then it belongs to the foreground; otherwise, it
belongs to the background. With this in mind, the
distribution of the probabilities of the foreground
and background are p(i)/P
b
(t) and p(i)/P
w
(t),
respectively, where:
∑
=
=
t
i
b
iptP
0
)()(
and
∑
+=
=
255
1
)()(
ti
w
iptP
The a prioi Tsallis entropy for each distribution is
given by:
)1/())/)((1()(
0
−−=
∑
=
α
α
α
t
i
bb
PiptH
and (7)
)1/())/)((1()(
255
1
−−=
∑
+=
α
α
α
ti
ww
PiptH
The authors in (Yan et al., 2006) present a study
of how the
α
parameter can affect the ideal threshold
for an image. Based on the three classes of
documents, we have defined empirically the
following fixed values for the
α
parameter:
• Class 1:
α
= 0.04;
• Class 2:
α
= 0.05;
• Class 3:
α
= 0.3.
With the definition of
α
, H
α
b
and H
α
w
are evaluated
as presented in Equations 7. The threshold value is
then th = H
α
b
+ H
α
w
.
Documents of class 3 need a different approach.
Before the binarization, they need to be
preprocessed. Figure 3-left presents one of these
documents. In general, typewritten letters have a
great amount of characters but the ink is not as
strong as in handwritten letters. In fact, part of the
ink is always faded making harder the thresholding
process. In order to binarize these images, we must
at first use a square root filter to change the colour
distribution of the image. To apply the filter, the
colours are normalized so that they go from 0 to 1,
instead of 0 to 255. The square root of each
normalized pixel is evaluated and denormalized
back to the normal colour range from 0 to 255.
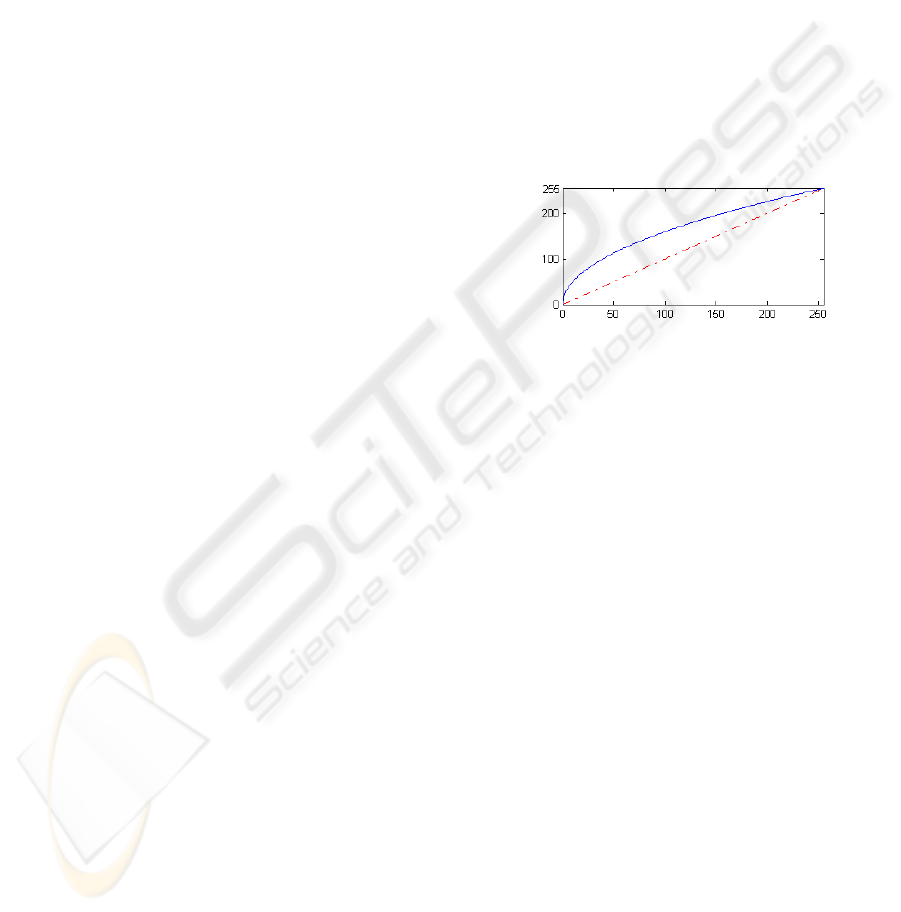
Figure 2 presents a graph that represents the changes
in the colour distribution with the evaluation of the
square root. It shows that the colours increase to
clear tones more rapidly, making the image brighter.
Figure 2: The effect of the square root filter in the colour
distribution: both axis represent the colours of a greyscale
palette; the dashed line represents a direct mapping of one
colour into itself; the continuous curve is the function y =
square_root(x) evaluated over the normalized colours.
After the use of the square root filter, the main
features of the image change and it must be analyzed
again in the search for the correct
α
value. The
process is the same as before with the use of the
most frequent colour and the evaluation of Shannon
and Tsallis entropies. As the images are brighter
than before, the only change is the value defined for
the
α
parameter for class 2 documents:
α
decreases
to 0.02 now. The parameters defined for both
algorithms are fixed for any image as defined by the
rules presented before.
4 RESULTS
Figure 3 presents the results of the binarization of
sample documents from each class for the first
algorithm.
Figure 4 presents a sample document which
threshold value found by the first algorithm was
greater than the most frequent colour of the
document (th=210 and t=182), making necessary
the use of the second algorithm. Figure 4 presents
the original image, the new version after the use of a
HISTORICAL DOCUMENT IMAGE BINARIZATION
111
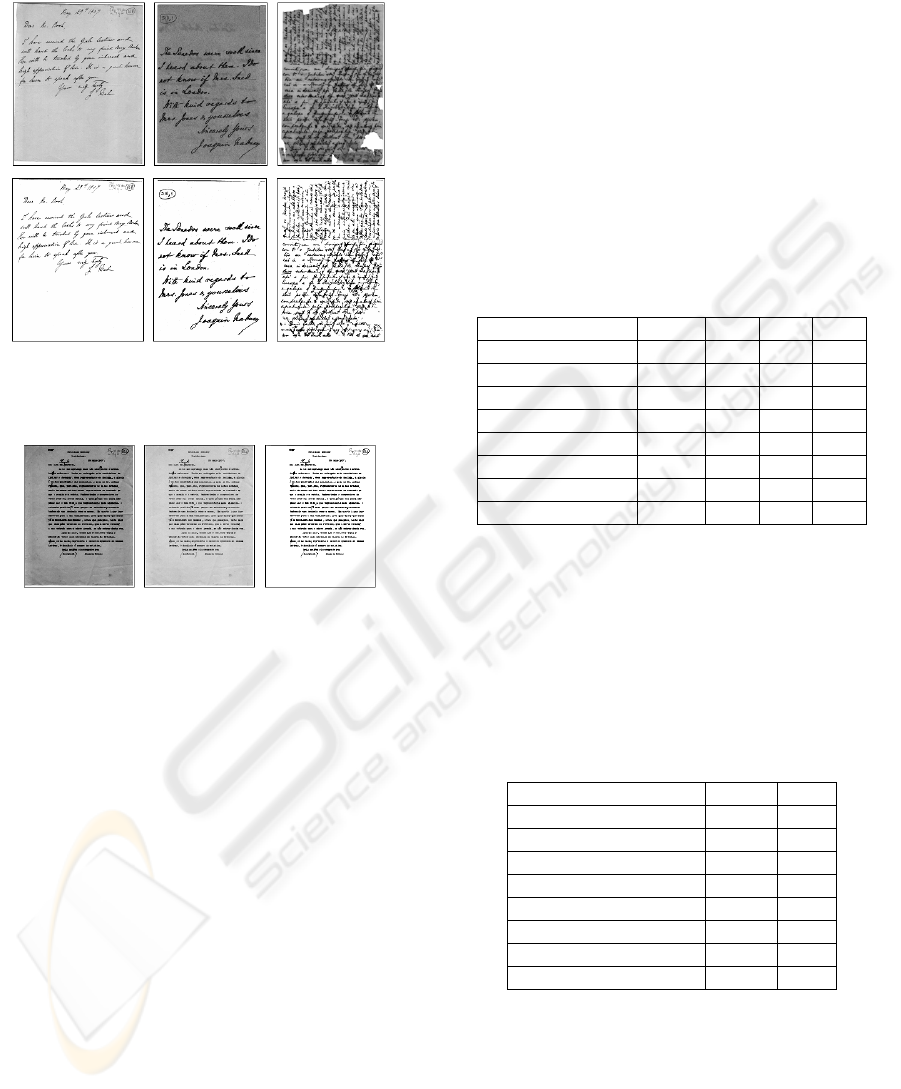
square root filter and the final binary image (with
new th=168).
Figure 3: (top) Sample documents of each class (class 1:
left, class 2: centre and class 3: right) and (bottom) their
binarization by the first algorithm.
Figure 4: (left) Sample document, (centre) image
generated after square root filtering and (right) final
bi-level image produced by the second algorithm.
To evaluate quantitatively the results found, we
analyzed the values of precision, recall, accuracy
and specificity defined by (McMillan and Creelman,
2005):
• Precision (P) = TP/(TP + FP)
• Recall (R) = TP/(TP + FN)
• Accuracy (A) = (TP+TN)/(TP + TN + FP + FN)
• Specificity (S) = TN/(FP + TN)
where TP stands for true positive; FP is false
positive; TN is true negative, and FN is false
negative. The comparison is made using a gold
standard image created manually. For each
document, a perfect bi-level image (the gold
standard) was created by a visual choice of the best
global thresholding value.
An effective algorithm must have:
• Precision≈1: meaning FP≈0, i.e., few paper
elements were incorrectly classified as ink;
• Recall≈1: meaning that FN≈0 or few (or none)
ink elements were incorrectly classified as
paper;
• Accuracy≈1: (FP + FN) ≈0; there was no
misclassification at all;
• Specificity≈1: indicating that FP≈0 and almost
every pixel that belongs to the paper were
classified as that.
Table 1 shows the average result for these four
measures applied to a set of 200 documents
binarized by the new proposed algorithm and by
other entropy-based algorithms in comparison with
the gold standard image. As it can be seen, our
proposal achieved the higher values. We also present
the results generated by the well known format
DjVu (Bottou et al., 1998) which is specific for
document storage.
Table 1: Average values of precision, recall, accuracy and
specificity in a set of 200 bi-level documents generated by
the new proposal and other methods compared with their
ideal images generated manually.
Algorithm P R A S
New Proposal 0.92 0.97 0.99 0.99
Kapur 0.97 0.73 0.96 0.99
Li-Lee 0.98 0.71 0.96 0.99
Pun 0.99 0.22 0.62 0.99
Renyi 0.97 0.69 0.93 0.99
Silva-Lins-Rocha 0.82 0.86 0.96 0.97
Wu-Lu 0.41 0.49 0.94 0.95
DjVu 0.95 0.74 0.90 0.99
Table 2 presents the average values of PSNR (Peak
Signal-to-Noise Ratio) and MSE (Mean Square
Error) for this same set of images. Again, our
proposal achieved the higher PSNR value and lower
MSE value.
Table 2: Average values of PSNR and MSE in a set of 200
bi-level documents generated by the new method (with
both algorithms) and other methods compared with their
ideal image generated manually.
Algorithm PSNR MSE
New Method 25.53 0.01
Kapur 18.11 0.06
Li-Lee 20.62 0.04
Pun 10.37 0.38
Renyi 20.06 0.07
Silva-Lins-Rocha 19.77 0.04
Wu-Lu 19.70 0.06
DjVu 21.43 0.09
Other sample document from another database is
shown in Figure 5 (available at
www.site.uottawa.ca/~edubois/documents). This
Figure presents a zooming into one of these
documents and the binary versions generated by
Silva-Lins-Rocha, for example, and our new
method. Again, our method achieved higher values
of precision, recall, accuracy, specificity, PSNR and
lower value of MSE in comparison with other
VISAPP 2008 - International Conference on Computer Vision Theory and Applications
112

algorithms. This shows that, in general, our method
can be applied to other databases with similar
features.
Figure 5: (left) Zooming into another sample document
from a different database, (centre) the bi-level image
generated by Silva-Lins-Rocha algorithm and (right) the
one produced by our method.
5 CONCLUSIONS
It was presented in this paper a method for image
binarization of historical documents. The method
uses two Tsallis entropy-based binarization
algorithms presented herein. The first algorithm
finds an initial cut-off value and every time this
value is greater than the most frequent colour of the
image (which is assumed to be a colour that belongs
to the paper not to the ink) the second algorithm is
executed generating a new threshold value achieving
a better quality bi-level image
Our method was evaluated analyzing precision,
recall, accuracy, specificity, PSNR and MSE in
comparison with a gold standard image generated
manually and the results of several other entropy-
based binarization algorithms. It reached the best
results for every one of these measures. It was also
applied to images from different data bases
generating also high quality images.
ACKNOWLEDGMENTS
This research has been partially supported by CNPq,
University of Pernambuco, Universidad Rey Juan
Carlos and Agencia Española de Cooperación
Internacional (AECI) under contract no. A/2948/05.
REFERENCES
PROHIST: http://recpad.dsc.upe.br/prohist
Bottou, L. et al., 1998. High Quality Document Image
Compression with DjVu. Journal of Electronic
Imaging, 410–425, SPIE (also: http://www.djvu.org).
Kapur, J.N., 1994. Measures of Information and their
Applications, J.Wiley & Sons.
Kapur, J.N., et al, 1985. A New Method for Gray-Level
Picture Thresholding using the Entropy of the
Histogram, Comp Vision, Graphics and Image Proc.,
Vol 29, no 3.
Li, C.H. and Lee, C.K., 1993. Minimum Cross Entropy
Thresholding, Pattern Recognition, vol. 26, no 4.
McMillan, N.A. and Creelman, C.D., 2005. Detection
Theory. LEA Publishing.
Oliveira, A.L.I., et al, 2006. Optical Digit Recognition for
Images of Handwritten Historical Documents,
Brazilian Symposium of Neural Networks, p.29,
Brazil.
Mello, C.A.B. et al., 2006. Image Thresholding of
Historical Documents: Application to the Joaquim
Nabuco's File, Eva Vienna, p. 115-122, Austria.
Mello, C.A.B. and Lins, R.D., 2000. Image Segmentation
of Historical Documents, Visual 2000, Mexico.
Parker, J.R., 1997. Algorithms for Image Processing and
Computer Vision. John Wiley & Sons.
Pun, T., 1981. Entropic Thresholding, A New Approach,
Computer Graphics and Image Processing, vol. 16.
Sahoo, P. et al., 1997. Threshold Selection using Renyi’s
Entropy, Pattern Recognition, vol. 30, no 1.
Sezgin, M., Sankur,B., 2004. Survey over image
thresholding techniques and quantitative performance
evaluation, J. of Electronic Imaging, no.13, vol 1, pp.
146-165.
Shannon, C., 1948. A Mathematical Theory of
Communication, Bell System Technology Journal, vol.
27, pp. 370-423, 623-656.
Silva,J.M., et al., 2006. Binarizing and filtering historical
documents with back-to-front interference,
Proceedings of the ACM SAC, France.
Tsallis, C., 1988. Possible Generalization of Boltzmann-
Gibbs statistics, J. of Statistical Physics, vol. 52, nos.
1-2, pp. 479-487.
Wu, L. et al., 1998. An Effective Entropic thresholding for
Ultrasonic Images, International Conference on
Pattern Recognition, pp 1552-1554, Australia.
Yan, L. et al., 2006. An Application of Tsallis Entropy
Minimum Difference on Image Segmentation, World
Congress on Intelligent Control and Automation, pp.
9557-9561, China.
HISTORICAL DOCUMENT IMAGE BINARIZATION
113
