
UNVEILING INTRINSIC SIMILARITY
Application to Temporal Analysis of ECG
Andr´e Lourenc¸o
Instituto de Telecomunicacoes, Instituto Superior de Engenharia de Lisboa, Portugal
Ana Fred
Instituto de Telecomunicacoes, Instituto Superior Tecnico, Lisboa, Portugal
Keywords:
Visualization, Unsupervised Learning, Clustering, Evidence Accumulation Clustering, Co-association Matrix,
ECG Analysis, Behavior Identification.
Abstract:
The representation of data in some visual form is one of the first steps in a data-mining process in order to gain
some insight about its structure. We propose to explore well known visualization and unsupervised learning
techniques, namely clustering, to improve the understanding about the data and to enhance possible relations
or intrinsic similarity between patterns. Specifically, Clustering Ensemble Methods are exploited separately
and combined to provide a clearer visualization of data organization. The presented methodology is used to
improve the understanding of ECG signal acquired during Human Computer Interaction (HCI).
1 INTRODUCTION
Critical to the understanding of data is the ability to
provide its pictorial or visual representation. This pro-
cess is particularly relevant for analyzing large vol-
umes of complex data (e.g. multidimensional)that are
available from a variety of sources. The human visual
system has an enormous capacity for receiving and
interpreting data efficiently (Treinish and Goettsche,
1989).
There are many numerical and statistical tech-
niques that can be used to analyze structural infor-
mation from multidimensional data. Discovery and
understanding of the structure in the data has many
applications in science and business. Examples of
structure include clusters, regular patterns, outliers,
distance relations, proximity/similarity of data points,
etc... (Post et al., 2003).
The underlying tool for most of the pattern recog-
nition methods is a distance function, or more gener-
ally a similarity or dissimilarity measure. In the liter-
ature there are many proposed similarity/dissimilarity
measures (see (Fred, 2002) and the references
therein). Moreover each clustering algorithm induces
a similarity measure between data points, according
to the underlying clustering criteria (Fred and Jain,
2006). The representation of such similarities is the
focus of this paper.
Multidimensional scaling (MDS) techniques en-
able the representation of multidimensional data (em-
bedded in an n-dimensional space) in lower dimen-
sional spaces such that the structural properties of the
data are preserved. Given a dissimilarity (or simi-
larity) pairwise matrix (containing pairwise informa-
tion), MDS techniques represent the objects in a low-
dimensional space, preserving all pairwise, symmet-
ric dissimilarities between data objects (Pekalska and
Duin, 2003).
Data clustering and Unsupervised learning is used
in many disciplines and contexts, as an exploratory
data analysis (EDA) tool. Ensemble methods, namely
the evidence accumulation clustering (EAC) tech-
nique (Fred and Jain, 2005), represent state of the art
in data clustering methods, and a way of learning the
pairwise similarity between the data in order to proper
partitioning the data points (Fred and Jain, 2006).
In this paper we present a methodology based on
data Clustering techniques, aiming at improving the
understanding about the data, enhancing its intrinsic
structure. We apply this methodology to electrophys-
iological data, namely ECG, provided under the scope
of a HCI study.
The paper is organized as follows: in section 2
we briefly present the MDS techniques; in section 3
104
Lourenço A. and Fred A. (2008).
UNVEILING INTRINSIC SIMILARITY - Application to Temporal Analysis of ECG.
In Proceedings of the First International Conference on Bio-inspired Systems and Signal Processing, pages 104-109
DOI: 10.5220/0001070201040109
Copyright
c
SciTePress
we formalize the clustering problem and present sev-
eral methods to enhance the intrinsic data structure:
in subsection 3.1 using the dissimilarity matrix; and in
subsection 3.2 mapping the associations in a new sim-
ilarity measure using the evidence accumulation clus-
tering method. Finally, in section 4, this methodology
is presented in the analysis of ECG data. Throughout
the paper we present illustrative examples.
2 MULTIDIMENSIONAL
SCALING
Multidimensional scaling (MDS) in wide sense refers
to any technique that produces a geometric repre-
sentation of data, on a low dimensional space, usu-
ally Euclidean, where quantitative or qualitative re-
lationships in data are made to correspond with ge-
ometric relationships in the geometric representation
(Cox and Cox, 1994) (de Leeuw, 2000). Data objects
judged to be similar to one another result in points
being close to each other in this geometric represen-
tation (Pekalska and Duin, 2003). For more technical
details about MDS techniques consult Cox and Cox
(Cox and Cox, 1994) or Pekalska and Duin (Pekalska
and Duin, 2003).
As input for these techniques it is required a mea-
sure of similarity (or dissimilarity - inversely related
to similarity) between objects in the high-dimensional
space. Consider δ
ij
a measure of dissimilarity (usu-
ally called disparity) between the data objects i and
j, and d
ij
the estimated geometric distance in the low
dimensional space used to represent data objects i and
j. The raw stress, is the most elementary MDS loss
function, which quantitatively characterizes a given
geometric configuration for the data representation:
S
raw
(X) =
n−1
∑
i=1
n
∑
j=i+1
(δ
ij
− d
ij
)
2
(1)
An iterative optimization process can be used to
find a geometric configuration that minimizes the loss
function presented above (or other given in the litera-
ture).
Consider as an illustrative example of the MDS
technique a 2-dimensional representation of a set of 4-
dimensional gaussian data (R
4
), with identical covari-
ance matrices (Σ = 0.5I
4
), and centered, respectively
in µ
1
= [3, 0, 0, 0], µ
2
= [0, 3, 0, 0], µ
3
= [0, 0, 3, 0] and
µ
4
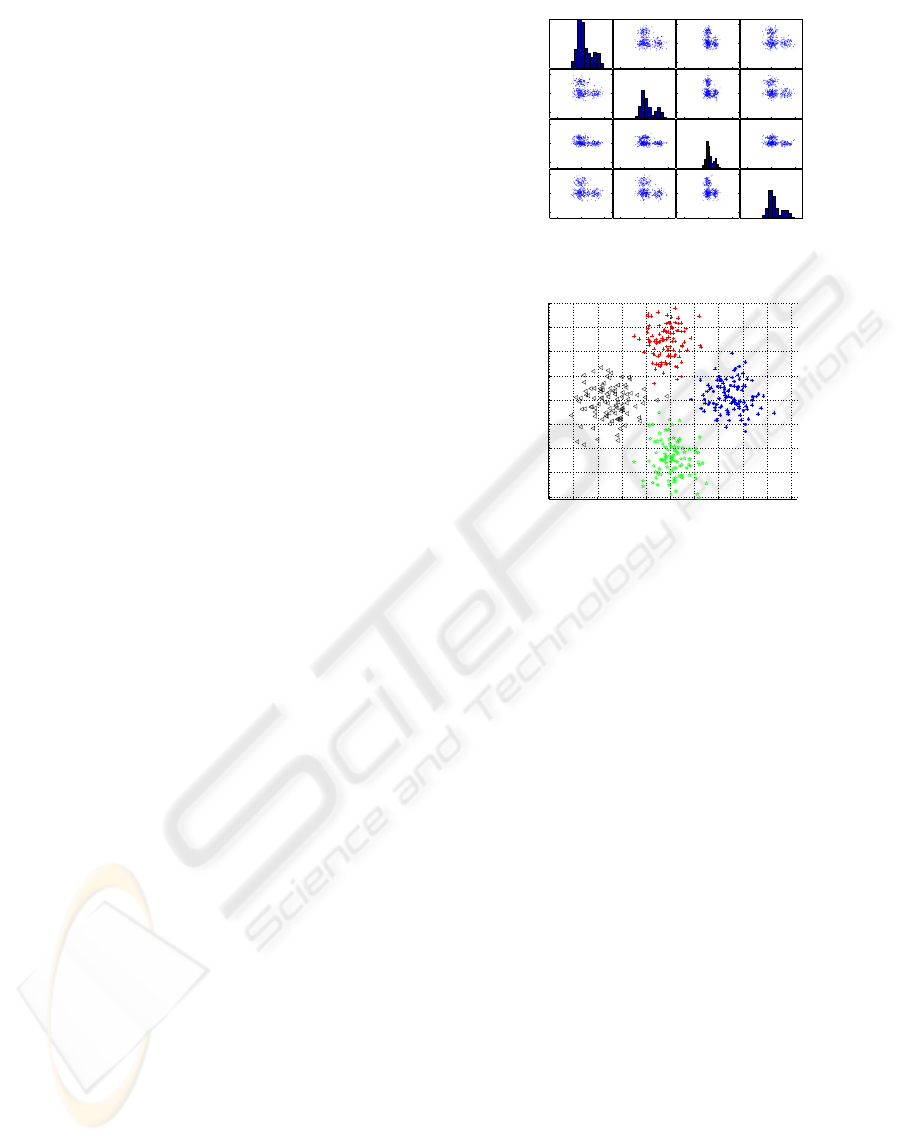
= [0, 0, 0, 3]. Figure 1(a) represents the matrix plot
of the multidimensional data (that is: the i-th row and
j-th column of this matrix is a plot of X
i
variable ver-
sus X
j
variable; the main diagonal represents the his-
tograms of each variable). Figure 1(b) presents the
−5 0 5−10 0 10−5 0 5−5 0 5
−5
0
5
−10
0
10
−5
0
5
−5
0
5
(a) Matrix Plot
−5 −4 −3 −2 −1 0 1 2 3 4 5
−4
−3
−2
−1
0
1
2
3
4
(b) MDS
Figure 1: Multidimensional data representation. Projec-
tions in 2-D dimensional spaces. MDS configuration.
obtained configuration in the 2-D euclidean space, us-
ing as optimization criteria the Kruskal’s normalized
stress1 criterion (equation above). For better under-
standing of the obtained representation, different col-
ors and shapes where used to represent each of the
different gaussians. In the next section we will briefly
review the methods that unsupervisely group data ob-
jects.
3 CLUSTERING
The goal of clustering is to enhance the interpretabil-
ity of the data by organizing data in meaningful
groups (or clusters) such that the patterns in a clus-
ter are more similar to each other than patterns in
different clusters (Jain and Dubes, 1988), (Pekalska
and Duin, 2003). Each clustering algorithm visual-
izes data in a different way, inducing different simi-
larity measures between data points according to the
underlying clustering criteria (Fred and Jain, 2006).
There are a number of problems with clustering
methods. The most important one is that there are
Clustering is a difficult problem, hundreds differ-
ent techniques have been proposed in the literature,
yet no single algorithm is able to identify all sorts of
UNVEILING INTRINSIC SIMILARITY - Application to Temporal Analysis of ECG
105
cluster shapes and structures that are encountered in
practice.
A recent trend in clustering, that constitutes the
state-of-the art in the area, are the clustering com-
bination techniques (also called ensemble methods).
They attempt to find a robust data partitioning by
combining different partitions produced by a single
or multiple clustering algorithms. Several combina-
tion methods have been proposed (Fred, 2001; Strehl
and Ghosh, 2002; Fred and Jain, 2002; Topchy et al.,
2004) to obtain the combined solution.
3.1 Dissimilarity Matrix
There is some work in visual approaches for assess-
ing cluster tendency (Bezdek and Hathaway, 2002)
based directly on visualizing the dissimilarity matrix
obtained from the data. In (Bezdek and Hathaway,
2002) Bezdek and al. presented an algorithm - the
visual assessment of cluster tendency (VAT) - which
reorders the dissimilarity data so that possible clusters
can be enhanced.
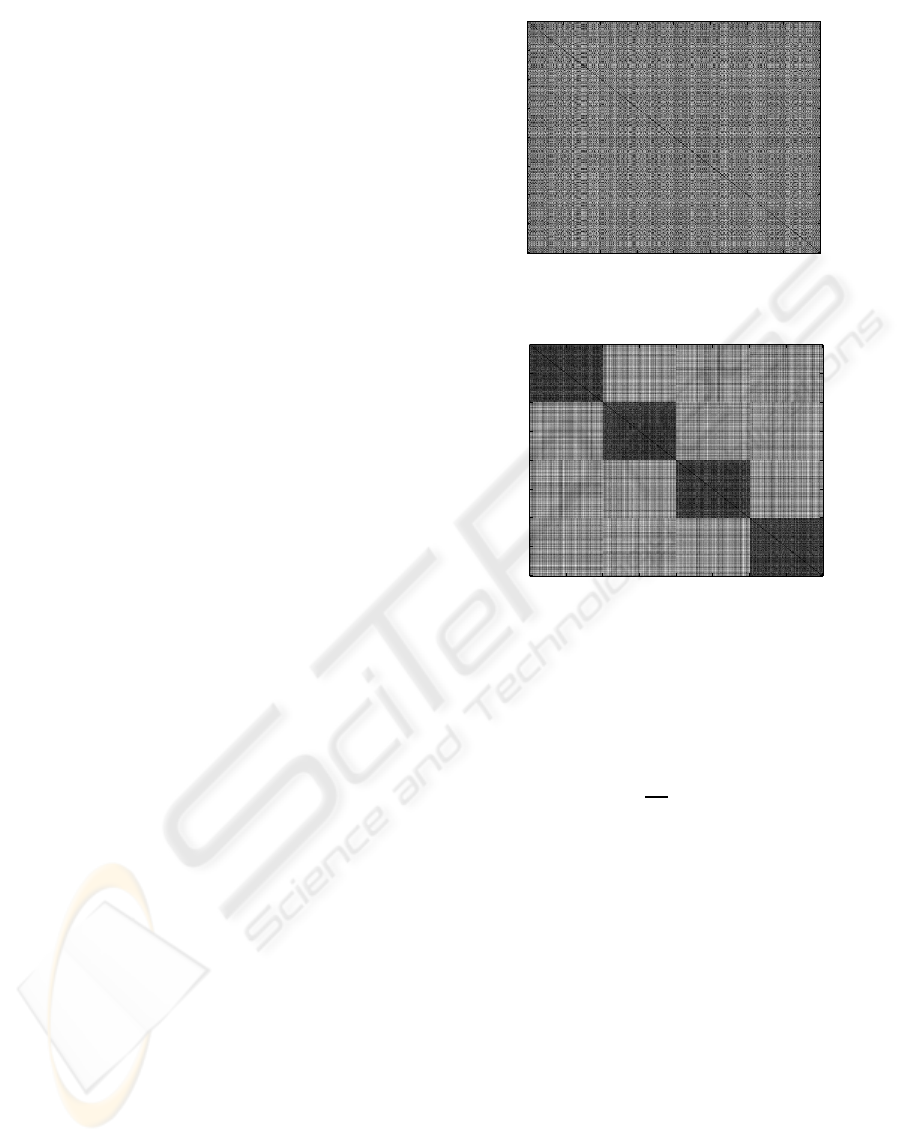
The images in Figure 2 are intensity image, where
the intensity or gray level of the pixel (i,j) depend
on the value of δ
ij
, the dissimilarity between sam-
ple i and j. The value 0 corresponds to pure black;
and the pure white represent the maximum dissimi-
larity. They were obtained with Euclidean distance
for the gaussian data set presented previously. The
figure 2(a) represents the obtained dissimilarity im-
ages when the samples are randomly positioned, and
the figure 2(b) when the samples are re-organized so
that the samples that are close together are as near
as possible (as described in VAT (Bezdek and Hath-
away, 2002)). By analyzing this dissimilarity image
we identify dark rectangular areas, characteristic of
items that are close together and that could constitute
a cluster.
3.2 Evidence Accumulation Clustering
The Evidence Accumulation Clustering (EAC), pro-
posed by Fred and Jain in (Fred, 2001) (Fred and Jain,
2005), is one of the clustering combinations tech-
niques proposed in the literature. This method com-
bines different visions over the data set, obtained by
different algorithms or a single algorithm with differ-
ent initializations, aiming to find the intrinsic simi-
larity of the data. The different partitions obtained by
the clustering algorithms, are called the clustering en-
semble.
The EAC is based on the mapping of the rela-
tionships between pairs of patterns into a n × n co-
association matrix, C . This matrix accumulates the
50 100 150 200 250 300 350 400
50
100
150
200
250
300
350
400
(a) Dissimilarity Matrix
50 100 150 200 250 300 350 400
50
100
150
200
250
300
350
400
(b) VAT
Figure 2: Dissimilarity Images.
co-occurrence of pairs of samples in the same cluster
over the N clusterings of the clustering ensemble P
according to the equation:
C (i, j) =
n
ij
N
, i, j ∈ 1, .., N (2)
where n
ij
represents the numberof times a givensam-
ple pair (i, j) has co-occurred in a cluster over the N
clusterings. Assuming that patterns belonging to a
”natural” cluster are very likely to be co-located in the
same cluster in different clusters of the partitions of
the clustering ensemble, the co-occurrences of pairs
of patterns summarizes the inter-pattern structure per-
ceived from these clusterings. Each co-occurrence of
a pair of samples in the same cluster are taken as a
vote for the association of those samples. For that
reason this method is also known as majority voting
combination scheme. In order to recover the natural
clusters, and to emphasize the neighborhood relation-
ships, in (Fred, 2001), the Single-link hierarchical al-
gorithm (Jain and Dubes, 1988) is applied on the new
feature space represented by the co-association ma-
trix, yielding the combined data partition P
∗
. Other
algorithms may be applied in this final step (Fred and
Jain, 2005).
BIOSIGNALS 2008 - International Conference on Bio-inspired Systems and Signal Processing
106
50 100 150 200 250
50
100
150
200
250
(a) Dissimilarity Matrix.
50 100 150 200 250
50
100
150
200
250
0
0.1
0.2
0.3
0.4
0.5
0.6
0.7
0.8
0.9
1
(b) Co-association matrix based on the ensem-
ble.
0 1 2
−4
−3
−2
−1
0
1
2
3
(c) One of
the parti-
tions of the
ensemble,
k=14
0 1 2
−4
−3
−2
−1
0
1
2
3
(d) One of
the parti-
tions of the
ensemble,
k=28
0 1 2
−4
−3
−2
−1
0
1
2
3
(e) EAC
combined
partition.
Figure 3: Individual clusterings and combination results on
the cigar data-set using a k-means ensemble.
Figure 3 presents a typical application of the EAC
method on an artificial data set (cigar data-set). An
ensemble of 25 partitions was produced using the k-
means algorithm with random initialization and with
k randomly chosen in the interval [10,30]. Examples
of obtained partitions are illustrated in (c) and (d).
The combination result is presented in (e). The co-
association matrix (illustrated in (b)), corresponds to
a new similarity between samples based on the infor-
mation accumulated from the partitions in the cluster-
ing ensemble. In figure the axis represent the samples
of the data set, organized such that samples belonging
to the same cluster are displayed contiguous (as de-
scribed in section 3.1). The color scheme in the figure
ranges from red to blue, correspondingto a gradient in
similarity. Pure Red corresponds to the highest sim-
ilarity. It can be seen that, although individual data
partitions are quite different, neighboring patterns oc-
cur in the same cluster in most of the partitions. As a
result, the true structure of the clusters becomes more
evident in the co-association matrix: notice the more
clear separation between clusters (large blue zones)
and more evident block diagonal structure in figure
3(b) as compared to the original dissimilarity matrix
in figure 3(a).
In the described method each partition is given an
equal weight in the combination process and all clus-
ters in each partition contribute to the combined so-
lution. Other approaches were taken, for example,
weighting/selecting the partitions based on the qual-
ity of the overall partitions. More recently, instead of
evaluating the overall performance of a clustering al-
gorithm based on the final partition produced by it,
in (Fred and Jain, 2006) it is assumed that each al-
gorithm can have different levels of performance in
different regions of the multidimensional space. It is
proposed to learn pairwise similarity based on mean-
ingful clusters, which can be identified based on clus-
ter stability criteria. Thus only those clusters passing
the stability test will contribute to the co-association
matrix an to the learned similarity matrix yielding a
more robust solution. Figure 4 presents this matrix
for the same data set as above. We observe that the
rectangular areas are perfectly defined clearly distin-
guishing the underlying clustering structure. When
represented via MDS this matrix yields 4 separate
points in the 2-dimensional space.
50 100 150 200 250
50
100
150
200
250
0.1
0.2
0.3
0.4
0.5
0.6
0.7
0.8
0.9
Figure 4: Learned co-association matrix.
UNVEILING INTRINSIC SIMILARITY - Application to Temporal Analysis of ECG
107
4 ECG ANALYSIS
We applied the previous methodology to the analysis
of ECG recordings, performed during the execution
of a cognitive task using the computer, based on the
work on (Silva et al., 2007). The ECG acquisition
was part of a wider multi-modal physiological signal
acquisition experimentaiming personalidentification.
The task consisted on a concentration task where two
grids with 800 digits were presented, with the goal
of identifying every pair of digits that added 10 and
was designed for an average completion time of 10
minutes. A collection of 53 features were extracted
from mean ECG waves for groups of 10 heart-beat
waveforms (without overlapping): 45 amplitude val-
ues measured at sub-sampled points and 8 latency and
amplitude features were also extracted (for more de-
tails see (Silva et al., 2007)).
Instead of using the ECG features for personal
identification, herein we study the data in a data-
exploratory perspective, trying to find its underlying
time evolution. The task was designed to induce stress
in the subject (for more details see (Silva et al., 2007))
thus the ECG characteristics should vary over time.
The aim of this preliminary analysis is access typical
patterns of temporal evolution over the subjects based
on the ECG extracted features.
For each subject, the temporal evolution of the
ECG characteristics was performed as follows: each
time window, represented by the 53 features, con-
stitutes a sample; the application of clustering over
these samples reveals groups of samples represent-
ing ’stable’ phases of temporal behavior over the
ECG. According to the previous ensemble methodol-
ogy, we constructed a clustering ensembles of N = 75
K-means partitions with varying number of clusters,
k ∈ [2, 30], applying the EAC approach and analyzed
the induced similarity matrix.
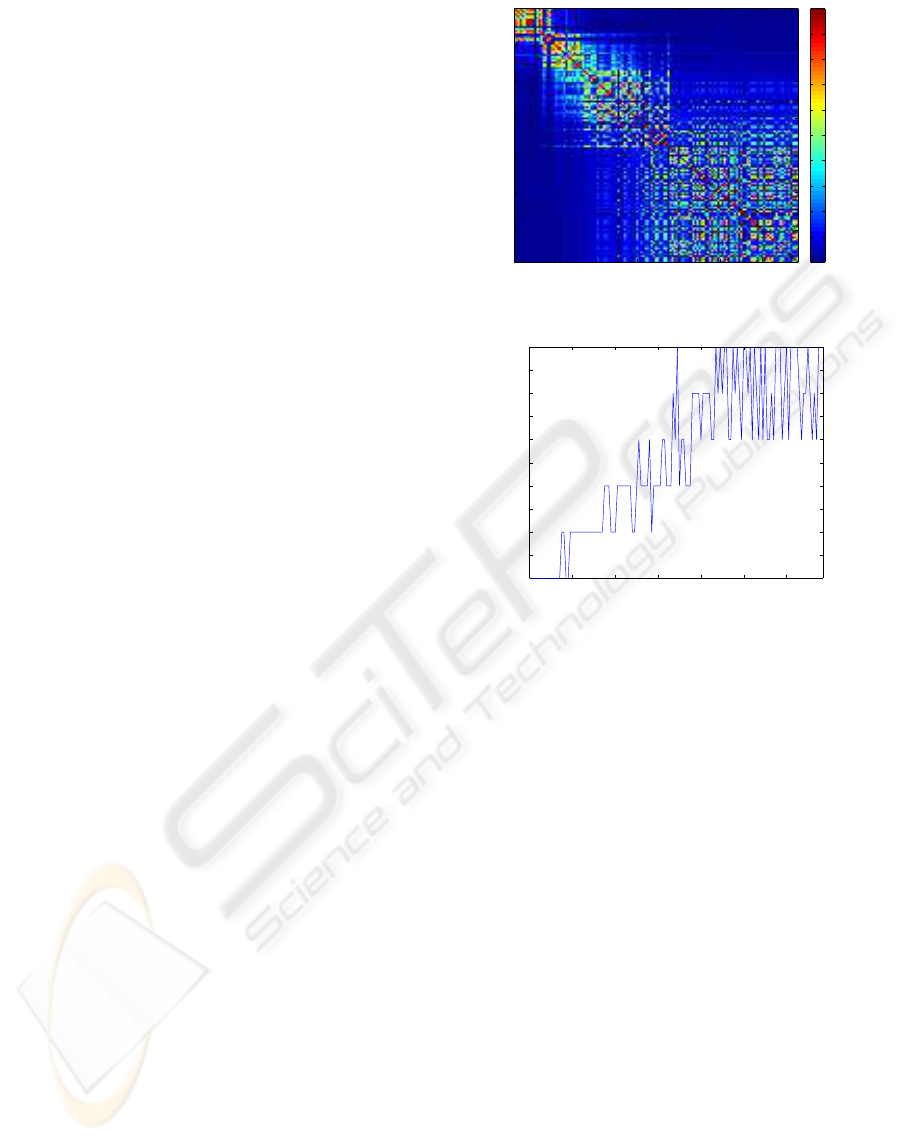
We applied this technique over the 26 subjects that
performed the task. Figure 5 presents one example of
the typical structures obtained in the analysis. Figure
5(a) represents the obtained co-association matrix. In
this co-association matrix adjacent patterns (in rows
and columns) represent time aligned samples (0 repre-
sents the beginning of the test) of the ECG recording.
It is interesting to note its block diagonal structure re-
vealing time relationships between the patterns. This
structure is not so evident as in the previous toy ex-
ample, but a similar diagonal pattern can be inferred.
Using the Ward’s link and the life time criteria for
choosing the number of clusters, 6 clusters are ob-
tained. In figure 5(b) we present the temporal evo-
lution of such clusters: x-axis correspond to the sam-
ples order by time; and the y-axis the discovered clus-
20 40 60 80 100 120
20
40
60
80
100
120
0
0.1
0.2
0.3
0.4
0.5
0.6
0.7
0.8
0.9
1
(a) Co-association Matrix based on the ensem-
ble.
0 20 40 60 80 100 120
1
1.5
2
2.5
3
3.5
4
4.5
5
5.5
6
(b) Cluster Temporal-Evolution.
Figure 5: ECG Analysis based on induced similarity using
the EACalgorithm over an ensemble of 75 k-means partions
(with varying number of clusters).
ters {1, 2, . . . , 6}. Analyzing this figure, we can per-
ceive that over the time the changes in cluster are only
between adjacent clusters: cluster 1 evolutes only to
cluster 2; cluster 2, evolutes only between clusters 1
or 3, ..., cluster i evolutes only between i−1 and i+ 1.
Note that this adjacent clusters are more similar that
not adjacent ones. If we consider that each cluster
represent a temporal behavior, this reveals a contin-
ual evolution of these behaviors, not observing drastic
changes over time. These changes in the temporal be-
havior of the features could have been caused by the
increasing stress levels induced by the test that was
being resolved by the subjects.
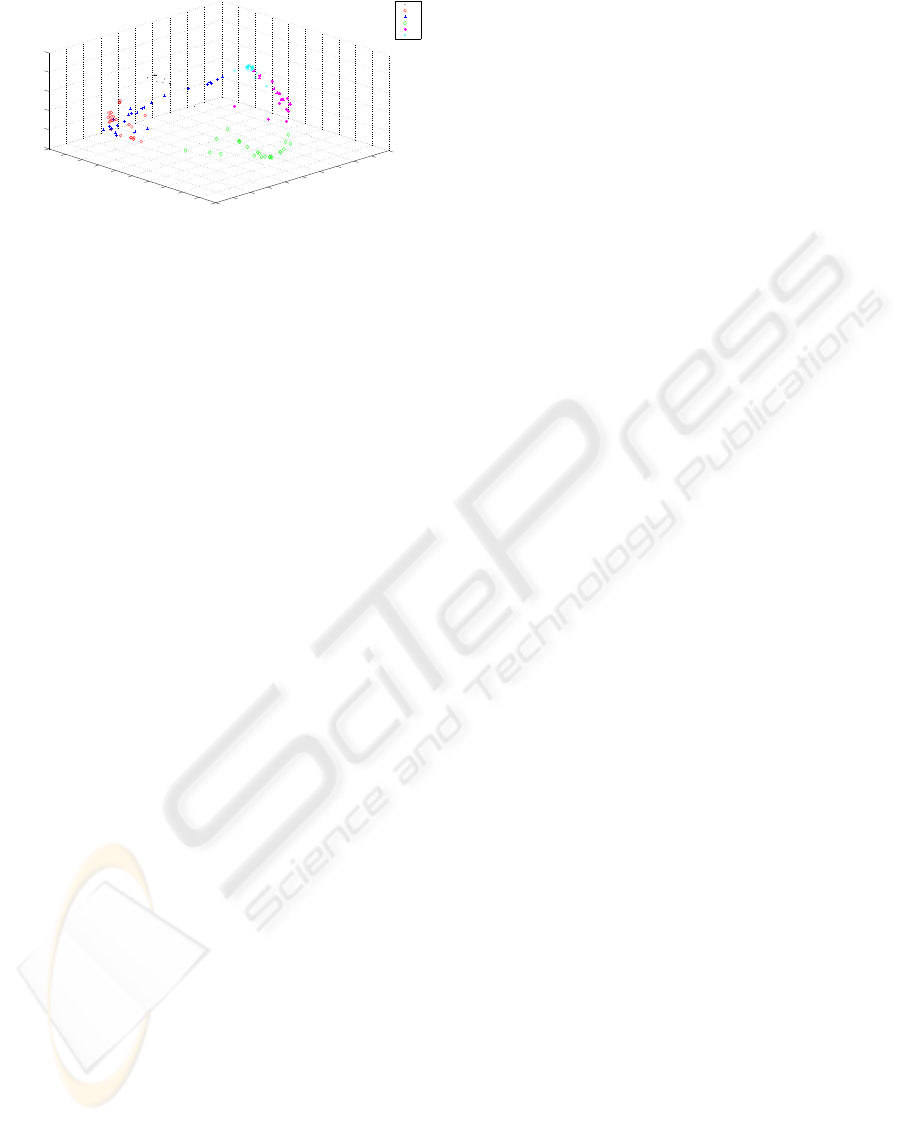
Figure 6 presents the MDS representation of the
data, based on the EAC induced similarity. The repre-
sented clusters (in different colors and shapes) are the
same presented in figure 5(b). It is possible to note
that samples of adjacent clusters are represented adja-
cently as previously discussed in the temporal evolu-
tion of clusters.
BIOSIGNALS 2008 - International Conference on Bio-inspired Systems and Signal Processing
108
−0.5
−0.4
−0.3
−0.2
−0.1
0
0.1
0.2
0.3
0.4
0.5
−0.6
−0.5
−0.4
−0.3
−0.2
−0.1
0
0.1
0.2
0.3
0.4
−0.4
−0.2
0
0.2
0.4
0.6
c1
c2
c3
c4
c5
c6
Figure 6: MDS representation of the data based on the EAC
induced similarity. The clusters were obtained using the
Ward’s link and the life time criteria for choosing the num-
ber of clusters.
5 CONCLUSIONS
We presented a short overview of state of the art
in data visualization and unsupervised learning tech-
niques, to improve the understanding about the data.
Examples shown that the visualization either by
dissimilarity matrix observation (using VAT), or co-
association observation (obtained via EAC) or using
Multidimensional Scalling (MDS), provide pictorial
or alternative visual representations of multidimen-
sional data important to gain insight about the data.
The preliminary analysis of the ECG signal
demonstrates the potential of these visualization tech-
niques in biosignal analysis. The results have shown
typical patterns of time evolution of clusters which
can be related with increasing stress levels.
REFERENCES
Bezdek, J. and Hathaway, R. (2002). Vat: A tool for visual
assessment of (cluster) tendency. In Press, I., editor,
IJCNN 2002, pages 2225–2230.
Cox, T. F. and Cox, M. A. A. (1994). Multidimensional
Scaling. Chapman and Hall.
de Leeuw, J. (2000). Multidimensional scaling. Dep. of
Statistics, UCLA. Paper 2000010108.
Fred, A. (2001). Finding consistent clusters in data parti-
tions. In Kittler, J. and Roli, F., editors, Multiple Clas-
sifier Systems, volume 2096, pages 309–318. Springer.
Fred, A. (2002). Pattern Recognition and String Matching,
chapter Similarity measures and clustering of string
patterns. Kluwer Academic.
Fred, A. and Jain, A. (2002). Data clustering using evidence
accumulation. In Proc. of the 16th Int’l Conference on
Pattern Recognition, pages 276–280.
Fred, A. and Jain, A. (2005). Combining multiple cluster-
ing using evidence accumulation. IEEE Trans Pattern
Analysis and Machine Intelligence, 27(6):835–850.
Fred, A. and Jain, A. (2006). Learning pairwise similarity
for data clustering. In Proc. of the 18th Int’l Confer-
ence on Pattern Recognition (ICPR), volume 1, pages
925–928, Hong Kong.
Jain, A. and Dubes, R. (1988). Algorithms for Clustering
Data. Prentice Hall.
Pekalska, E. and Duin, R. P. W. (2003). The Dissimilarity
Representation for Pattern Recognition: Foundations
And Applications. World Sci. Pub. Company.
Post, F. H., Nielson, G. M., and Bonneau, G.-P., editors
(2003). Data Visualization: The State of the Art.
Kluwer.
Silva, H., Gamboa, H., and Fred, A. L. N. (2007). One lead
ecg based human identification with feature subspace
ensembles. In Proc Machine Learning and Data Min-
ing in Pattern Recognition, pages 770 – 783, Leipzig,
Germany.
Strehl, A. and Ghosh, J. (2002). Cluster ensembles - a
knowledge reuse framework for combining multiple
partitions. J. of Machine Learning Research 3.
Topchy, A., Jain, A., and Punch, W. (2004). A mixture
model of clustering ensembles. In Proceedings SIAM
Conf. on Data Mining.
Treinish, L. A. and Goettsche, C. (1989). Correlative
visualization techniques for multidimensional data.
Technical report, National Space Science Data Center
NSSDC-NASA.
UNVEILING INTRINSIC SIMILARITY - Application to Temporal Analysis of ECG
109
