
CARDIAC BEAT DETECTOR
A Novel Analogue Circuitry for the First Heart Sound Discrimination
Shinichi Sato
Department of Physiology, Akita University School of Medicine, 1-1-1 Hondo, Akita, Japan
Keywords: Non-invasive, piezoelectric transducer (PZT), analogue circuit, heart rate, respiration sounds, mice.
Abstract: Cardiac beat detector, which is an analogue circuitry installed in a novel non-invasive system for measuring
heart rate in mice by using a piezoelectric transducer (PZT) sensor, performs an critical role in detecting the
first heart sound (S1) in heart sounds. The PZT sensor detects heartbeat vibration and converts it to an
electrical signal, namely the heart sounds. The measurement in intervals of S1s in the heart sounds is
required to calculate heart rate, however, it is not simple because a S1 is a vibrating signal and has multiple
peaks, which fluctuate in interval and in magnitude. In addition, respiration sound noise, which has
frequency components similar with that of S1, makes S1 detection difficult and complex. The cardiac beat
detector made it possible to overcome these problems by transforming multi-peaked S1 signal into a quasi-
digital pulse. This technique is also available for the use in humans. Thus, the cardiac beat detector would
contribute to the progress in the non-invasive heart rate measurement when it is installed in various, novel
phonocardiogram-based equipments for the use in the fields of clinical and basic science in medicine.
1 INTRODUCTION
In experiments using small animals such as mice, a
clip ECG electrode is often used for ECG recording
(Yamada et al., 2001). However, investigators often
encounter the problem with ECG signal
deterioration or instability during long recording due
to the hairy limbs and drying up of electrolytic paste
between the limbs and the clip electrodes
particularly in small animals. Moreover, there is an
undeniable possibility that the pain induced by the
electrode attachment might activate the sensory
neurons and influence on the physiological state
even in an anesthetized animal (Sato, 2007).
To overcome these problems, we recently
developed a non-invasive cardiorespiratory monitor
system for small animals using a piezoelectric
transducer (PZT) sensor, which converts cardiac
beats into an electrical signal when a small animal
was simply placed on it (Sato et al., 2006; US patent
7174854). The PZT cardiorespiratory monitor
enables stable and long measurement of heart rate of
sleeping or anesthetized animals. Only placing an
animal on the PZT sensor is required to monitor
heart rate, and therefore, it gives no pain to animals.
To calculate the heart rate, it is required to detect the
first heart sound (S1) in a heartbeat signal detected
by the PZT sensor. However, it is not simple to
detect S1 constantly by distinguishing from noises of
a frequency range similar to that of S1 because a S1
is composed of multi-peaked vibrating signal
(Rangayyan and Lehner, 1988) and its magnitude
decreases in anesthetized animals and humans
(Manecke et al., 1999). A cardiac beat detector,
which is made of a custom-designed analogue
circuitry for S1 detection, was strikingly effective
for detecting S1 and the second heart sound (S2) and
for computing heart rate with a simple
microprocessor algorithm.
2 METHOD
2.1 PZT Cardiorespiratory Monitor
The PZT cardiorespiratory monitor system consists
of a PZT sensor device and a main unit, which
contains two band-pass filters, a cardiac beat
detector, a breathing movement detector,
microprocessors and a temperature controller for the
PZT sensor device. The sensor device consists of a
disk-shaped thin PZT placed in a hole cut in a
copper plate and covered by 0.5 mm-thick insulating
sheets, which all were mounted on an electronic
controlled heater (Sato et al., 2006) (Fig. 1).
136
Sato S. (2008).
CARDIAC BEAT DETECTOR - A Novel Analogue Circuitry for the First Heart Sound Discrimination.
In Proceedings of the First International Conference on Bio-inspired Systems and Signal Processing, pages 136-140
DOI: 10.5220/0001069501360140
Copyright
c
SciTePress
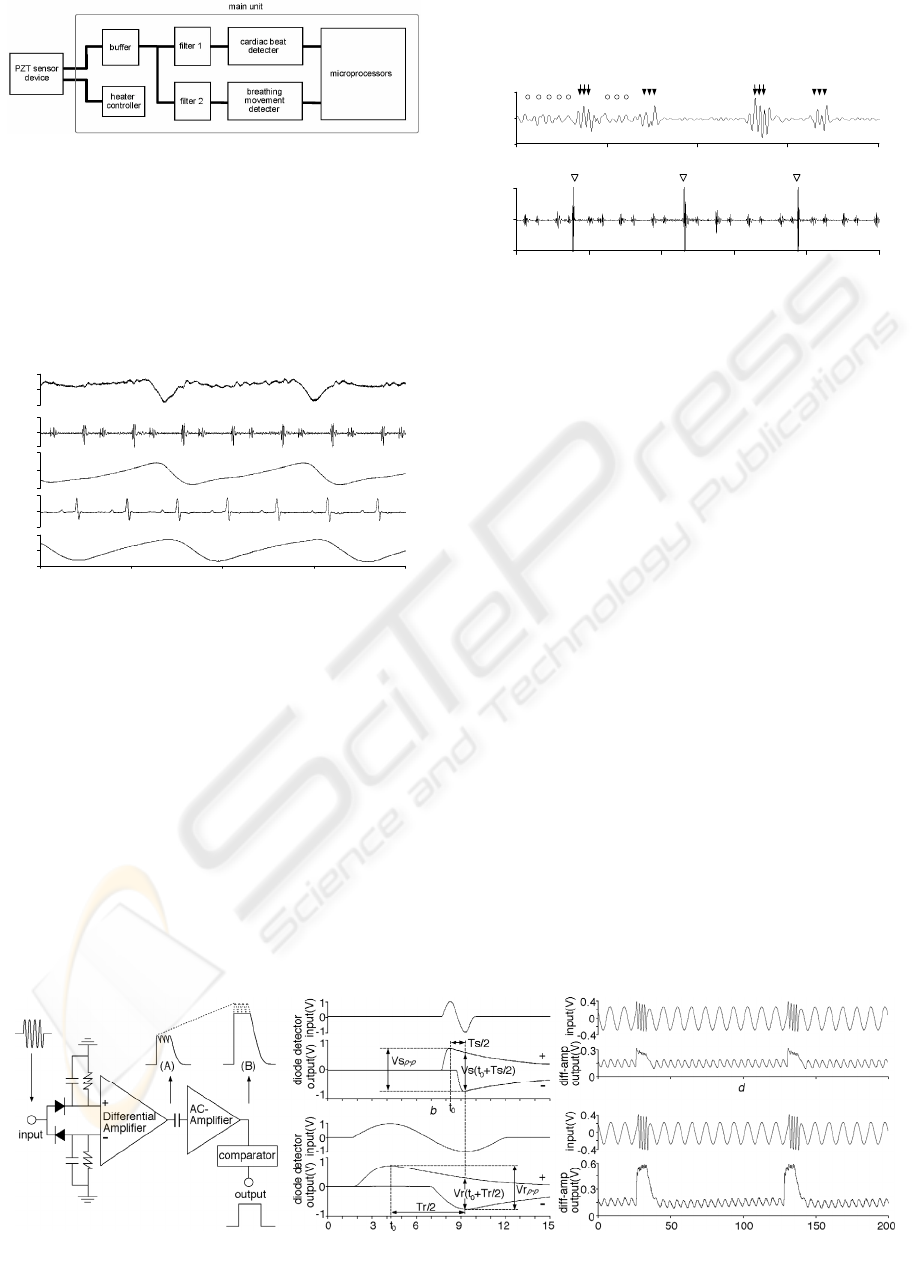
Figure 1: Block diagram of PZT cardiorespiratory monitor.
2.2 Signal Separation by Filters
Heart sound and breathing movement signals were
separated from the PZT output signal by filters with
pass band of 280-1000 Hz and 0.4-2.6 Hz for heart
sounds and breathing movements, respectively, as
shown in Fig. 2.
time (s)
0
0.1
0.04
0.1
0.5
-0.1
-0.04
-0.1
-0.5
0.1
-0.1
0
0
0
0
PZT
signal(V)
filter 1
output(V)
filter 2
output(V)
ECG(V)
Thermistor
output(V)
0 0.2 0.4 0.6
0.8
Figure 2: PZT output signal, Heart sounds, breathing
movement signal, ECG and thermistor airflow sensor.
However, it was found that the presence of
respiration sound noise, which was produced by
airflow in airway, disturbs the detection of S1 (S2)
when the magnitude of S1 (S2) declined in
anesthetized mice (Fig. 3; upper trace). In addition,
airway secretion produced marked, large-amplitude
respiratory noise (Fig. 3; lower trace). These
respiration-related noises were hardly possible to be
removed by a filter because the frequency
component of them were similar to that of S1; the
period of vibrating signal of S1 (Ts) and respiration
sound noise (Tr) was ranged between 1.4 and 4.0 ms
(average = 2.4 ms, n = 50) and between 3.5 and 7.7
ms (average = 5.4 ms, n = 50), respectively. The
frequency components of both S1 and respiration
sound noise fluctuated, and therefore, they ranged
widely and overlapped each other.
0
time (ms)
filter 1
output(mV)
0
200
100
50
150
50
-50
0.2
0
-0.2
0
0.2 0.4 0.6 0.8
time (s)
1
filter 1
output(V)
Figure 3: Representative traces of respiration sound noise
(open circles; upper trace) and large-amplitude respiratory
noise (open triangles; lower trace). Arrows and
arrowheads indicate S1 and S2, respectively.
2.3 Cardiac Beat Detector
Since it was difficult to accomplish effective
removal of the respiration sound noise from heart
sounds by a filter because they have similar
frequency components and fluctuate, we have
developed a novel cardiac beat detector circuit,
which consists of two diode detectors connected to a
differential amplifier, an AC amplifier, and a
hysteresis comparator (Fig. 4a). This circuit has
three functions; (1) S1 emphasizing, (2)
transforming S1 into a quasi-digital pulse and (3)
automatic threshold controlling (Sato et al., 2006).
2.3.1 S1 Emphasizing Function
As described above, frequency components of S1
are at slightly higher range than those of respiration
sound noise, although the both components
fluctuate and overlap in part. To overcome the
fluctuation, the cardiac beat detector was designed
to emphasize always a higher frequency sounds
over relatively lower frequency sounds. The S1
emphasizing function is produced by the
combination of two diode detectors, which work as
envelop detectors, and a differential amplifier (Fig.
Figure 4: Function of the cardiac beat detector.
CARDIAC BEAT DETECTOR - A Novel Analogue Circuitry for the First Heart Sound Discrimination
137
4a).
The two-diode detectors produce positive and
negative envelopes with ripples when a sine wave is
input. The voltage of the positive envelope during
the declining phase (V(t)) is determined by a time
constant RC as
V(t) = V
p e
−t/RC
(1)
where R and C are the resistance and the capacitance
of the diode detectors and t is the time after a time of
positive peak in the input and V
p is the voltage of the
peak.
Output voltage difference between the two diode
detectors at t = T/2 (V(T/2)) is calculated as
V(T/2) = V
p (1 + e
−T/2RC
) (2)
where T is the period of the input signal. Therefore,
the higher input signal frequency, the larger voltage
difference the diode detectors output. In fact, output
voltage difference for an input sine wave of higher
frequency (Vs(t
0
+Ts/2); Fig. 4b) is larger than that
of lower frequency (Vr(t
0
+Tr/2); Fig. 4c).
This voltage difference appears equally in the
differential amplifier output. Responses of the diode
detectors to an input of a synthesized waveform,
which consisted of alternating 4 cycles of a 500Hz
sine wave (artificial S1) and 10 cycles of a 100Hz
sine wave (artificial respiration sound), are shown in
Fig. 4d and e. The artificial S1 is enhanced as
compared to the artificial respiration sound when
amplitudes of both inputs are almost the same (Fig.
4d), while the artificial S1 is largely enhanced when
it is slightly larger than the artificial respiration
sound in input signal (Fig. 4e). Fig. 4d demonstrates
that the diode detectors have the S1 emphasizing
function, while Fig. 4e shows an additional
contribution of a rectifying property of diode, which
abruptly reduces its resistance to the signal that
exceeds about 0.3V, to the S1 emphasizing function.
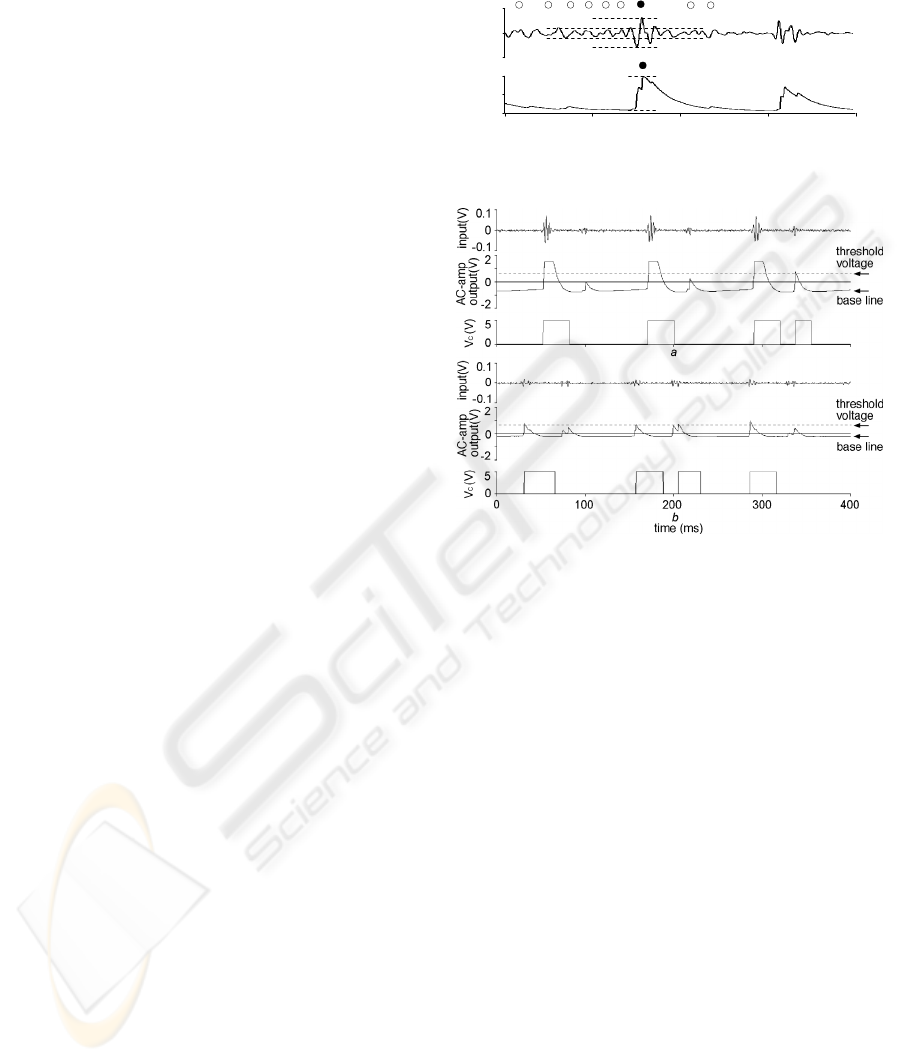
Fig. 5 shows an example of quasi-digital pulses
output from the differential amplifier when a real
filtered heart sound signal was input ((A); Fig. 4a).
The amplitude ratio of the S1 signal (filled circle) to
the respiration sound noise (open circles) was
enhanced from 3-fold in the input (broken lines;
upper trace) to 10-fold in the output (lower trace)
(Fig. 5). In addition, the cardiac beat detector
combines the multi peaks of S1 into a quasi-digital
pulse, which is helpful for the comparator to detect
S1 easily. The unique combination of these effects
enabled the emphasizing of S1 of higher frequency
over the respiration sound noise of lower frequency,
thus enabling a great improvement in the S/N ratio
of the quasi-digital pulse.
0
-2
diff-amp
output(V)
filter 1
output(V)
100500
time (ms)
2
Figure 5: S1 emphasizing function of cardiac beat detector.
Figure 6: Automatic threshold adjustment controlled by
the cardiac beat detector.
2.3.2 Automatic Threshold Controlling
Function
The quasi-digital pulse (Fig. 5; lower trace) output
from the differential amplifier was fed into the AC
amplifier. The AC amplifier lowers the baseline of
the differential amplifier output (quasi-digital pulse)
to the negative direction when the magnitude of the
quasi-digital pulse becomes larger (Fig. 6a), while
the baseline approaches 0V when the pulse height
declines (Fig. 6b). These responses of the AC
amplifier to the change in magnitude of the quasi-
digital pulse act as an automatic threshold control,
which help comparator to detect the S1 signal with a
higher sensitivity (Fig. 6).
2.4 Heart Rate Calculation by
Microprocessor Program
The cardiac beat detector improved the incidence of
S1 detection by removing the influence of
respiration sound noises, however, large-amplitude
respiratory noises, which were elicited by an airflow
BIOSIGNALS 2008 - International Conference on Bio-inspired Systems and Signal Processing
138
in airway with airway secretion, still remained and
induced errors in S1-S1 interval detection for heart
rate calculation. Discrimination between S1 and S2
is also required for the heart rate calculation. I made
a microprocessor program to overcome these
problems. The major algorithms adopted in the
program are; (1) to calculate the correct HR by
selecting four S1-S1 intervals of less error from
eight consecutive intervals and (2) to set a non-
detection period of 75 ms after a S1 (or S2) for the
discrimination of S1 from S2 (Sato et al., 2006).
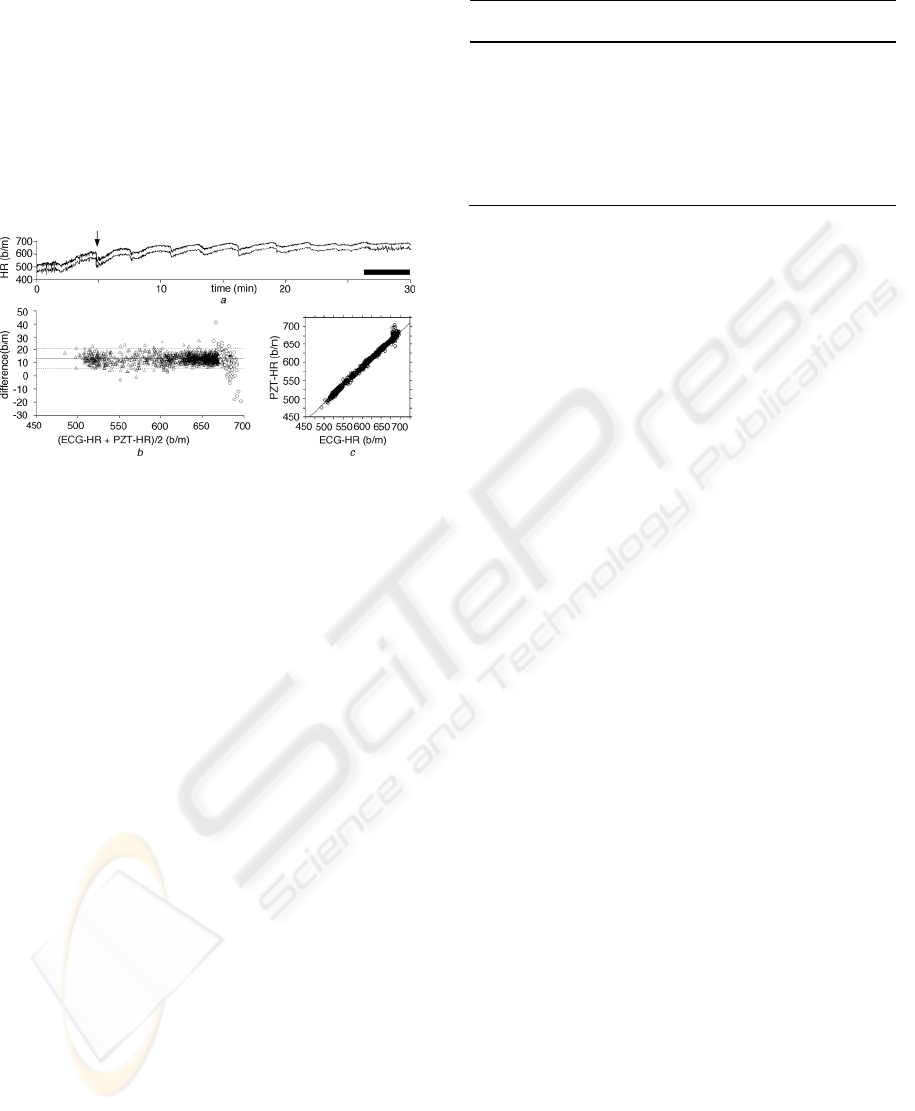
Figure 7: Comparison between the heart rate calculated by
the PZT system and ECG for 30 min. Output of the PZT
system (lower trace) and the heart rate calculated from the
R-R intervals in ECG (upper trace) (a), their difference
plot (b) and cross-correlogram (c). Black bar in (a)
indicates the duration where large-amplitude respiratory
noise appeared. Lower trace in (a) is lowered to show
almost complete agreement between the two traces.
3 RESULT
Heart rate output from D/A converter in the PZT
system (PZT-HR) and that calculated from ECG
reading (ECG-HR) averaged over every 1 s were
compared using 6 anesthetized adult C57BL/6 mice.
The PZT-HR and the ECG-HR were highly
correlated (Fig. 7a). Difference plot between them
also showed good correlation (Fig. 7b) even during
the period when large-amplitude respiratory noise
appeared (open circles; Fig. 7b). The difference plot
demonstrated the highly reliable detection of HR by
the PZT system; 96.2% (1,729/1,798) of total points
fell within ±2 SD of the mean value. The PZT-HR
also closely followed a rapid decrease in HR at a
rate of 33 b/m/s (arrow in Fig. 7a). Cross-correlation
coefficient between PZT-HR and ECG-HR was
0.995±0.003 (mean±SD, n = 6; Table 1, Fig. 7c).
Table 1: Correlation between PZT-HR and ECG-HR.
mouse r difference (%)
1 0.995 1.9±0.5
2 0.990 1.8±1.7
3 0.992 2.9±1.6
4 0.997 1.3±0.6
5 0.999 2.4±1.3
6 0.997 2.1±0.6
4 DISCUSSIONS
Since the high-frequency component of S1 is
comprised of multi peaks of vibrating signal, the
program code for heart rate calculation would be a
complex one in the case without the use of the
cardiac beat detector although recent developments
in digital signal processing of the phonocardiogram
have been reported (Durand and Pibarot, 1995;
Wang et al, 2001). All intervals between peaks of S1
and S2 in addition to respiration sound noises, which
are all composed of multi-peaked signal and
fluctuate in interval and/or in magnitude, should be
measured quickly and the initial point of the S1
should be properly identified almost instantaneously
during each heart cycle of less than 100 ms. In
contrast to such considerably complex digital signal
processing, making the quasi-digital pulse from
vibrating S1 signal with enhancing S/N ratio using
the cardiac beat detector ensures the easier digital
conversion of the S1 signal for the heart rate
calculation.
In conclusion, the present study demonstrated
that the cardiac beat detector has a performance
suitable for the non-invasive detection of S1 in the
heart sounds of small animals. It should be noted
that the cardiac beat detector is available not only for
anesthetized small animals but also unanesthetized
animals and humans at sleep or rest. Indeed, the PZT
system can be applied to unanesthetized newborn
mice (Sato et al., 2007), human infants (Sato et al.,
2006) or bedridden patients after some alteration to
the sensor construction. As the cardiac beat detector
greatly reduces the program code for S1 detection, it
would help us to create novel phonocardiogram-
based equipments for a wide range of fields in
clinical and basic sciences in medicine.
CARDIAC BEAT DETECTOR - A Novel Analogue Circuitry for the First Heart Sound Discrimination
139

ACKNOWLEDGEMENTS
I wish to thank Prof. Kyoichi Ono, Prof. Nobuya
Inagaki and Prof. Katsuya Yamada for helpful
advice and suggestions.
REFERENCES
Durand, LG., Pibarot, P., 1995. “Digital signal processing
of the phonocardiogram: review of the most recent
advancements”, CRC Crit Rev Biomed Eng 23: 163–
219
Manecke, GR. Jr., Nemirov, MA., Bicker, AA., Adsumelli,
RN., Poppers, PJ., 1999. “The effect of halothane on
the amplitude and frequency characteristics of heart
sounds in children”, Anesth Analg 88: 263–267.
Rangayyan, RM., Lehner, RJ., 1988. “Phonocardiogram
signal analysis: a review”, CRC Crit Rev Biomed Eng
15: 211–236.
Sato, S., K, Yamada., N, Inagaki., 2006. “System for
simultaneously monitoring heart and breathing rate in
mice using a piezoelectric transducer”, Med Biol Eng
Comput 44(5): 353-362.
Sato, S., Ishida, A., Kawamura, N., Nakajima, W., Takada,
G., Inagaki, N., 2006. “A new PZT (piezoelectric
transducer)-based heartbeat and breathing monitor
system for newborn”, Pediatric Academic Society’s
Annual Meeting San Francisco, California.
Sato, S., 2007. “Heart rate drop in newborn mice caused
by attaching ECG electrodes”, J Physiol Sci 57(suppl):
S136.
Wang, W., Guo, Z., Yang, J., Zhang, Y., Durand, LG.,
Loew, M., 2001. “Analysis of the first heart sound
using the matching pursuit method”, Med Biol Eng
Comput 39(6): 644-8.
Yamada, K., Ji, JJ., Yuan, H., Miki, T., Sato, S.,
Horimoto, N., Shimizu, T., Seino, S., Inagaki, N.,
2001. “Protective role of ATP-sensitive potassium
channels in hypoxia-induced generalized seizure”,
Science 292(5521): 1543-6.
BIOSIGNALS 2008 - International Conference on Bio-inspired Systems and Signal Processing
140
