REALTIME NEOCORTICAL COLUMN VISUALIZATION
Pablo de Heras Ciechomski and Robin Mange
Visualbiotech, PSE-C EPFL, 1015 Ecublens, Switzerland
Keywords:
Realtime system, computer graphics, visualization, computational biology, neuroscience.
Abstract:
This paper presents a method for real-time rendering of a neocortical column in the mouse brain with 10000
individually simulated neurons, as implemented in the software GabrielStudio (TM). It also presents how the
same system is used to create movie sequences of scripted camera keyframes for high resolution outputs.
The current system is running on an SGI Altix Prism Extreme with 16 parallel graphics cards and a shared
memory of 300 GB. Gabrielstudio works as a virtual microscope for computational neuroscientists to analyze
their simulations of neurons.
1 INTRODUCTION
In the field of computational neuroscience simula-
tions of neurons arranged in circuits like the neocor-
tex in the rat brain, are quite complex in the amount
of data that is created for each simulation step. The
simulation computes the electrical membrane poten-
tial of the neurons, at a detail level of each individ-
ual branch in its morphology (Carnevale and Hines,
2006). A typical neuron morphology consists of a
spherical soma of 20 micro meters (see Figure 1),
a tubular axon and tubular dendrites which in turn
can be branched down to very fine segments of tissue
and usually contribute 300 sections (Al-Kofahi et al.,
2002), (Can et al., 1999), (Kuss et al., 2007). Each
of these three basic morphological parts are also sub-
partitioned into electrical compartments, which on av-
erage are five per section depending on the length
of the section. In order to analyze the fully detailed
simulation at electrical compartment level on average
10000 neurons, times 300 sections, times five data
points are inspected, which is 15 million data points
in total per 10 millisecond simulation step. One real
second of activity in the brain is quantized into steps
of 10 milliseconds, so that there are 100 steps per real
second of activity. Each such step can take minutes
to compute even on an IBM Blue Gene (TM) super
computer (BlueBrain, 2007).
Analyzing 15 million data points individually per
time step is not reasonable, to simplify this, compu-
tational neuroscientists generally only have a look at
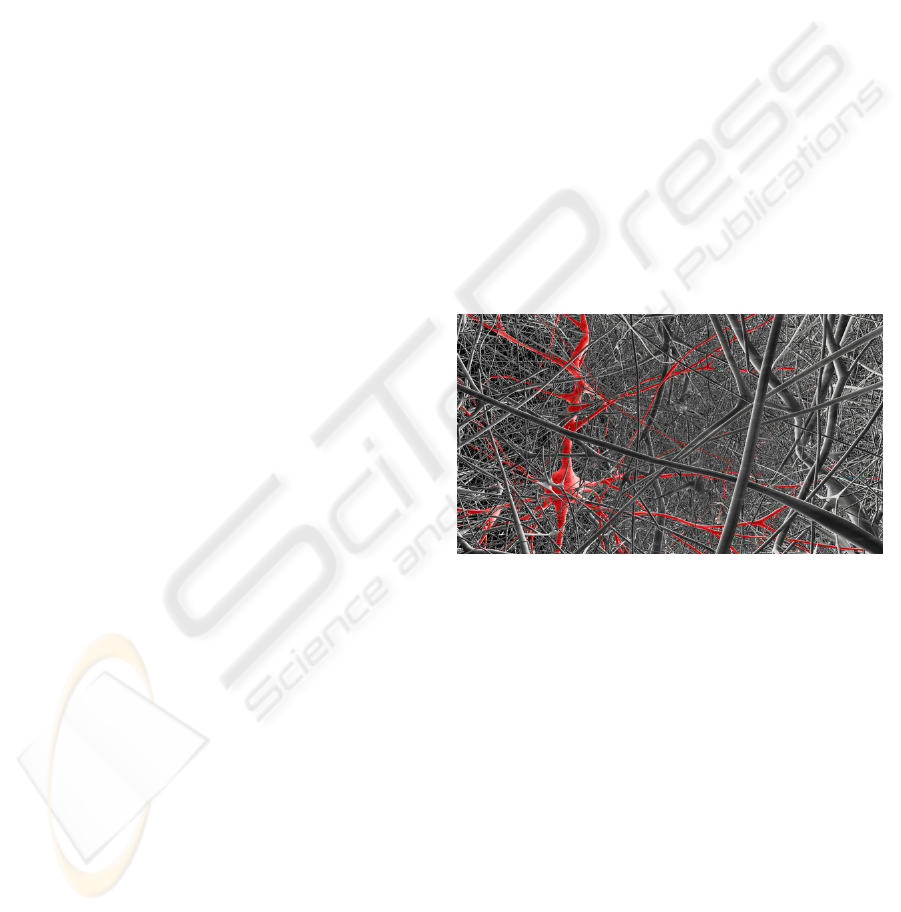
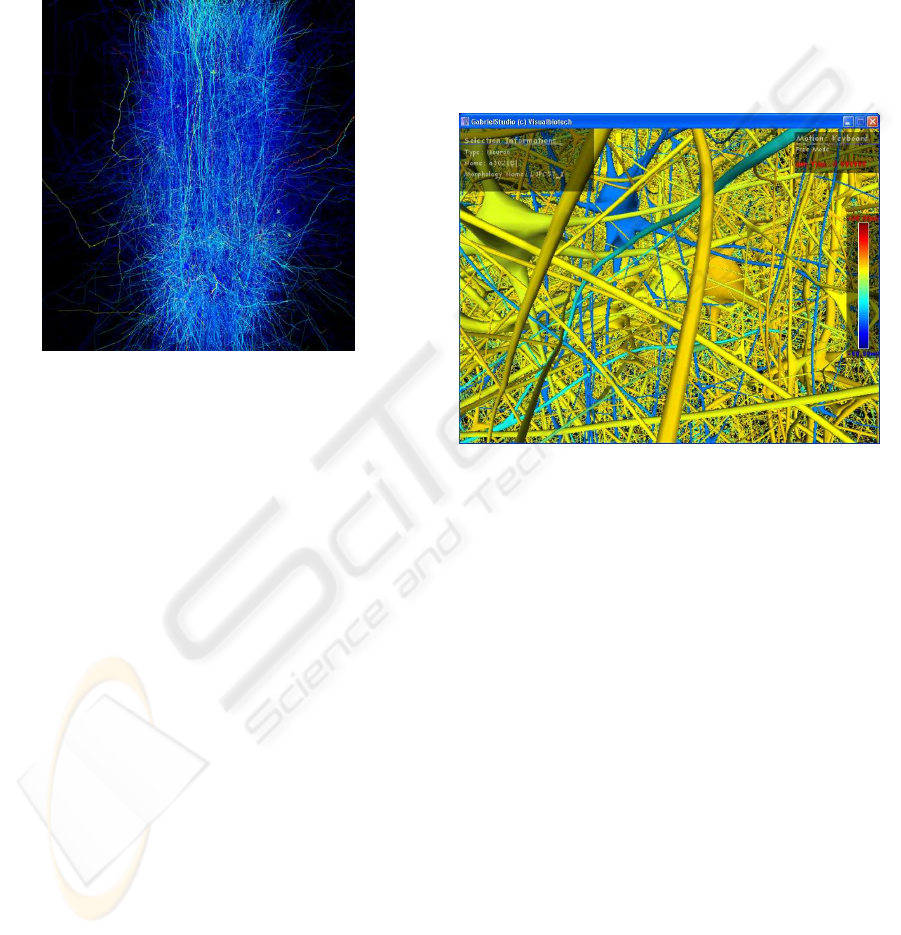
Figure 1: One neuron is highlighted as red in the column.
the membrane potential at the soma level of the neu-
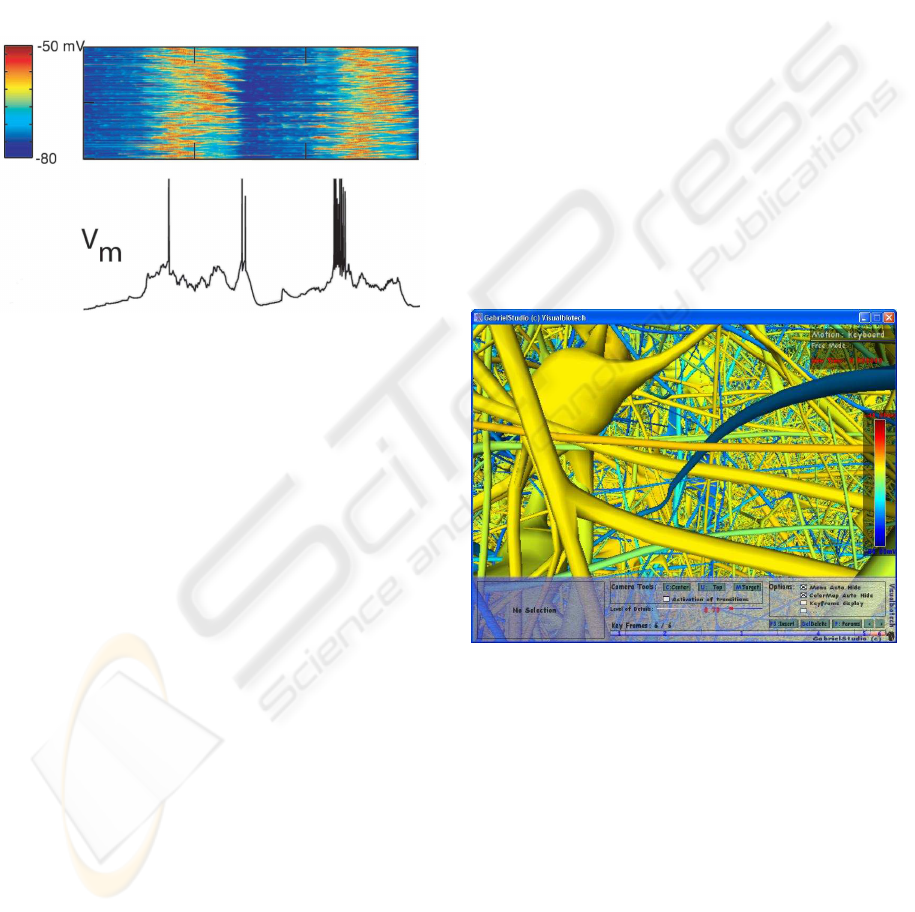
rons. If a normal color map view is used (see Figure
2) the scientist analyzes the data where each column
of data is one time step and each row is the voltage
value for the soma of that neuron. In visualization
terms the flat 2D view, maps data from four dimen-
sions into two dimensions since the original neuronal
data is in three physical dimensions (position) and one
time dimension (the time step). Data loss is inevitable
if one data point is supposed to represent on average
1500 points. One can argue that only the somas are
important in neuronal research. As simulations get
more complex and include dendrite and synapse de-
tails, debugging the simulation itself becomes next to
impossible, if one cannot access all levels of impor-
tance (Westerhoff, 2003).
Using a 3D real-time view the user can explore
the circuit without any simulation knowledge neces-
283
de Heras Ciechomski P. and Mange R. (2008).
REALTIME NEOCORTICAL COLUMN VISUALIZATION.
In Proceedings of the First International Conference on Bio-inspired Systems and Signal Processing, pages 283-288
DOI: 10.5220/0001068102830288
Copyright
c
SciTePress
sary in the viewer itself. As an operator of this vir-
tual microscope it is possible to stand in all positions
and view the neocortical circuit from any angle or per-
spective. The amount of information is as overwhelm-
ing as before (15 million data points) but it is rendered
in the positions where it belongs, so that electrical po-
tentials for axons innerving nearby dendrites are close
and visually connected. In this virtual microscope it is
also possible to do virtual clamping in the full circuit
enabling the user to follow and record the electrical
history for a specific clamping point.
Figure 2: Each column is a time step and each row is the
membrane potentials for the soma of one neuron. (Hill and
Tononi, 2004).
The software library capable of rendering the neo-
cortical column is called GabrielStudio. It is generic
in terms of visualization for different areas of com-
putational biology, and is the basis of the virtual mi-
croscope. Since this software is commercial only an
older version of the software and the underlying al-
gorithms are presented here, as the newest version
is confidential. Nevertheless the authors are shar-
ing some of the design decisions, rendering optimiza-
tions, adaptations to the SGI multi-pipe toolkit (MPK)
and general interface decisions. The rendering en-
gine is based on a target centric design where a tar-
get can be a set of neurons represented as triangle
meshes, lines, segments (Melek et al., 2006), (Stoll
et al., 2005) or soma billboards (Tarini et al., 2006),
(Holm et al., 2005). Individual neurons can at all
times be visible, invisible, colored independently and
have simulation applied to them or not. The system is
described in more detail in the following sections of
the paper.
2 GABRIELSTUDIO
The rendering engine is based on the notion of tar-
gets where the total possible neurons to render is a set
called the universe target. Each neuron has morphol-
ogy which is a hierarchical description of a neuron in
a directed acyclic graph manner (DAG), see Section
2.2.1. Several neurons share the same morphology
where a circuit of 10 000 neurons usually contains
700 different morphologies of 100 000 or more tri-
angles. To visuallize the column using a brute force
rendering method, a total of one billion triangles per
frame would have to be rendered. Given that a nor-
mal graphics card of 2007 can render 25 million tri-
angles per second, this would take 40 seconds to ren-
der. Since the system is real-time an acceptable speed
is 25 updates per second, which is 1000 times faster
than one update every 40 seconds. Using the multiple
pipes of an SGI Prism Extreme one can leverage this
speed ten times, which gives us having to speed up
the brute force method by a factor of 100. A factor
of ten is always welcome. The solution proposed in
this paper is the use of a regular grid, which is com-
mon in ray tracing and is a voxelizationprocess on the
triangle data.
2.1 Rendering Pipeline
Figure 3: Action potential on neurons in the exploratory
mode of GabrielStudio.
The neurons are inserted one by one, triangle by tri-
angle, into the grid so that each grid cell contains a
list of pointers to triangle data (3 vertices, uvs, nor-
mals and simulation information). Then the cells are
re-allocated so that each cell contains an offset into
a large continuous array of geometrical data. De-
pending on which neurons are part of the visible tar-
gets and level of detail (LOD), the index tables of
the cell are appropriately called. Each cell has three
LODs for each representation which is either trian-
gle or mesh surface, diameter thick segments and one
pixel wide lines. Two independent modes are ren-
dered separately namely, the soma view using bill-
boarded spheres and the synaptic view also using bill-
BIOSIGNALS 2008 - International Conference on Bio-inspired Systems and Signal Processing
284
boards. The synapses are rendered connected to the
hierarchy of the lines or branches that are visible.
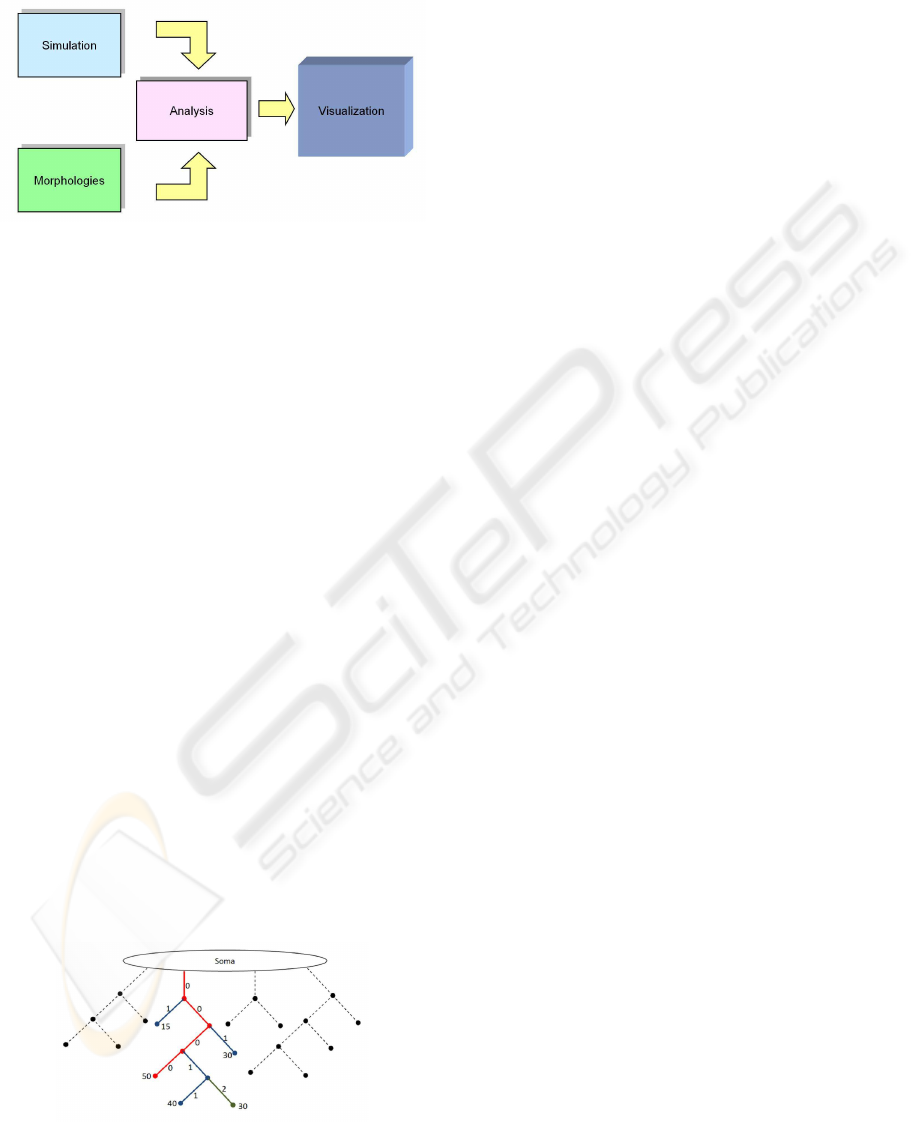
Figure 4: The visualization pipeline.
2.2 Regular Grid
The world of computer graphics consists mainly in
tradeoffs between complexity and performance: level
of detail (LOD) is a method offering such compro-
mises and is explained in detail in the book (Luebke
et al., 2002). Several examples of usage of this tech-
nique can also be seen in the papers (Gumhold et al.,
2003) and (Schaufler and St¨urzlinger, 1995) and Sec-
tion 4 of this paper.
LODs are used to group branches in a priority or-
der, going from always visible (LOD 0) to less im-
portant branches (LOD 2). Those LODs are com-
puted when the neuron data is integrated into the reg-
ular grid with the help of a recursive algorithm which
will be discussed later. This computation need to be
done once, in an initialization phase at the launching
of the program. During this phase, each neuron is
inserted into the grid and its branches are distributed
among the buffersof each LOD. Before going more in
depth into the procedure, it is necessary to recall how
a neuron is defined. It contains one root, from which
several branches reach out, that in turn can be sub-
branched. They are organized in sections which allow
representing the whole hierarchy of the neuron easily.
More precisely, those sections indicate the linkage of
each node going from the root to the extremities.
Figure 5: Neuron morphology branching numbering. No-
tice how at each branching only one section keeps the father
number.
2.2.1 Insertion Into Lods
The insertion into LOD buffers is done according to
a certain branch priority. The branching computation
is done for each neuron morphology independently.
It is made by going through each existing branch of
a neuron, using the corresponding section map, and
then attributing an index to each segment correspond-
ing to the actual priority of its branch. To define this
priority, a recursive algorithm is used, which looks
at the depth of each branching and gives higher pri-
orities to the longer ones. For a better understand-
ing of this, it is possible to represent this scheme as
a tree, where the nodes represent the splitting points
between two branches taking as value the actual dis-
tance from the root (the neuron soma). Assuming the
aim of the algorithm is to compute the sorting of one
of the branches starting from the root; the path with
the highest priority is going from the root to the ex-
tremity children with the largest distance; denoted as
the longest branch of the tree (see Figure 5). Once
this main branch is known, it starts from the root and
goes through all the nodes of the tree. At intersection
i (node i) it keeps the current priority for the longest
branch of the sub-tree with node i as root and the other
branch gets this priority increased by 1. Like that we
will have branching index from 0 to a maximum of
255 (fixed limit). From those indices we can enter
each vertices inside the corresponding LOD array re-
specting some ranges defined by the user (e.g. Lod-0:
0,1 / Lod-1: 2,3 / Lod-2: 4,...,255). Then each branch
of a neuron will be rendered or not by comparing its
LOD with the current LOD of the cell. In a similar
manner synapses also need to be rendered condition-
ally to the LOD level.
2.2.2 Usage of the Lods
Employing a LOD system, allows splitting the render-
ing into several levels of detail yielding better perfor-
mance. Those levels are defined by cells accordingly
to the distance to the camera position, such that the
closer cell to the viewer the better its definition is.
2.2.3 Update Function
Another particularity regarding the implementation of
the regular grid is the use of an update target function
which allows to have a per branch visibility capacity
and a per cell representation mode. Each time a neu-
ron state is changed (visibility or representation), the
data is checked once and the right indices of the visi-
ble neurons are entered into the grid. The line buffer
and the mesh buffer are used depending on the cur-
rent cell representation. Since drawing is done using
REALTIME NEOCORTICAL COLUMN VISUALIZATION
285
arrays, it allows having the correct indices always di-
rectly for the rendering phase reducing the real-time
computational expense.
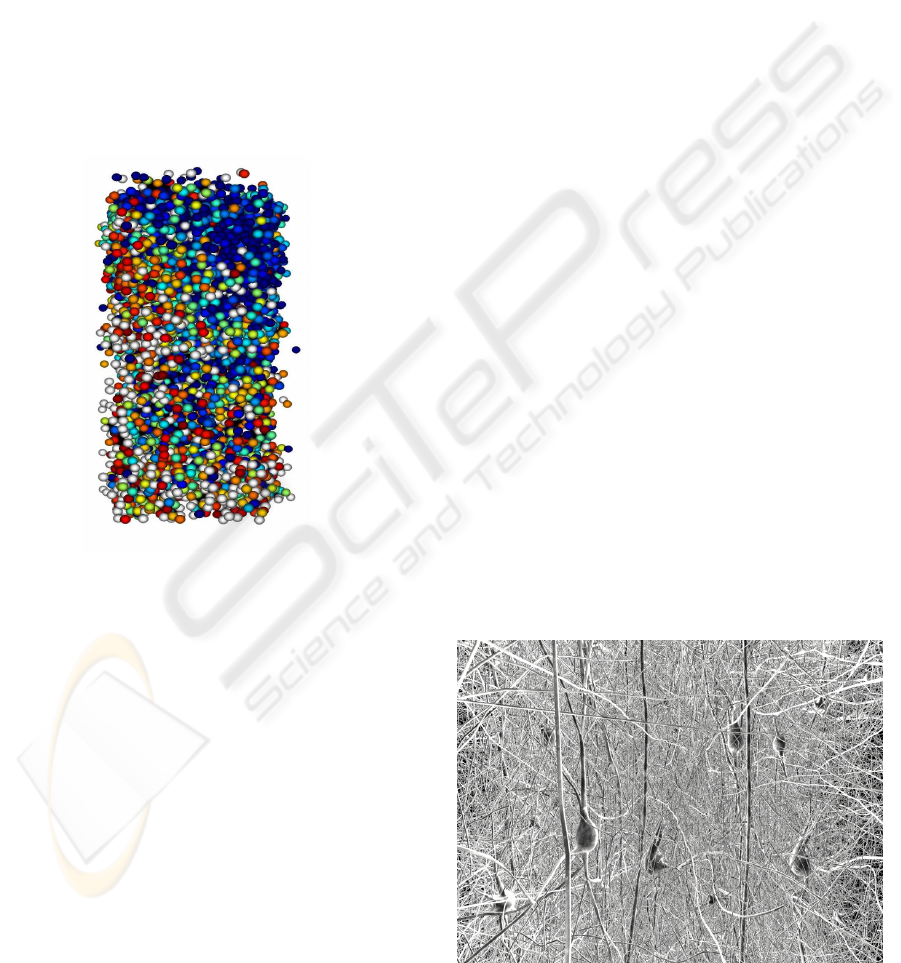
2.3 Stylized Rendering
The implementation seen in the last section allows the
use of different data representations. This is a nec-
essary functionality since sometimes it is preferable
to have a more simple representation using less de-
tails for a better global view. This is possible with
the use of billboarding techniques which allows ren-
dering neurons as spheres (using quadriliterals always
in front of the camera, see Figure 6) and more somas
are visible since no extra branches are occluding each
other.
Figure 6: GabrielStudio also renders using billboards of so-
mas.
2.4 User Interface
In order to interact dynamically with the rendering, a
user interface was created. It offers several possibil-
ities from camera centering to key frame editing. A
lot of useful options are given to the user and allows
having a good feeling about what is happening on the
screen. There is an indication about the current se-
lection, neuron or synapse and the simulation color
mapping allowing to distinguish the current electri-
cal value of each entity as well as the number of key
frames kept for the movie creation, as depicted in Fig-
ure 9.
2.5 Scalable Rendering Architecture
The major difference between rendering on a single
graphics card architecture available on most PCs and
a parallel graphics pipeline, as the SGI Prism, is that
several graphics contexts need to be tracked and up-
dated simultaneously. Since the library uses GLEW
to handle OpenGL extensions, it also keeps a sepa-
rate MX GLEW context per graphics card. However
recompiling such a library including a multi-pipe ver-
sion of a helper library is not sufficient. This comes
as the result that each function in the rendering engine
that uses shaders, textures, vertex buffer objects, dis-
play lists or any other context specific data has a spe-
cial structure sent to it containing the necessary data
for that context. Each graphics card is assigned this
context upon entry into that threads rendering loop.
3 CREATING MOVIES
Science needs to reach out and touch more interested
minds through marketing, which is possible to do
through the movie creation pipeline of GabrielStudio.
Using such a software tool the user has the possibility
to navigate through the scene, using the virtual mi-
croscope view and sample the interesting locations.
A set of sampled view points or camera key frames
are interpolated and rendered using a non-interactive
mode for high resolution and detail as shown in Fig-
ure 7. Standard digital movie production pipelines are
used for editing. In the off-line mode it is also possi-
ble to output stereo images for passive stereo outputs
as displayed in Figure 1. These movies are shown to
various visitors of our clients projects to give them a
better picture of what neuroscience entails and reveal
some of its mysteries. Movies are also shown at con-
ferences for scientific discourses and presentations. It
is also possible to do individual snapshots in high res-
olution for posters that require greater details.
Figure 7: From a stereo flythrough sequence of the den-
dritic forest. The effect of having to dodge parts of neurons
coming out of the screen is quite dramatic.
BIOSIGNALS 2008 - International Conference on Bio-inspired Systems and Signal Processing
286
4 RESULTS
Rendering the neurons on a SGI Prism Extreme with
16 graphics cards, gives acceptable update rates of
15 frames per second with 5000 neurons in view.
The viewer can observe the neurons from a distance
or a closer range, while having the details preserved
thanks to the employed LOD system.
Figure 8: Simulation mapping applied.
When using the regular grid one must cope with
some additional requirements. A typical example is
the case when the viewer is far away from the col-
umn, such that the cells being just in front of the cam-
era are rendered with a high level of detail i.e. all
LODs are displayed. Those being near to the center
of the column are represented using a lower defini-
tion, and some of the branches belonging to the LOD-
2 are displayed in the front cells and not in the back
ones. Since the branches appear not to be linked, the
user gets a strange impression about the scene. One
possible solution to such cases is to check for each
branch whether one of its parts is drawn; if this is the
case, this branch is rendered in each visible cell. In or-
der to achieve such an implementation, a regular grid
should be somehow replaced, since using the condi-
tional tests increases the computational cost. Other-
wise utilizing a regular grid leads to satisfying results
even when employing the update target function since
it is done only once per update and not per frame, at
the rate of user interactions.
5 CONCLUSIONS
In this paper the software tool for real-time visual-
ization of neurons has been presented. Acceptable
rendering speeds are attained on large shared memory
machines, where geometry duplication is not a limit-
ing factor due to 300 GB memory banks. However,
this is not useful on ordinary PCs, which is the next
challenge for the authors. Using a regular grid gives a
memory bound problem that is comfortable to render
on a parallel rendering architecture. The movie mode
of the described software GabrielStudio allows movie
creation with ease. Finally the possibility of interact-
ing and exploring the data in real-time, offers new
perspectives to neuroscientists to observe their own
simulations. Besides being a powerful tool for neuro-
logical process monitoring, the proposed software has
additional applications for marketing purposes.
Figure 9: Selecting neurons in GabrielStudio.
ACKNOWLEDGEMENTS
Professor Henry Markram of the Blue Brain Project.
Blue Brain Project for data. Sebastien Lasserre for the
morphologies built in Maya.
REFERENCES
Al-Kofahi, K. A., Lasek, S., Szarowski, D. H., Pace, C. J.,
Nagy, G., Turner, J. N., and Roysam, B. (2002). Rapid
automated three-dimensional tracing of neurons from
confocal image stacks. IEEE Transactions on Infor-
mation Technology in Biomedicine, 6(2):171–187.
BlueBrain (2007). A comoputational neuroscience project
at ecole polytechnique federal de lausanne (epfl), lau-
sanne, switzerland.
Can, A., Turner, J., Tanenbaum, H., and Roysam, B. (1999).
Rapid automated tracing and feature extraction from
live high-resolution retinal fundus images using direct
exploratory algorithms.
Carnevale, N. T. and Hines, M. L. (2006). The NEURON
Book. Cambridge University Press, New York, NY,
USA.
REALTIME NEOCORTICAL COLUMN VISUALIZATION
287

Gumhold, S., Borodin, P., and Klein, R.(2003). Intersection
free simplification. International Journal of Shape
Modeling (IJSM), 9(2):155–176.
Hill, S. L. and Tononi, G. (2004). Modeling sleep and wake-
fulness in the thalamocortical system. Journal of Neu-
rophysiology, pages 1671–1698.
Holm, A., Offen, L., and Fellner, D. (2005). Biobrowser a
framework for fast protein visualization. In EUROVIS
2005 / IEEE VGTC Symposium on Visualization 2005,
pages 287–294.
Kuss, A., Hege, H.-C., Krofczik, S., and Borner, J. (2007).
Pipeline for the creation of surface-based averaged
brain atlases. accepted for publication.
Luebke, D., Watson, B., Cohen, J. D., Reddy, M., and
Varshney, A. (2002). Level of Detail for 3D Graph-
ics. Elsevier Science Inc., New York, NY, USA.
Melek, Z., Mayerich, D., Yuksel, C., and Keyser, J. (2006).
Visualization of fibrous and thread-like data. IEEE
Transactions on Visualization and Computer Graph-
ics, 12(5):1165–1172.
Schaufler, G. and St¨urzlinger, W. (1995). Generating multi-
ple levels of detail from polygonal geometry models.
In G¨obel, M., editor, Virtual Environments ’95 (Eu-
rographics Workshop), pages 33–41. Springer-Verlag:
Heidelberg, Germany.
Stoll, C., Gumhold, S., and Seidel, H.-P. (2005). Visualiza-
tion with stylized line primitives. In IEEE Visualiza-
tion, page 88.
Tarini, M., Cignoni, P., and Montani, C. (2006). Ambient
occlusion and edge cueing to enhance real time molec-
ular visualization. IEEE Transaction on Visualization
and Computer Graphics, 12(6).
Westerhoff, M. (2003). Efficient visualization and re-
construction of 3d geometric models from neuro-
biological confocal microscope scans. Phd Thesis.
BIOSIGNALS 2008 - International Conference on Bio-inspired Systems and Signal Processing
288
