
ANALYSIS OF HEART RATE AND BLOOD PRESSURE
VARIABILITY IN PREGNANCY
New Method for the Prediction of Preeclampsia
H. Malberg
Karlsruhe Research Center, Institute for Applied Computer Science, Herrmann-von-Helmholtz-Platz 1
76344 Eggenstein-Leopoldshafen, Germany
R. Bauernschmitt
Clinic for Cardiovascular Surgery, German Heart Center Munich, Germany
T. Walther
Department of Cardiology, Charité, Campus Benjamin Franklin (CBF), Berlin, Germany
A. Voss
Department of Medical Engineering, University of Applied Sciences, Jena, Germany
Renaldo Faber, Holger Stepan
Department of Obstetrics and Gynecology, University of Leipzig, Germany
N. Wessel
Department of Physics, University of Potsdam, Germany
Keywords: Heart Rate Variability, Blood Pressure Variability, baroreceptor reflex; screening, risk stratification.
Abstract: Pre-eclampsia is a serious disorder with high morbidity and mortality occurring during pregnancy; 3%–5%
of all pregnant women are affected. Although most pre-eclamptic patients show pathological uterine perfu-
sion in the second trimester, this parameter has a positive predictive accuracy of only 30%, which makes it
unsuitable for early, reliable prediction. The study is based on the hypothesis that alterations in cardiovascu-
lar regulatory behavior can be used to predict PE. Ninety-six pregnant women in whom Doppler investiga-
tion detected perfusion disorders of the uterine arteries were included in the study. Twentyfour of these
pregnant women developed PE after the 30th week of gestation. During pregnancy, additional several non-
invasive continuous blood pressure recordings were made over 30 min under resting conditions by means of
a finger cuff. In the period between the 18th and 26th weeks of pregnancy, three special variability and
baroreflex parameters were able to predict PE several weeks before clinical manifestation. Discriminant
function analysis of these parameters was able to predict PE with a sensitivity and specificity of 87.5% and
a positive predictive value of 70%. The combined clinical assessment of uterine perfusion and cardiovascu-
lar variability demonstrates the best current prediction several weeks before clinical manifestation of PE.
1 INTRODUCTION
Pre-eclampsia (PE) is a serious pregnancy-specific
disorder. It is characterized by sudden hypertension
>140/90 mm Hg and a proteinuria (>300 mg in 24
hours). The manifestation of PE is the main cause of
maternal and neonatal morbidity and mortality; it
occurs in 3-5 % of all pregnancies.
Although the etiology and pathogenetic factors
of the disease are largely unknown, early risk as-
sessment by Doppler sonography has become an
established procedure. However, the positive predic-
tive accuracy (PPA) of Doppler sonography is lim-
ited to 30 %, as pregnant women with disturbed
uterine perfusion may develop a PE, a pregnancy-
induced hypertension (PIH), or a neonatal intra-
uterine growth retardation (IUGR) (Chien, 2000).
47
Malberg H., Bauernschmitt R., Walther T., Voss A., Faber R., Stepan H. and Wessel N. (2008).
ANALYSIS OF HEART RATE AND BLOOD PRESSURE VARIABILITY IN PREGNANCY - New Method for the Prediction of Preeclampsia.
In Proceedings of the First International Conference on Bio-inspired Systems and Signal Processing, pages 47-55
DOI: 10.5220/0001066400470055
Copyright
c
SciTePress

Earlier studies were unable to find either inde-
pendent markers in the maternal plasma or physio-
logical parameters easy to measure and, in this way,
improve the screening efficacy of Doppler sonogra-
phy (Benedetto, 1998).
Analyses of heart rate variability (HRV), systolic
(SBPV) and diastolic blood pressure variability
(DBPV) and baroreflex (BR) sensitivity (BRS) were
able to demonstrate their high diagnostic and prog-
nostic powers in various studies characterizing
autonomous cardiovascular regulation in various
diseases (La Rovere, 2001). Various studies demon-
strated the suitability of these methods in hyperten-
sive disorders of pregnancy, such as chronic hyper-
tension (Walther, 2005), gestational hypertension
(Hermida, 1998), and in PE (Faber, 2004). However,
these diseases were clinically manifest already at the
time of examination.
In contrast to those other studies, this study em-
ploys the approach of looking for characteristic al-
terations in cardiovascular regulation before the
sudden rise of blood pressure. The study is based on
the hypothesis that alterations in cardiovascular
regulatory behavior can be used to predict PE. Con-
ventional clinical prediction, i.e. Doppler sonogra-
phy, has to be taken into account. Earlier findings
have shown that the sole use of variability analysis
in the 18th – 22nd weeks of gestation (WOG) was
able to attain a PPA of 50 % (Walther, 2006). In
addition, a combined study of variability and uterine
perfusion achieved a PPA of 71.6 %, which may be
considered the best finding for a non-invasive risk
marker of PE at this point in time. In the study out-
lined below, findings are to be validated in an ex-
tended group of patients over a longer period of ex-
amination between the 18th and the 26th weeks of
gestation.
2 PATIENTS
96 patients with abnormal uterine perfusion (AUP)
were included in the study. All pregnant women
underwent Doppler sonography in the 2nd trimester
of pregnancy (median 22nd week of gestation,
WOG, range 18 – 26 weeks) at the Department of
Obstetrics and Gynecology of the University of
Leipzig. 24 of these pregnant women developed PE
after the 30th week of gestation. Approval by the
local ethics committee and the informed consent of
all subjects were obtained. All pregnancies were
singleton. At the time of examination, the women
were healthy, normotensive, without clinical signs of
cervical incompetence, and on no medication.
Clinically, the development of pregnancy was
subdivided in accordance with PE, pregnancy-
induced hypertension (PIH), intrauterine growth
retardation (IUGR), or pregnancy without any fur-
ther complications. PE was classified in line with the
guidelines of the International Society for the Study
of Hypertension in Pregnancy. PIH was described by
the rise of several blood pressure levels to more than
140 mm Hg in the systole and more than 90 mm Hg
in the diastole within four hours. Significant pro-
teinuria is characterized by an excretion of more
than 300 mg of total protein in 24 hours. Where
these data were not available, proteinuria was de-
tected by dipstick on two consecutive occasions
within four hours. Intrauterine growth retardation
was defined by the birth weight being below the
10th percentile of a reference group.
3 METHODS
Doppler examination of the uterine arteries was car-
ried out with a LOGIQ 9 ultrasound machine (GE,
Solingen, Germany) with a 5 MHz convex trans-
ducer by the same sonographer. Uterine perfusion
was classified as pathological when there was bilat-
eral notching or a mean pulsatility index (PI) of both
arteries above 1.45. Immediately after the Doppler
examination, continuous blood pressure monitoring
was conducted non-invasively via finger cuff (100
Hz, Portapres device mod. 2, BMI-TNO, Amster-
dam, The Netherlands). The measurements were
performed under standardized resting conditions
between 8 a.m. and 12 noon. The continuous blood
pressure curves were used to extract the time series
of beat-to-beat intervals, systolic and diastolic blood
pressures.
3.1 Preprocessing
The main objective of the analysis of heart rate and
blood pressure is to investigate the cardiovascular
system during normal sinus rhythm. Therefore, it is
necessary to exclude not only artifacts (e.g. double
recognition, i.e. R-peak and T-wave recognized as
two beats) but also beats not coming from the sinus
node of the heart, so called ventricular premature
complexes (VPC). VPCs are not directly controlled
by the autonomous nervous system. Practically, this
exclusion means filtering of the time series. The
original time series are denoted RR-series (derived
from the RR-intervals) and the filtered time series,
NN-series (normal-to-normal beat interval, NNI).
VPCs in the tachogram are usually characterized by
BIOSIGNALS 2008 - International Conference on Bio-inspired Systems and Signal Processing
48

regular ventricular premature beat and supraven-
tricular premature beat complexes). The 20%-filter
(Kleiger, 1987) considers these facts; if the current
value of the tachogram differs from its predecessor
by more than 20%, the current value and its succes-
sor are marked not normal. VPCs with less than 20%
difference are not removed from the series and may
falsify almost all HRV or BPV parameters. The RR-
intervals recognized as not normal are treated in
different ways: either they are simply removed from
the series or interpolated linearly or spline interpo-
lated (Lippmann, 1994). Interpolating linearly may
lead to false decreased variability’s, interpolating
with splines often fails in time series with many
VPCs. In several clinical studies, an adaptive filter-
ing algorithm introduced in (Wessel, 2000) has been
proven to exclude premature beats and artifacts. The
main advantage of this procedure is the spontaneous
adaptation to variability changes in the series, which
enables a more reliable removal of artifacts and
VPCs. This new filtering algorithm consists of three
sub-procedures: (i) the removal of obvious recogni-
tion errors, (ii) the adaptive percent filter, and (iii)
the adaptive controlling filter. A MATLAB imple-
mentation of the preprocessing algorithm is avail-
able from <tocsy.agnld.uni-potsdam.de>.
3.2 Heart rate and Blood Pressure
Variability
Standard methods of HRV analysis include time and
frequency domain parameters; these are linear meth-
ods. Time domain parameters are based on simple
statistical methods derived from the RR-intervals as
well as the differences between them. The mean
heart rate is the simplest parameter, but the standard
deviation over the whole time series (sdNN) is the
most prominent HRV measure for estimating overall
HRV. A list of these parameters is given in Table 1.
These parameters can be calculated for short (5 min-
utes) and long (24 hours) term epochs, representing
short-term and long-term variability, respectively, or
for averaged short-term epochs (e.g. a mean of 288
five-minute intervals a day). The overall HRV esti-
mate, sdNN, and other time domain parameters can
be used to predict mortality in the recovery period
after myocardial infarction. In one of the first risk
studies using these parameters, (Kleiger, 1987)
showed that an sdNN<50ms was associated with a
5.3-fold increased mortality when compared to pa-
tients with preserved HRV (sdNN>100ms).
Time domain geometric methods (see Table 1)
are methods by which the NNIs are converted into
special geometric forms quantifying their distribu-
tion. Special forms are used to make the approach
more insensitive to artifacts and ectopic beats. A
disadvantage of these methods is that they require a
considerable number of RR-intervals; they are thus
not applicable to very short-term time series. A tri-
angular index, HRVi, showing reduced HRV has
been associated with both arrhythmic and non-
arrhythmic death (Task Force, 1996).
Table 1: Description of time and frequency domain pa-
rameters, adopted standards (Task Force, 1996) and addi-
tional measures developed by the authors (•). NNI stands
for the filtered beat-to-beat intervals (NN-intervals).
Variable Units Definition
Time domain statistical methods
meanNN ms/mm Hg
Mean NNI and mean BP, re-
spectively
sdNN ms/mm Hg
Standard deviation of all NNI
and BP values, respectively
rmssd ms/mm Hg
Root mean square of succes-
sive NNI/BP differences
•pNNX %
Percentage of beat-to-beat
differences greater than X
ms/mm Hg (e.g. X = 3/6/9
ms/mm Hg)
•pNNlX %
Percentage of beat-to-beat
differences lower than X
ms/mm Hg (e.g. X = 3/6/9/12
ms/mm Hg)
•Shannon None
Shannon entropy of the histo-
gram (density distribution of
the NNIs/ BP values)
•RenyiX None
Renyi entropy of the order X of
the histogram (e.g. X =
2/4/0.25)
Time domain geometric methods
HRVi none
HRV triangular index (see
(Task Force, 1996) for details)
TINN ms
Baseline width of the minimum
square difference triangle
Frequency domain methods
P ms
2
/mm Hg
2
Total power from 0 − 0.4Hz
VLF ms
2
/mm Hg
2
Very low frequency band,
0.0033 − 0.04Hz
LF ms
2
/mm Hg
2
Low-frequency band, 0.04 −
0.15 Hz
HF ms
2
/mm Hg
2
High-frequency band, 0.15 −
0.4 Hz
LF/HF None Quotient of LF and HF
LFn None
Normalized low-frequency
band (LF/(LF+HF))
cross 1/f
Intercept of a log-log-power
spectrum
slope 1/f
Slope of a log-log-power spec-
trum
ANALYSIS OF HEART RATE AND BLOOD PRESSURE VARIABILITY IN PREGNANCY - New Method for the
Prediction of Preeclampsia
49

We introduced a more robust method to quantify
the distribution (Voss, 1996) based on information
theory, in particular the Shannon and the Renyi en-
tropies of the histogram. We demonstrated the use-
fulness for risk stratification in a blinded study two
years later (Voss, 1998). Frequency domain HRV
parameters allow periodic dynamics in the heart rate
time series to be analyzed (Akselrod, 1981). There
are mainly two different techniques for spectral
analysis: methods based on Fast Fourier Transform
(FFT) and parametric autoregressive model esti-
mates of wavelet approaches. The results obtained
from using different spectral methods should be
comparable though (apart from differences in time
and frequency resolution). The Task Force on HRV
(Task Force, 1996) recommended that power spec-
tral analysis of 5-minute ECG recordings be used to
assess autonomic physiology and pharmacology.
Very low, low and high frequencies (see Table
1) can be estimated from such 5-minute ECG re-
cordings. In this study, all frequency domain pa-
rameters were calculated from the complete 30-
minute recording.The high frequency power reflects
the modulation of vagal activity by respiration
whereas the low-frequency power represents vagal
and sympathetic activities via the baroreflex loop.
The low-to-high frequency ratio is used as an index
of sympathovagal balance (Malliani, 1991). The
suitability of frequency domain parameters for risk
stratification of post-infarction patients was proven
by Bigger et al. (Bigger, 1992) - a reduction in ultra
low and very low frequency power is associated
with pathologies.For blood pressure series, all HRV
parameters described can be calculated accordingly,
only some statistical parameters need to be adapted
(e.g. pNN50 makes no sense for BPV - the standard
deviation for BP series varies between 5 and 10
mmHg).
3.3 Baroreflex Sensitivity
Analysis of spontaneous baroreflex sensitivity
(BRS) is very important for cardiac risk stratification
of various cardiovascular diseases (La Rovere,
2001). BRS slope is defined as the instinctive
change of NNI related to increasing or decreasing
levels of systolic blood pressure and is expressed in
[ms/mmHg]. There is evidence showing that a de-
creased BRS may carry an adverse prognosis in car-
diac patients (La Rovere, 1998).
For several years, BRS was determined pharma-
cologically (phenylephrine, nitro-prusside) (Vanoli,
1994) or mechanically (Cohen, 1981) until, in the
1980s, innovative methods of estimating BRS were
developed based on spontaneous heart rate and
blood pressure fluctuations (Di Rienzo, 1985).
Figure 1: The Dual Sequence Method of estimating spon-
taneous BRS analyses simultaneous (sync) and delayed
responses (shift 3, variable delay) of heart rate to blood
pressure increases (a) as well as bradycardic and tachy-
cardic blood pressure fluctuations (classical sequence
method (b). Moreover, also the slope sector distribution is
quantified (c). These slope sectors also can be defined as
overlapping regions.
These methods evaluate arterial baroreflex func-
tion in the absence of external stimulations of the
cardiovascular system, therefore defined as “sponta-
neous”. These spontaneous techniques nowadays are
the state of the art in research, though not in clinical
practice. We introduced the Dual Sequence Method
(DSM) (Malberg, 2002) for advanced spontaneous
baroreflex sensitivity estimates. This method con-
siders not only bradycardic (blood pressure increase
causes RR-interval increase) and tachycardic (blood
pressure decrease causes RR-interval decrease)
blood pressure fluctuations as introduced in the se-
quence method (Di Rienzo, 1985) (see Figure 1 (a)),
but also defines slope sectors quantifying the BRS
slope distribution (see Figure 1 (b)). Earlier studies
showed that the heart rate does not simultaneously
respond to the blood pressure fluctuation (Manicia,
1985). Therefore, DSM quantifies synchronous as
well as delayed heart rate response to the same BP
fluctuation (see Figure 1 (c)).
In summary, these are the parameter blocks and
ranges calculated by DSM:
(i) the total number of slopes in different sec-
tors within the time series,
(ii) the percentage of slopes relative to the to-
tal number of slopes in different sectors,(iii) the
numbers of bradycardic and tachycardic slopes,
(iv) the shift operation from the first to the third
heart beat triples, a variable lag, and
(v) the average slope of all fluctuations and its
standard deviation.
BIOSIGNALS 2008 - International Conference on Bio-inspired Systems and Signal Processing
50

The average BRS slope is defined as the NNI
difference related to SBP changes, and is estimated
by linear regression.
The parameters, ‘P_brady’, and, ‘P_tachy’, char-
acterize the incidence of increasing and decreasing
SBP triples with regard to the total number of SBP
values. Consequently, these parameters estimate the
basic cause of BRS activity. A reduced number of
ramps in SBP unavoidably leads to a reduced num-
ber of HR responses. The parameters are defined as
P_brady = (No. of increasing SBP triples/
total No. of SBP triples) * 100%
P_tachy = (No. of decreasing SBP triples/
total No. of SBP triples) * 100%
The percentage of adequate HR responses (BRS
events) relative to the numbers of SBP ramps is de-
scribed by the ‘Activation’ parameter. It is defined
as
Activation = (No. of BRS events/
No. of SBP ramps) * 100%.
In contrast to classical BRS methods, DSM de-
fines slope sectors allowing to quantify the BRS
slope distribution. Sectors with a range of 2 ms/mm
Hg have been proven to act as a suitable partition in
patient studies. Then, the percentages of BRS events
in different slope sectors relative to the total number
of BRS can be estimated. Moreover, the total num-
ber of BRS events is normalized to the mean heart
rate. For detailed definitions of the DSM parameters,
reference is made to the original contribution (Mal-
berg, 2002). These parameters are calculated for
bradycardic as well as tachycardic fluctuations, both
synchronous or delayed, to analyze a possibly de-
layed response of the heart rate to the same blood
pressure oscillation. This DSM method is used to
quantify sequences of length three; longer sequences
turned out not to be useful for spontaneous BRS
estimates because of their low occurrence.
3.4 Statistics
In this study, the Kruskal-Wallis test was used to
determine intergroup differences in clinical parame-
ters. The Mann-Whitney U test was employed to
analyze the differences in variability parameters
among pregnant women with uterine perfusion dis-
orders developing PE (number = 24) compared to
those not developing PE (NoPE, number = 72). The
level of significance of the intergroup differences
was defined as p < 0.05. Due to the explorative
character of the study we did not apply the multiple
test correction. Stepwise discriminant analysis was
employed to determine the best combinations of
parameters for separating individual groups.
4 RESULTS
In this study, no pregnant woman with normal uter-
ine perfusion developed hypertensive pregnancy-
related disorders. In the period between the 18th and
the 26th weeks of gestation, in the abnormal uterine
perfusion group, the following differences were
found by variability analysis (Tables 2 – 3). In HRV
analysis, both the mean and the standard deviation
were unchanged, while some frequency domain pa-
rameters showed significant differences. Interest-
ingly, all significant parameters point to very low
frequencies below 0.04 Hz.
As in the HRV analysis, the mean values and the
standard deviation were unchanged also in SBPV
and DBPV. On the other hand, especially in DBP,
time domain and frequency domain parameters as
well as non-linear parameters showed significant
differences. The most prominent difference was
found to be the ‘high frequency’ in diastolic blood
pressure.
Table 2: HRV analysis in the 18th – 26th weeks of gesta-
tion in pregnant women with abnormal Doppler findings
developing either PE or NoPE after the 30th week of ges-
tation.
NoPE PE P value
meanNN 759.8±104.4 755.3±113.4 n.s.
sdNN 44.7±16.2 49.0±18.1 n.s.
VLF 10.18±11.45 13.46±11.46 0.013
VLF/P 0.35±0.11 0.44±0.10 0.005
ULF/P 0.21±0.15 0.14±0.08 0.029
cross 1/f 1.79±1.62 3.09±1.48 <0.001
slope 1/f -0.77±0.56 -0.38±0.51 0.002
Table 3: Analysis of systolic and diastolic blood pressure
variability in the 18th – 26th weeks of gestation in preg-
nant women with abnormal Doppler findings developing
either PE or NoPE after the 30th week of gestation.
SBPV NoPE PE P value
meanNN 122.4±16.1 128.6±13.2 n.s.
sdNN 7.81± 2.03 8.36±1.86 n.s.
Rmssd 2.66±0.56 3.02±0.81 n.s.
pNN2 0.27±0.11 0.34±0.13 n.s.
LF 0.14±0.09 0.16±0.07 n.s.
HF 0.03±0.02 0.05±0.03 0.021
WPSUM02 0.46±0.16 0.43±0.11 n.s.
PLVAR2 0.031±0.045 0.014±.0171 n.s.
DBPV NoPE PE P value
meanNN 68.0±11.2 72.9±9.0 n.s.
sdNN 4.15±1.07 4.74±1.43 n.s.
Rmssd 1.89±0.33 2.18±0.59 0.033
pNN2 0.13±0.06 0.20±0.11 0.012
LF 0.05±0.03 0.07±0.04 0.011
HF 0.01±0.01 0.02±0.01 0.002
WPSUM02 0.47±0.14 0.41±0.13 0.049
PLVAR2 0.110±0.083 0.080±0.114 0.004
ANALYSIS OF HEART RATE AND BLOOD PRESSURE VARIABILITY IN PREGNANCY - New Method for the
Prediction of Preeclampsia
51
Also BR regulation as characterized by DSM
showed differences in pregnant women developing
PE compared to women without PE (Table 4).
Analysis reveals that the number of rises in SBP
potentially initiating BR increases significantly in
PE.
Table 4: Baroreflex analysis by the dual sequence tech-
nique in the 18th – 26th weeks of gestation in pregnant
women with abnormal Doppler findings developing either
PE or NoPE after the 30th week of gestation.
Bradycardic BR Regulation
Parameters NoPE PE P
No. of SBP
ramps
458.6±94.1 528.1±128.5 0.005
No. of SBP
ramps [%]
18.5±2.6 21.1±4.0 <0.001
BR time delay
[beats]
1.7±0.4 1.8±0.3 n.s.
No. of slopes
between 4-6
ms/mm Hg
35.4±13.6 46.6±22.2 0.019
No. of slopes
between 3-5
ms/mm Hg
36.5±15.2 49.1±20.4 0.004
No. of slopes
between 5-7
ms/mm Hg
32.2±12.3 41.1±19.2 n.s.
Total No. of BR
slopes
173.9±50.0 216.7±77.9 0.009
average BR slope
[ms/mm Hg]
13.3±5.6 13.2±5.6 n.s.
BR Activation
[%]
38.3±8.7 41.3±10.9 n.s.
Tachycardic BR Regulation
Parameters NoPE PE P
No. of SBP
ramps
464.9±106.3 527.0±97.3 0.008
No. of SBP
ramps [%]
18.8±3.4 21.2±2.7 0.005
BR time delay
[beats]
1.5±0.3 1.7±0.5 0.029
No. of slopes
between 4-6
ms/mm Hg
41.9±19.3 60.6±20.6 <0.001
No. of slopes
between 3-5
ms/mm Hg
47.0±22.7 65.3±24.8 0.003
No. of slopes
between 5-7
ms/mm Hg
38.4±17.4 50.2±17.6 0.004
Total No. of BR
slopes
200.0±59.1 242.0±64.6 0.005
average BR slope
[ms/mm Hg]
12.9±5.6 12.2±6.1 n.s.
BR Activation
[%]
43.5±9.4 46.5±11.5 n.s.
Nevertheless, BR per se does not change in its
response to activation and mean rise. Also, the total
number of BR fluctuations and the number in the
low regulation segment (between 3 and 7 ms/mm
Hg) is elevated in PE. In the tachycardic range, BR
regulation also starts later in the PE group than in
the NoPE group.
The application of stepwise discriminant analysis
selected the following three parameters as the best
parameters predicting PE: HRV: VLF/P, DBP: HF,
BR: number of tachycardic slopes between 4-6
ms/mm Hg. A sensitivity and a specificity of 87.5
%, a positive predictive accuracy of 70.0 % were
found with a negative predicted accuracy of 95 %.
Interestingly, these are the same parameters which
had been found in our previous study (Walther,
2006).
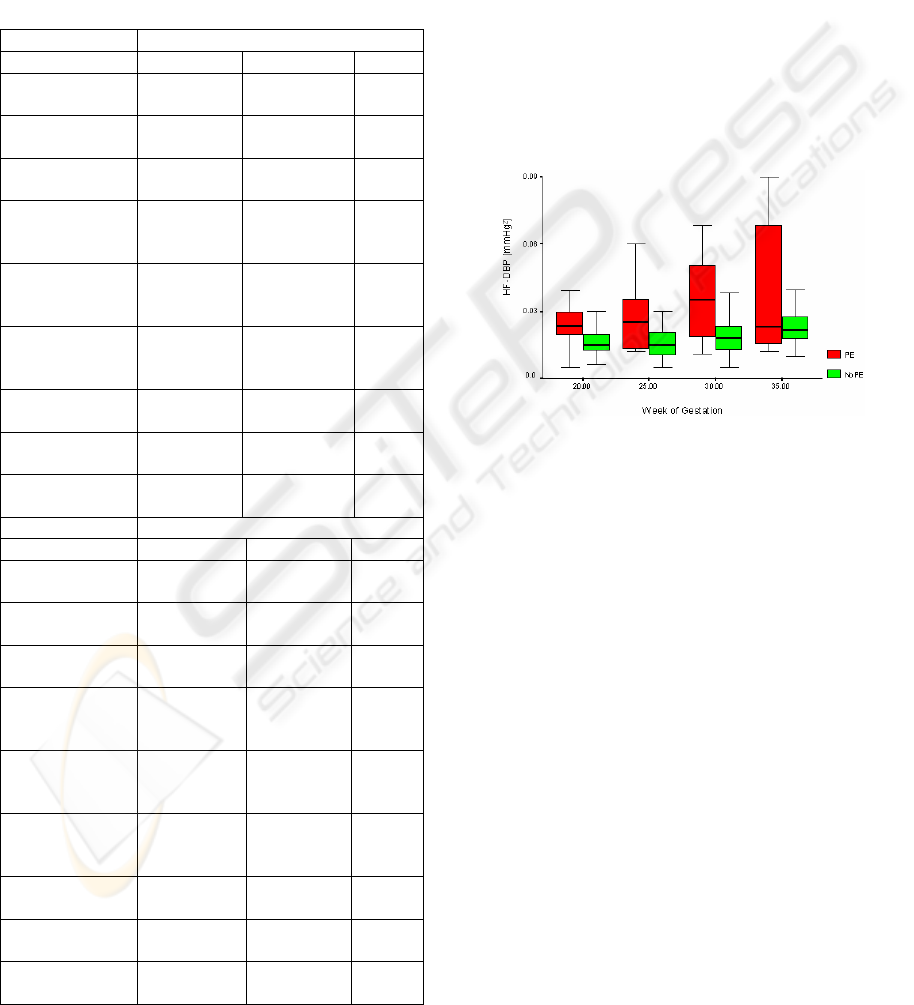
Figure 2: Example of the change in variability measure
during pregnancy in the case of PE genesis. The increase
in the high-frequency component of diastolic blood pres-
sure is shown.
Figure 2 shows an example of the change over
time of variability measure in the course of preg-
nancy in patients developing PE as against pregnant
women without this development.
5 DISCUSSION
Early prediction of PE is one of the most important
challenge in obstetrics. Establishing a simple test
manageable under clinical conditions is a major
challenge. Doppler sonography or combined with
humoral or endothelial parameters either attained
low sensitivity / sufficient sensitivity or a low posi-
tive predictive value and are very costly or even in-
vasive.
Although BRV, BPV, and BRS have been estab-
lished in cardiology for risk stratification, their use
for early detection of hypertensive pregnancy disor-
ders is still very rare. As various cardiovascular dis-
BIOSIGNALS 2008 - International Conference on Bio-inspired Systems and Signal Processing
52

eases can be predicted by a gradual change in car-
diovascular regulation, the approach used in this
study also was to cover the genesis of PE. This study
is aimed at investigating alterations in HRV, BPV
and BRS to predict the sudden steep increase of
blood pressure which is caused by PE.
With an incidence of 3 – 5 % of all pregnancies
in the Western population, pathological uterine per-
fusion in the second trimester is known as an indi-
rect sign of inadequate trophoblasts. The positive
predicted value of this study, however, is only
around 30 %. In an earlier study of the variability
analysis of PE, the authors were able to show that
the use of only the variability parameter was able to
raise to 50 % the positive predictive value, which
does represent the highest possible PPA, but is not
yet sufficient for clinical routine screening. Except
for that, the three variability parameters described
above attained the highest PPA of any one method
of examination which, in addition, is independent of
humoral factors and other single clinical parameters.
This study has shown that the combination with
Doppler sonography of uterine arteries confirms the
highest possible PPA as compared to all published
non-invasive trials (Walther, 2006). The PPA of
approx. 70% is indicative of the clinical relevance of
Doppler examination combined with variability
analysis. However, due to the exploratory design of
this study, these parameters need to be validated
prospectively - especially in connection with hu-
moral factors. Anyway, the same three parameters,
which had been found in our previous study
(Walther, 2006), were selected in the discriminant
analysis. These parameters obtained nearly the same
classification results – which is already a first vali-
dation.
On the basis of the variability measures deter-
mined, the following interpretation could be possible
in the course of pregnancy for the genesis of PE in a
cardiovascular model (see Figure 3).
Figure 3: Connections between the heart rate, NNI, the
cardiac output, CO, and the blood pressure, BP, in
autonomous regulation of the cardiovascular system,
modified from [Saul, 1991)
In Figure 3 a simplified model of the cardiovascular
circulatory system is presented. Mediated by the
electromechanical coupling, the NNIs initiate a car-
diac output (CO) of the heart. The resulting blood
pressure in the periphery is influenced by this CO
and by the vascular system. In the feedback the
NNIs are influenced by the BRS via sympathetic and
parasympathetic activation. Additionally, the total
system is superimposed by mechanical and neuronal
influences of the respiration.
Our analyses point to a more vascular disorder as
the cause of the cardiovascular alteration. Obvi-
ously, the heart plays only a secondary role. Appar-
ently, there is an early pathological modification in
vessel behavior measurable already in the Doppler
sonogram. However, this parameter obtains a low
PPA only. This incipient endothelial dysfunction,
which is still very weak in the 18th – 26th weeks of
gestation, has no influence on the mean values of
diastole, systole, and heart rate. On the other hand,
especially the variability of blood pressure seems to
change as a consequence of continuing pathological
arterial stiffness in so far as the minor fluctuations in
blood pressure become more pronounced as a result
of the decreasing windkessel function of vessels.
This can be represented by the changes in blood
pressure variability (see parameters: SBPV: ‘HF’,
DBP: ‘Rmssd’, ‘pNN2’, ‘LF’, ‘HF’, ‘WPSUM02’,
‘PLVAR2’, BRS: ‘No. of SBP ramps’, ‘No. of SBP
ramps [%]’). The baroreflex reacts more strongly to
this change, i.e. it reacts more frequently to these
slight, but more frequent blood pressure stimuli (see
BR parameters: ‘No. of slopes between 4-6 ms/mm
Hg’, ‘No. of slopes between 3-5 ms/mm Hg’, ‘No.
of slopes between 5-7 ms/mm Hg’, ‘Total No. of BR
slopes’). The baroreflex function (i.e. the intensity of
response of the BR) seems to be completely un-
changed (see BR parameters: ‘average BR slope’,
‘BR activation’). The changes in BPV and BR are
continued in HRV either as a consequence of the
counter regulation of the heart rate responding to
blood pressure fluctuations, or due to other regula-
tory influences modulated by respiratory sinus ar-
rhythmia (see HRV parameters: ‘VLF’, ‘VLF/P’,
‘ULF/P’, ‘cross 1/f’, ‘slope 1/f’). Thus, for example,
the increase in diastolic high frequency, which is
modulated by respiratory sinus arrhythmia, may re-
flect early pathological arterial stiffness. This leads
to the undamped, respiration-induced pulse-wave
oscillations detected by our method. This is congru-
ent with the hypothesis that patients later developing
PE are characterized by early pathological modifica-
tions in vessel behavior. The physiological conclu-
sion could be drawn that variability analysis meas-
ANALYSIS OF HEART RATE AND BLOOD PRESSURE VARIABILITY IN PREGNANCY - New Method for the
Prediction of Preeclampsia
53

ures the consequences to blood pressure, to the in-
teraction between blood pressure and heart rate, and
to the heart rate of incipient endothelial dysfunction,
which is not thought to be sufficient to predict PE
solely on the basis of the Doppler sonogram.
In a previous methodological study the applica-
bility of different BR methods was tested (Vanoli,
1994, Laude, 2004). All described methods estimate
only the average BRS slope. The DSM however, is
able to obtain additional insights into the cardiovas-
cular regulation. In this study, ‘average slope’ is not
altered, however more sophisticated DSM parame-
ters found high significant differences. So we con-
clude, that the parameter ‘average slope’ is not suffi-
cient for PE prediction. The best discrimination had
been obtained by the combination of non-linear BR
parameters and linear HRV und BPV parameters.
In summary, it can be said that examination of
uterine perfusion combined with the characterization
of cardiovascular regulation in the second trimester
has achieved the most accurate prediction of PE sev-
eral weeks before its clinical manifestation so far. In
this application, the biosignal analysis emphasizes
its importance as a non-invasive, cheap and univer-
sal diagnostic approach. This opens up potential
therapeutic strategies for suppressing pathophysi-
ological symptoms of the disease to further decrease
maternal and neonatal morbidity and mortality rates.
REFERENCES
Chien, P.F., Arnott, N., Gordon, A., Owen, P., Khan, K.S.
2000, How useful is uterine artery Doppler flow
velocimetry in the prediction of pre-eclampsia, intrau-
terine growth retardation and perinatal death? An
overview. Brit J Obstet Gynaecol 107:196-208.
Benedetto, C., Valensise, H., Marozio, L., Giarola, M.,
Massobrio, M., Romanini, C. 1998, A two-stage
screening test for pregnancy-induced hypertension and
preeclampsia. Obstet Gynecol 92:1005-1011.
La Rovere, M.T., Pinna, G.D., Hohnloser, S.H., Marcus,
F.I., Mortasa, A., Nohora, R., Bigger, T., Camm, A.J.,
Schwartz, P.J. 2001, Baroreflex sensitivity and heart
rate variability in the identification of patients at risk
for life-threatening arrhythmias. Circulation 103:
2072–2077.
Walther, T., Wessel, N., Baumert, M., Stepan, H., Voss,
A., Faber, R. 2005, Longitudinal analysis of heart rate
variability in chronic hypertensive pregnancy. Hyper-
tension Res 28:113-118.
Hermida, R.C., Ayala, D.E., Mojon, A., Fernandez, J.R.,
Silva, I., Ucieda, R., Iglesias, M. 1998, Blood pressure
excess for the early identification of gestational hyper-
tension and preeclampsia. Hypertension 31:83-89.
Faber, R., Baumert, M., Stepan, H., Wessel, N., Voss, A.,
Walther, T. 2004, Baroreflex sensitivity, heart rate and
blood pressure variability in hypertensive pregnancy
disorders. J Hum Hypertens 18:707-712.
Walther, T., Wessel, N., Malberg, H., Voss, A., Stepan,
H., Faber, R. 2006, A combined technique for predict-
ing pre-eclampsia: concurrent measurement of uterine
perfusion and analysis of heart rate and blood pressure
variability. Journal of Hypertension 24:747-750.
Kleiger, R.E., Miller, J.P., Bigger, T., Moss, A.J. 1987,
Decreased heart rate variability and its association
with increased mortality after acute myocardial infarc-
tion. Am J Cardiol 59:256–262.
Lippman, N., Stein, K.M., Lerman, B.B. 1994, Compari-
son of methods for removal of ectopy in measurement
of heart rate variability. Am J Physiol 267:H411-418.
Wessel, N., Voss, A., Malberg, H., Ziemann, Ch., Voss,
H.U., Schirdewan, A., Meyerfeld, U., Kurths, J. 2000
Nonlinear analysis of complex phenomena in cardi-
ological data. Herzschr Elektrophys 11: 159-173
Task Force of the European Society of Cardiology and the
North American Society of Pacing and Electrophysi-
ology. 1996, Heart rate variability: standards of meas-
urement, physiological interpretation and clinical use.
Circulation 93:1043-1065.
Voss, A., Kurths, J., Kleiner, H.J., Witt, A., Wessel, N.,
Saparin, P., Osterziel, K.J., Schurath, R., Dietz, R.
1996, The application of methods of non-linear dy-
namics for the improved and predictive recognition of
patients threatened by sudden cardiac death. Cardio-
vasc Res 31:419–433.
Voss, A., Hnatkova, K., Wessel, N., Kurths, J., Sander, A.,
Schirdewan, A., Camm, A.J., Malik, M. 1998, Multi-
parametric analysis of heart rate variability used for
risk stratification among survivors of acute myocardial
infarction. Pacing Clin Electrophysiol 21(1 Pt 2):186–
192.
Akselrod, S., Gordon, D., Ubel, F.A., Shannon, D.C.,
Barger, A.C., Cohen, R.J. 1981, Power spectrum
analysis of heart rate fluctuation: A quantitative probe
of beat-to-beat cardiovascular control. Science
213:220–222.
Malliani, A., Pagani, M., Lombardi, F., Cerutti, S. Cardio-
vascular neural regulation explored in the frequency
domain. Circulation1991;84:482–92.
Bigger Jr, J.T., Fleiss, J.L., Steinman, R.C., Rolnitzky,
L.M., Kleiger, R.E., Rottman, J.N. 1992, Frequency
domain measures of heart period variability and mor-
tality after myocardial infarction. Circulation 85:164–
71.
La Rovere, M.T., Bigger, J.T., Marcus, F.I., Mortara, A.,
Schwartz, P.J. 1998, Baroreflex sensitivity and heart-
rate variability in prediction of total cardiac mortality
after myocardial infarction. atrami (autonomic tone
and reflexes after myocardial infarction) investigators.
Lancet 351(9101):478–484.
Vanoli, E., Adamson, P.B. 1994, Baroreflex sensitivity:
methods, mechanisms, and prognostic value. Pacing
Clin Electrophysiol 17(3 Pt 2):434–445.
BIOSIGNALS 2008 - International Conference on Bio-inspired Systems and Signal Processing
54

Cohen, I.M., O’Connor, D.T., Preston, R.A., Stone, R.A.
1981, Long-term clonidine effects on autonomic func-
tion in essential hypertensive man. Eur J Clin Phar-
macol 19(1):25–32.
Di Rienzo, M., Bertinieri, G., Mancia, G., Pedotti, A.
1985, A new method for evaluating the baroreflex role
by a joint pattern analysis of pulse interval and systolic
blood pressure series. Med Biol Eng Comput 23(suppl
I):313-314.
Malberg, H., Wessel, N., Schirdewan, A., Hasart, A., Os-
terziel, K.J., Griessbach, G., Voss, A. 2002, Advanced
analysis of the spontaneous baroreflex sensitivity us-
ing the Dual Sequence Method. Clinical Science 102:
465-473.
Saul, J.P., Berger, R.D., Albrecht, P., Stein, S.P., Chen,
M.H., Cohen, R.J. 1991, Transfer function analysis of
the circulation: unique insights into cardiovascular
regulation. Am J Physiol 261: H1231-H1245.
Laude, D., Elghizi, J.L., Girard, A., Bellard, E., Bouhaddi,
M., Castiglioni, P., Cerutti, C., Cividjan, A., Di Ri-
enzo, M., Fortrat, J.O., Janssen, B., Karemaker, J.M.,
Lefthériotis, G., Parati, G., Persson, P.B., Porta, A.,
Quintin, L., Regnerd, J., Rüdiger, H., Stauss, H.M.
2004, Comparison of various techniques to estimate
spontaneous baroreflex sensitivity (the EuroBaVar
study). Am J Physiol Regul Integr Comp Physiol, 286:
R226-231
ANALYSIS OF HEART RATE AND BLOOD PRESSURE VARIABILITY IN PREGNANCY - New Method for the
Prediction of Preeclampsia
55
