
WAVELET-BASED REAL-TIME ECG PROCESSING FOR A
WEARABLE MONITORING SYSTEM
S. Zaunseder and W.-J. Fischer
Lifetronics, Fraunhofer Institute for Photonic Microsystems, Maria-Reiche-Strasse 2, 01109 Dresden, Germany
R. Poll and M. Rabenau
Institute of Biomedical Engineering, Dresden University of Technology, Dresden, Germany
Keywords: ECG processing, wavelet transform, shift-invariance, quadratic spline, real time, ambulatory monitoring,
wearable, ultra-low power microcontroller, MIT-BIH Arrhythmia Database.
Abstract: This paper presents a wavelet-based signal processing method developed for an ambulatory ECG
monitoring system. The monitoring system comprises modern trends in ambulatory ECG monitoring like
integration of hardware in clothing, the use of low-power components and wireless data transmission via
Bluetooth. The signal processing is located close to the sensor, thus allowing increased variability for the
subsequent data handling (i.e. data transmission in case of detected abnormalities). Due to the very limited
computational resources (an ultra-low power microncontroller (µC)) and the relatively high demands upon
signal processing, the need arises for a method which meets the special demands of the ambulatory
application. Therefore, we developed a wavelet-based method for detecting QRS complexes, especially
adapted to the real-time requirements. The novel idea of our approach was to incorporate information
gained from a lower scale directly into the threshold applied for QRS detection in a higher scale. To date, all
tests proved a very low computational load while simultaneously preserving the reliability of the analysis
(Se=99,74%, +P=99,85% using the entire MIT-BIH Arrhythmia Database), thus pointing out the
possibilities of real-time signal processing under ultra-low power conditions.
1 INTRODUCTION
Analysis of the electrocardiogram (ECG) is used for
diagnosis in a wide range of cardiac diseases.
Anomalous changes may indicate arising coronary
diseases in an early stage. Further on, acute life-
threatening situations can be observed in the ECG
immediately after their incidence. Increasingly
powerful hardware today allows ambulatory long-
time monitoring of the ECG. Such recordings are
especially useful to detect sporadically occurring
events, which are not perceptible in short-time
readings. Also, the online observation of patients
with increased risk of cardiac breakdowns, due to
preliminarily diseases or due to special physiological
stress, is feasible. The available possibilities make
the long-time ECG a very powerful tool for
improved medical care. The Fraunhofer Institute for
Photonic Microsystems (IPMS) focuses on the
development of a complete system for ambulatory
ECG monitoring. The signal processing is done in
close proximity to the sensor to allow a high
flexibility in further data handling. In particular,
wireless data transmission can be reduced to
situations of imminent risks, increasing the
efficiency of the system to allow the long-time
application (up to 7 days) of the system.
Due to the very limited resources of the
employed ultra-low power µC and the often low
signal quality, the demands on the signal processing
are very high. The literature delivers a huge number
of essays concerned with ECG processing:
derivative based methods, digital filters, different
transforms including the wavelet transform and
neural networks, to name a few (Köhler, 2002). We
designed a wavelet-based processing method
especially suited for its real-time application. This
paper describes the method and gives detailed
information on the performance concerning
detection rates as well as computational load.
255
Zaunseder S., Fischer W., Poll R. and Rabenau M. (2008).
WAVELET-BASED REAL-TIME ECG PROCESSING FOR A WEARABLE MONITORING SYSTEM.
In Proceedings of the First International Conference on Bio-inspired Systems and Signal Processing, pages 255-260
DOI: 10.5220/0001065002550260
Copyright
c
SciTePress

The paper is organized as follows: Section 2
gives an introduction into the monitoring system and
describes our algorithm based on considerations on
the wavelet transform and its implementation in
detail. Experimental results are reported in Section 3
and discussed in Section 4. Finally, Section 5
contains conclusions and some considerations
concerning the future development of the system.
2 MATERIALS AND METHOD
2.1 Hardware
As carrier of the monitoring system we used a smart
shirt. We integrated four electrodes to record a three-
channel ECG based on Einthoven. Further on, a
partially flexible printed circuit board was included.
The board contains the hardware for analog
preprocessing and further data handling. Sampling
of the ECG is done at 1000 Hz and 12-Bit
resolution. Data handling may include storage of
data on a memory card and, optionally, the wireless
data transmission via Bluetooth to a PDA. The PDA
serves as gateway to communicate with medical
personnel via internet. Signal processing done close
to the sensor offers the possibility of wireless data
transmission limited to situations of imminent risks.
In this way, the actual data handling (storage and/or
transmission) depends upon the outcome of the just-
performed signal processing, thus rendering the
overall system more flexible and improving its
efficiency. All electronics as well as the signal
processing is controlled by the ultra-low power µC
MSP430F1611. Due to its low power consumption,
such a controller is very suited for ambulatory
applications. Of course, the low consumption
accounts for a likewise low maximum clock
frequency of 8 MHz. To handle this major
drawback, an adequate signal processing method
was developed. The underlying ideas, the
implementation and performance results of the
developed algorithm will be described next.
2.2 Signal Processing Method
2.2.1 Wavelet Basics
The wavelet transform (WT) decomposes a signal in
scaled and translated versions ψ
a,t
(τ) of a basis
function called mother wavelet ψ(τ). The derivates
of the mother wavelet are given by
() ()
,
1
with , 1
at
t
at
a
a
τ
ψτ ψ
+
−
⎛⎞
=∈∈
⎜⎟
⎝⎠
RR
where a is a scale factor which is a measure of the
current width of the applied wavelet and t is the
translation parameter which describes the position of
the wavelet in the time domain. The wavelet
transform X(a,t) results from the inner product of the
signal and the scaled and translated wavelet
()
,
1
(,) , () 2
at
t
Xat x x d
a
a
τ
ψτψτ
+∞
∗
−∞
−
⎛⎞
==
⎜⎟
⎝⎠
∫
The resulting coefficients can be seen as a measure
for the similarity of the examined signal segment
specified by t, and a wavelet of varying width
specified by a. The transformation of (2) to the
frequency domain yields
() ()
*
(,) (3)
2
jt
a
Xat X e d
ω
ωω ω
π
+∞
−∞
=Ψ
∫
where X(ω) and Ψ(ω) are the Fourier transforms of
the signal and the wavelet, respectively. From (3) it
can be seen that decomposing a signal by the WT is
equivalent to the application of a filter bank. The
bandwidth of each pass-band filter increases with
higher center frequencies.
2.2.2 Calculated Transform
There are three usual ways to compute the wavelet
transform: the so-called continuous WT (CWT), the
dyadic WT (D
Y
WT) and the discrete WT (DWT).
The schemes differ in the required computational
resources, the resulting degree of redundancy and in
some properties of the results like shift-invariance.
In the D
Y
WT the scale a is sampled along a dyadic
sampled grid while the translation remains scale
independent. Thus, applying the D
Y
WT, the property
of shift-invariance can be maintained while the
degree of redundancy, and therefore the
computational load, is reduced in comparison to the
CWT. For the D
Y
WT the definition of ψ
a,t
(τ)
becomes
() ()
2,
1
with , 4
2
2
m
m
t
m
t
mt
τ
ψτ ψ
+
−
⎛⎞
=∈∈
⎜⎟
⎝⎠
R
When using expressions like “scale 4”, we will refer
to the scale a=2
m
=2
4
.
Fast computations of the DWT are done through
the Mallat algorithm. In analogy to the “algorithme a
trous” (Holschneider, 1989), it constitutes a
recursive algorithm allowing the fast calculation of
BIOSIGNALS 2008 - International Conference on Bio-inspired Systems and Signal Processing
256
the D
Y
WT. The highly advantageous property of
shift invariance justifies an increased computational
effort, rendering the use of the D
Y
WT optimal for
our intended realization.
A wide range of different wavelets have been
employed in the past for ECG processing. Referring
to the choice of an adequate wavelet, the statements
found in the literature disagree. For instance, Dinh et
al. conclude that the cubic spline wavelet is best
suited for the detection of QRS complexes (Dinh,
2001). Differing from this, Li et al. do not perceive
substantial differences in the performance of the
detection by using a spline of higher order than the
quadratic spline wavelet (Li, 1995). The possible
usage of different wavelets allows the utilization of
other criterions searching for an adequate one. As
our application aims at the real-time processing
under extremely limited resources, the compactness
of the chosen wavelet in the time domain is a crucial
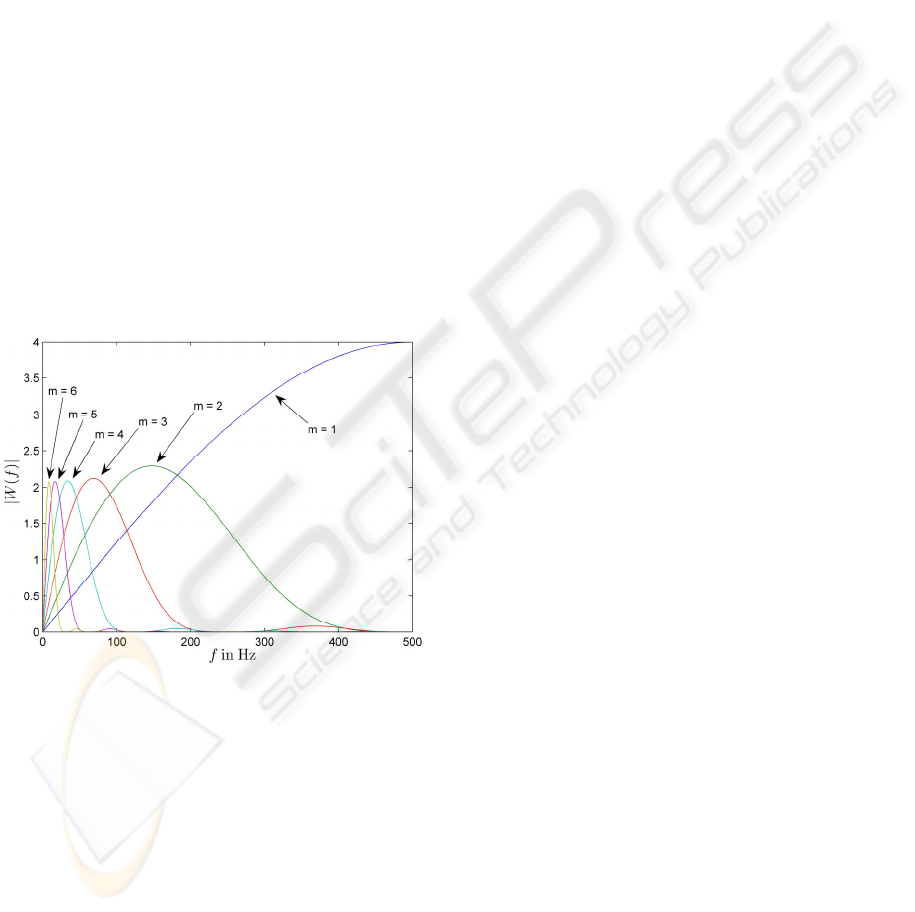
demand. The quadratic spline wavelet originally
introduced by Mallat et al. (Mallat, 1992) meets this
demand and is used in our implementation. In Figure
1, the transfer functions realized by the quadratic
spline wavelet are shown.
Figure 1: Transfer functions realized by the quadratic
spline wavelet and a sampling frequency of 1000 Hz.
2.2.3 Underlying Idea of the Implemented
Method
In the current stage of development we realized a
QRS detector. The most commonly used principle of
wavelet-based QRS detectors (employing the
quadratic spline wavelet) is to search for modulus
maximum pairs (MMP) (combination of local
extreme values exceeding a threshold). To obtain a
good performance the search typically is carried out
across all scales, at least up to the scale assumed as
most significant in regard to the main energy
portions contained in QRS complexes. (Li, 1995),
(Martinez, 2004)
An obviously possible solution to reduce the
computational effort is not to incorporate all scales,
but to do the detection based on only one scale. Such
an approach does not take advantage of the multi-
scale decomposition provided by the WT, but it
constitutes a viable way to detect QRS complexes.
Employing only one scale of the WT is similar to the
usage of a single bandpass-filter. On the filtered
signal the typical method of grouping extrema to
MMP and assigning them to QRS complexes can be
applied. In Section 3, some example results (testing1
and testing2, see Table 1) using this methodology
are given. Different rules to control the value of the
thresholds were employed. In both cases, adaptive
thresholds (see Appendix for details on the
adaptation) were applied. In testing2 the threshold is
generally endued with an offset to lower the
resulting value compared to the threshold in
testing1. As expected, the performance of the
methods varies in sensitivity and positive
predictivity. Both methods offer, depending on the
data set as well as on the observed signal portion
within one data set, sections of varying detection
quality. With regard to this, a method to influence
automatically the valid threshold becomes a very
interesting option. Such a procedure aims to take the
advantages of a generalized lower or higher
threshold according to the current signal state.
Our method detects QRS complexes in scale 5.
Based on the number of threshold crossings within a
sliding window in the scale 4 the threshold in scale 5
is controlled.
2.2.4 Structure of the Algorithm
The algorithm can be divided in three steps:
(1) Search for MMP and extract “relevant threshold
crossings” in scale 4.
(2)
Search for MMP in the scale 5 incorporating
the information gained from the corresponding
number of threshold crossings detected in the
scale 4.
(3)
Classification of MMP found in scale 5 as QRS
complexes using a simplified regularity
analysis
Step (1): With every incoming sample the search
for local extrema, aimed at the grouping of a MMP,
is continued. Different combinations of extrema can
constitute a MMP. To detect the extrema, online-
adaptive thresholds ε
±
4
are used. An adaptation of
the thresholds is caused by the successful grouping
of a MMP (see Appendix for details on the
WAVELET-BASED REAL-TIME ECG PROCESSING FOR A WEARABLE MONITORING SYSTEM
257
adaptation). Based on ε
±
4
additional thresholds ε
±
cross
are created to excerpt all “relevant threshold
crossings”. “Relevant threshold crossings” refer to
local extrema crossing the corresponding threshold
ε
±
cross
. This registration is not carried out in order to
group the extrema as MMP, but to obtain a measure
of the signal quality by counting the number of
crossings N
cross
within a window W
cross
of 500
samples. Note that there is a major difference
between the extrema searched for MMP grouping
and the extrema detected using ε
±
cross
, as the absolute
value of ε
±
cross
is generally smaller or equal than ε
4
±
and found extrema are not discarded until their
position has left the range of the sliding window.
Step (2): MMP are searched in scale 5 using the
same routine as in scale 4. Also online adaptive
thresholds ε
±
5
are existent. Differing from scale 4,
for the MMP search in scale 5 not directly the online
adaptive thresholds ε
±
5
are used, but a threshold
changed by a correction factor κ. κ varies depending
on the number of registered threshold crossings. The
actual number of zero crossings N
cross
can be
interpreted as a measure for the degree of higher
frequency noise or artifacts. According to this, κ
converts the information contained in N
cross
to a
threshold operation in scale 5, referred as ε
±
5
+ κ
(note that this is only a symbolic notation). In
general, for noisy segments the threshold is
increased whereas a reduction in sections of good
signal quality is performed. Depending on the value
of N
cross
, the modification of threshold can be up to
±37.5% of the actual ε
±
5
.
It is important that the
threshold be changed only for the search of local
extrema, otherwise ε
±
5
doesn’t suffer any changes.
To allow the zero crossing window to be placed
symmetrically around the scale 5 coefficient under
observation, the scale 5 coefficients have to been
delayed by 250 samples (taking into account the half
window size), plus the delay introduced by the
recursive online calculation of the WT.
Step (3): If a MMP is detected in scale 5 and a
corresponding MMP in scale 4 is existent, a
simplified regularity analysis based only on the
amplitudes of the detected MMP is carried out. If no
corresponding MMP is present at scale 4, the MMP
of scale 5 is accepted as QRS without any regularity
analysis.
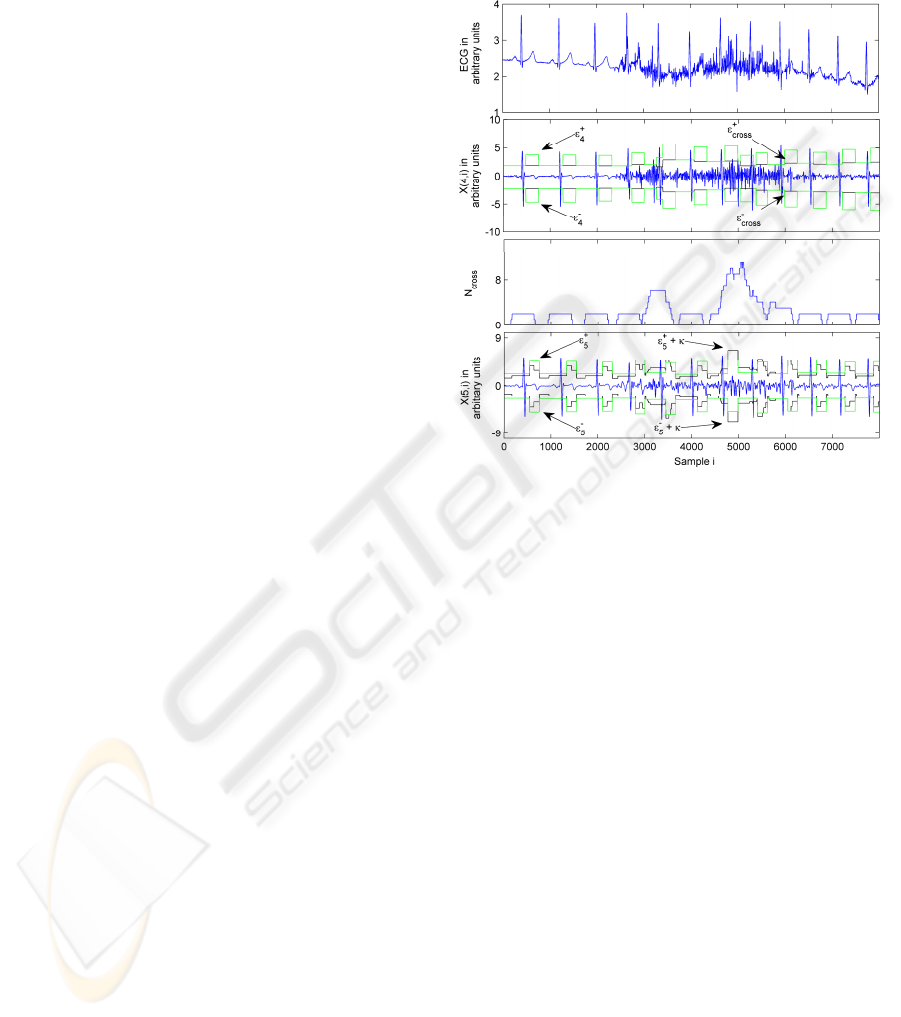
Figure 2 shows an example containing an ECG
segment, the corresponding scale 4 and scale 5
coefficients and the course of. Also showed is the
course of the threshold values ε
±
4
(bright), ε
±
cross
(dark), ε
±
5
(bright),
ε
±
5
+ κ (dark). The threshold
adaptation after detections and the general dynamics
of the correction factor are visible. N
cross
exhibits the
expected behaviour. An increase is visible during
noisy segments whereas during uncorrupted
segments only the QRS complexes have an influence
(resulting in an oscillation between 0 and 2 detected
crossings). ε
±
5
+ κ oscillates around ε
±
5
).
Figure 2: Example for the behavior of the algorithm.
2.2.5 Implementation
The algorithm was implemented in C. To minimize
the required computational effort three fundamental
concepts were incorporated in our implementation.
Simplicity of employed data types: the applied
µC is a 16-Bit controller. This renders the
application of 16 Bit fix-point operators very useful.
Incoming data is sampled with a 12-bit resolution.
16-Bit fix-point numbers were used for the recorded
ECG as well as for wavelet coefficients, scaling
coefficients and threshold values. Considering the
maximal values possibly appearing in the course of
the WT, a multiplication of incoming data by 4 is
possible. Therewith, the whole value range is
involved and the inaccuracies introduced by
rounding errors are reduced.
Simplicity of all employed operations: as
mentioned before, the usage of the quadratic spline
wavelet provides a low number of coefficients
(namely 4 low-pass coefficients and 2 high-pass
coefficients) thus fulfilling the first requirement on
an effective real-time processing. Furthermore, the
coefficients allow the calculation of the WT with
only bit-shifts and additions. Also the adaptation of
all threshold values was implemented by bit-
BIOSIGNALS 2008 - International Conference on Bio-inspired Systems and Signal Processing
258

manipulations. All remaining steps of the algorithm
are performed by logical instructions like
comparisons. These operations also are
characterized by their low computational load.
Avoidance of inappropriate processing methods:
to provide a uniformly low computational load,
often used undesirable steps as back-searchs were
excluded. The applied windowing operation, also an
improper medium for the real-time purpose, acts on
a window of 500 samples, introducing a delay of
250 ms only. All values to be updated in periodic
manner (for example the zero crossings within W
0
,
for which the removal or addition of crossings is
demanded due to the sliding window) are arranged
in circular buffers. This allows the algorithm to work
continuously on every incoming sample.
3 RESULTS
3.1 Detection Performance
Table 1 yields the results of the performance
evaluation accomplished under different conditions.
Using the MIT-BIH Arrhythmia Database, all beats
occurring beginning 5 minutes after the begin of the
records until 30 minutes have been evaluated. This
results in 90491 beats. As previously mentioned, the
example trials testing1 and testing2 were carried out
without any influence created by the usage of N
cross
.
The quantitative evaluation of the complete
method with own data (Table 1, evalOwnData)
yielded a sensitivity (Se) of 99.85 % and a positive
predictivity (+P) of 99.92 %. The annotation by a
health professional was used as reference. The
evaluation using the MIT-BIH Arrhythmia Database
(Table 1, evalMIT) yielded a sensitivity and positive
predictivity of 99,74 %, respectively 99,85 %. As
the algorithm was designed for data sampled at 1000
Hz, the data was upsampled. Due to the contained
frequency portions, the regularity analysis was
skipped as a similarly easy regularity analysis (like
accomplished for own data) no longer was possible.
Table 1: Performance of the QRS detector using different
test configurations.
Identifier of
the task
Number
of beats
Se +P
testing1 90941 99.31 %
99.80 %
testing2 90941 99,81 %
99,36 %
evalOwnData 8525 99,85 %
99,92 %
evalMIT 90941 99,74 %
99,85 %
Table 2: Required resources for signal processing.
Computational load (at 8 MHz)
Processing Step
required
cycles
required µs
Calculation of WT 900
112.5
Search for MMP 400
50
N
cross
maintanance 70
7.5
Over all <2000
<250
Table 3: Memory coverage of the implemented method.
Code Memory Data memory
<7900 byte <4000 byte
3.2 Computational Load
Table 2 contains an outline of the required resources.
Besides the overall amount of cycles, the equivalent
processing time and the number of cycles
concerning specific steps within the implemented
method are given. The algorithm acts without any
prefiltering of the signal and thus avoids additional
computations other than the calculation of the WT
and the subsequent feature extraction procedure. The
step “Search for MMP” refers to the search for
extremas and the grouping of detected combinations
of extrema to a MMP. According to the structure of
the algorithm, this step is called twice per input
sample, once for scale 4 and once for scale 5. The
whole detection procedure requires less than 250 µs
(2000 cycles), leaving computing power to manage
other functions.
Also of high interest considering the limited
resources of the ultra-low power µC is the memory
coverage. Table 3 shows the most important
characteristics, proving the adequacy of the
implemented method.
4 DISCUSSION
The evaluation of our method showed promising
results in terms of the required computational load
and the performance of the method. Note, that the
only difference between the methods used in
testing1 and evalMIT is the correction of the
threshold in scale 5, thus pointing out the
effectiveness of the algorithm. Compared to the
high-quality approaches of Li et al. (Li, 1995) and
Martinez et al. (Martinez, 2004) the reached
detection rates are slightly lower. However, a deeper
WAVELET-BASED REAL-TIME ECG PROCESSING FOR A WEARABLE MONITORING SYSTEM
259

insight to the methods reveals in both cases
strategies which are very impractical for a real-time
calculation. For instance, Li et al. work on 600
samples of the ECG each time instead of on every
incoming sample. Furthermore, two “real-time
unfriendly” techniques (in the original paper referred
to as “tactic 1” and “tactic 2”) to exclude or accept
detections based on foregoing and subsequent
detections with the benefit of hindsight were
incorporated. In turn, Martinez et al. incorporated in
the computation of their scale-dependent thresholds
the RMS calculated from 2
16
values of the respective
scale. The storage of that amount of data for one
scale would exceed the data memory of the
controller by a factor of 10. Taking this into account,
our realization seems to be very appropriate for the
application area. By incorporating the information
on the latest detected QRS complexes, the
performance of the method still can be slightly
increased. Nevertheless, to reach the detection
performance reported by Li et al. while maintaining
a similarly low computational load like provided by
our method seems to be very difficult.
In addition to the good results obtained by our
method, the implemented method exhibits a high
potential for future work. For instance, concerning
the QRS delineation as well as P and T waves
delineation, the already computed wavelet
coefficients can be used as basis.
5 CONCLUSIONS
We developed a method especially suited to perform
signal processing in close proximity to the sensor.
The proposed algorithm is adapted to best meet the
most important demands of the ambulatory
application, which are low computational load and
high reliability. Even for a sampling frequency of
1000 Hz the described method can be used on an
ultra-low power µC, leaving computing power for
other purposes. The physical proximity of the signal-
processing hardware to the sensor provides
increased flexibility for subsequent information
handling and, combined with an ultra-low power
architecture, is capable of significantly increasing
the runtime of an ambulatory monitoring system.
Future work will focus on further signal
processing steps. These steps may include detection
of P and T-waves as well as the evaluation of the
ST-segment. As it was shown by the literature this
can be done based on the wavelet transform as well.
The use of the wavelet coefficients for further signal
processing purposes renders the wavelet-based
method even more attractive for low-power
microsystems with reduced hardware complexity.
REFERENCES
Dinh, H.; Kumar, D.; Pah, N. & Burton, P.: 'Wavelets for
QRS detection', In Engineering in Medicine and
Biology Society, 2001. Proceedings of the 23rd
Annual International Conference of the IEEE, pp.
1883--1887.
Goldberger AL, Amaral LAN, Glass L, Hausdorff JM,
Ivanov PCh, Mark RG, Mietus JE, Moody GB, Peng
CK, Stanley HE. PhysioBank, PhysioToolkit, and
PhysioNet: Components of a New Research Resource
for Complex Physiologic Signals. Circulation
101(23):e215-e220 [Circulation Electronic Pages;
http://circ.ahajournals.org/cgi/content/full/101/23/e215
]; 2000 (June 13).
Holschneider, M.; Kronland-Martinez, R.; Morlet, J.
Tchamitchian, P.: 'A Real-Time Algorithm for Signal
Analysis with the Help of Wavelet Transform',
Wavelets, Time-Frequency Methods and Phase Space,
Springer Verlag, Berlin, 1989
Li, C.; Zheng, C. & Tai, C., 1995, 'Detection of ECG
characteristic points using wavelet transforms.', IEEE
Trans Biomed Eng 42(1), 21-28.
Köhler, B.; Hennig, C. & Orglmeister, R. The principles of
software QRS detection. IEEE engineering in medicine
and biology magazine : the quarterly magazine of the
Engineering in Medicine & Biology Society., 2002,
21, 42-57
Mallat, S. & Hwang, W. , 1992, 'Singularity detection and
processing with wavelets', IEEE Transactions on
Information Theory 38, 617-643.
Martinez, J. P.; Almeida, R.; Olmos, S.; Rocha, A. P. &
Laguna, P., 2004, 'A wavelet-based ECG delineator:
evaluation on standard databases.', IEEE Trans
Biomed Eng 51(4), 570-581.
APPENDIX
Rules for threshold adaptation after a detected MMP
(for lower thresholds ε
m
-
“max” is replaced with the
specific “min” values and ε
m
+
is replaced by ε
m
-
):
if max( (2 , )) 3*
0.375* max( (2 , )) 0.625*
else if max( (2 , )) 3*
0.5* max( (2 , )) 0.5*
else if max( (2 , )) 2*
0.75* max( (2 , )) 0.25*
else
1.125* max( (2 , ))
ε
ε
ε
ε
εε
ε
εε
ε
+
+
+
+
++
+
++
+
≥
=+
≥
=+
≥
=+
=
m
m m
m
mm
m
mm
m
m
m
m
m
m
m
m
Xi
Xi
Xi
Xi
Xi
Xi
Xi
400 ms after an adaptation (to avoid mistakes
introduced by T waves with higher frequency
portions) the threshold is lowered by 50%.
BIOSIGNALS 2008 - International Conference on Bio-inspired Systems and Signal Processing
260
