
BALLISTOCARDIOGRAPHIC ARTIFACT REMOVAL FROM
SIMULTANEOUS EEG/FMRI RECORDING BY MEANS OF
CANONICAL CORRELATION ANALYSIS
S. Assecondi, P. Van Hese, H. Hallez, Y. D’Asseler, I. Lemahieu
Department of Electronics and Information Systems, MEDISIP, Ghent University-IBBT-IBiTech
De Pintelaan 185, B-9000 Ghent, Belgium
A. M. Bianchi
Department of Biomedical Engineering, Polytechnic University, Milan, Italy
P. Boon
Laboratory of Clinical and Experimental Neurophysiology (LCEN),Department of Neurology
Ghent University Hospital, Ghent, Belgium
Keywords:
Electroencephalogram (EEG), Blind source separation (BSS), Canonical correlation analysis (CCA), Ballis-
tocardiographic artifact (BCG).
Abstract:
The electroencephalogram (EEG) is a standard technique to record and study the brain activity with a high tem-
poral resolution. Blood oxygenation level dependent functional magnetic resonance imaging (BOLD fMRI)
is a non-invasive imaging method that allows the localization of activated brain regions with a high spatial
resolution. The co-recording of these two complementary modalities can give new insights into how the brain
functions. However, the interaction between the strong electromagnetic field (3T) of the MR scanner and the
currents recorded by the electrodes placed on the scalp generates artifacts that obscure the EEG and diminish
its readability.
In this work we used canonical correlation analysis (CCA) in order to remove the ballistocardiographic artifact
(BCGa). CCA is applied to two consecutive windows in order to take into account both spatial and temporal
information. We showed that users can easily remove the artifact through a graphical user interface by adjust-
ing the number of components to be removed according to visual inspection of the signal, its power spectrum,
the cumulative explained variance and the correlation coefficients.
1 INTRODUCTION
The simultaneous registration of EEG and fMRI has
become a valuable tool for the understanding of the
functionalities of the brain during cognitive and be-
havioral studies. The good temporal resolution of the
EEG and the high spatial resolution of the fMRI of-
fer an insight into the brain dynamics not achievable
with any other non-invasive technique. However, the
presence of the strong magnetic field of the MR scan-
ner generates artifacts on the EEG, such as the bal-
listocardiographic artifact (BCGa), which obscure the
brain activity. The origin of the BCGa is still unclear
but it is believed to be related to blood flow in scalp
arteries leading to electrode movements.
Different methods have been suggested in litera-
ture in order to remove this artifact, all of them based
either on blind source separation (Niazy et al., 2005;
Ben´ar et al., 2003; Srivastava et al., 2005) or averag-
ing techniques (Allen et al., 1998). These methods
can be applied either to a time window containing all
the EEG channels, considering only spatial correla-
tion or independence, or to a window containing a de-
layed version of the same channel, taking into account
only temporal correlation. It should be noted, how-
ever, that BCGa is periodic and affects all the elec-
trode sites. Both periodicity and topographical sim-
ilarity of the BCGa can be exploited to identify the
source or sources responsible for the artifact.
In this work we propose a framework based on
canonical correlation analysis (CCA) to remove the
BCGa. The advantage of using CCA applied to two
consecutive windows is that the algorithm takes into
account both spatial and temporal information.
11
Assecondi S., Van Hese P., Hallez H., D’Asseler Y., Lemahieu I., M. Bianchi A. and Boon P. (2008).
BALLISTOCARDIOGRAPHIC ARTIFACT REMOVAL FROM SIMULTANEOUS EEG/FMRI RECORDING BY MEANS OF CANONICAL CORRELATION
ANALYSIS.
In Proceedings of the First International Conference on Bio-inspired Systems and Signal Processing, pages 11-16
DOI: 10.5220/0001061200110016
Copyright
c
SciTePress
2 MATERIALS AND METHOD
2.1 Data
The data consist of 12 fragments of EEG recorded
from an epileptic patient during fMRI. Information
about dataset are shown in table 1. In these data
BCGa were identified by visual inspection. The
electroencephalographic data were recorded using
an EEG/fMRI compatible equipment (BE-MRI
EBNeuro, Medtronic). The fMRI data were recorded
using a 3T MR scanner (Siemens TRIO). The
electrodes were positioned according to the 10-20
international system and an average reference was
used. The sampling rate was 4096 Hz in order
to allow removal of the gradient artifact using the
BE-MRI toolbox . After gradient artifact removal the
signal was then subsampled to 512 Hz and band-pass
filtered between 0.5 Hz and 40 Hz. No epileptic
activity was identified in the recording. The final
EEG segment considered consisted of 20 channels.
Table 1: Data description: NRC is the number of compo-
nents removed to clean the dataset, EV is the variance ex-
plained by the removed components, CORR is the lowest
correlation of the removed components. Mean value (mean)
and standard deviation (STD) are also shown.
dataset n. of BCG NRC EV CORR
setA1 18 6 0.89 0.97
setA2 19 5 0.84 0.98
setA3 18 5 0.85 0.98
setA4 18 5 0.84 0.98
setB1 17 6 0.88 0.97
setB2 14 5 0.84 0.98
setB3 17 6 0.87 0.96
setB4 18 6 0.87 0.97
setC1 16 5 0.84 0.98
setC2 16 6 0.87 0.96
setC3 15 6 0.87 0.97
setC4 18 6 0.88 0.97
mean 5.6 0.86 0.97
std 0.55 0.02 0.09
2.2 Blind Source Separation
Blind source separation (BSS) techniques aim at de-
composing the original signal into a set of compo-
nents or sources. Let X = [x
1
(t). . . x
M
(t)]
T
, t = 1. . . N
with N the number of samples, be a matrix containing
the time series recorded through M sensors. The sig-
nals can be expressed as follows:
X = A S (1)
where A is the (M × M) unknown mixing matrix and
S = [s
1
(t). . . s
M
(t)]
T
, t = 1. . . N is the matrix contain-
ing the time course of the sources.
BSS estimates the unmixing matrix W, in such a way
that the sources are maximally independent (Indepen-
dent component analysis) or uncorrelated (Principal
component analysis). The estimated sources
b
S can
then be recovered using the following formula:
b
S = W X (2)
2.3 Canonical Correlation Analysis
CCA (Hotelling, 1936) is a multivariate technique
that finds two sets of basis vectors, one in each signal
space, such that the correlation between the signals in
the new subspaces is maximized and the covariance
matrix is diagonal.
Consider two sets of zero-mean random vari-
ables X = [x
1
(t). . . x
M
(t)]
T
, t = 1. . . N and Y =
[y
1
(t). . . y
M
(t)]
T
, t = 1. . . N. We can then define two
linear combinations of x and y as follows:
U = Ω
T
X
X
V = Ω
T
Y
Y
(3)
U and V are called canonical variates and Ω
X
=
[ω
x
1
, . . . ω
x
M
]
T
and Ω
Y
= [ω
y
1
, . . . ω
y
M
]
T
are the re-
gression weights. In order to find the regression
weights, we maximize the correlation between the
two new variables with respect to Ω
X
, Ω
Y
. The corre-
lation can be expressed as follows:
ρ(Ω
X
, Ω
Y
) =
Ω
T
X
C
XY
Ω
Y
q
(Ω
T
X
C
XX
Ω
X
)(Ω
T
Y
C
YY
Ω
Y
)
(4)
where ρ is a matrix containing the correlations be-
tween X and Y and the covariance matrices C
XX
, C
YY
and C
XY
are estimated from the data.
2.3.1 Implementation of CCA
One possible implementation of CCA relies on the
computation of the principal angles between two or-
thogonal subspaces (Golub and Van Loan, 1996). Let
us consider
e
X = X
T
and
e
Y = Y
T
. First we compute
two orthogonal subspaces Q
e
X
and Q
e
Y
of the original
signal spaces:
e
X = Q
e
X
R
e
X
e
Y = Q
e
Y
R
e
Y
(5)
Next, we compute the singular value decomposition
of Q
T
e
X
Q
e
Y
:
Q
T
e
X
Q
e
Y
= ECF
T
(6)
BIOSIGNALS 2008 - International Conference on Bio-inspired Systems and Signal Processing
12
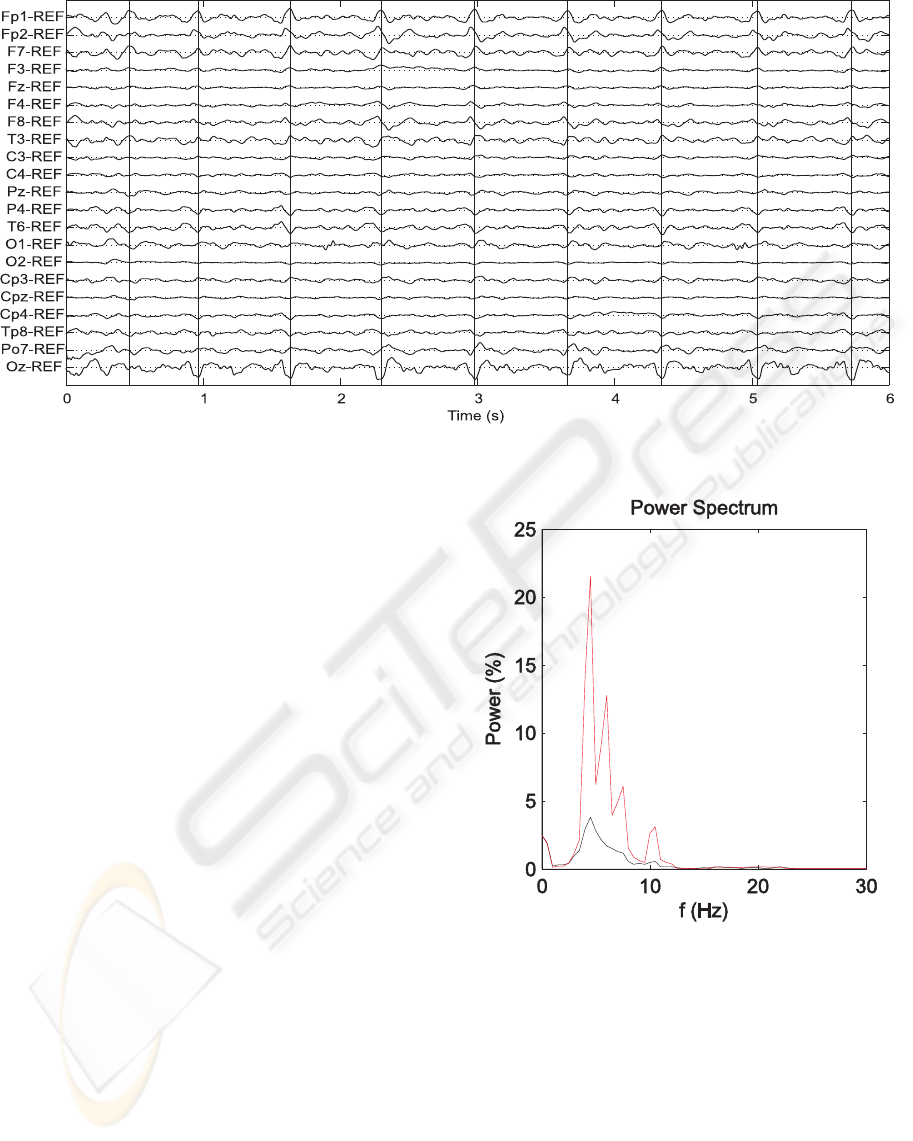
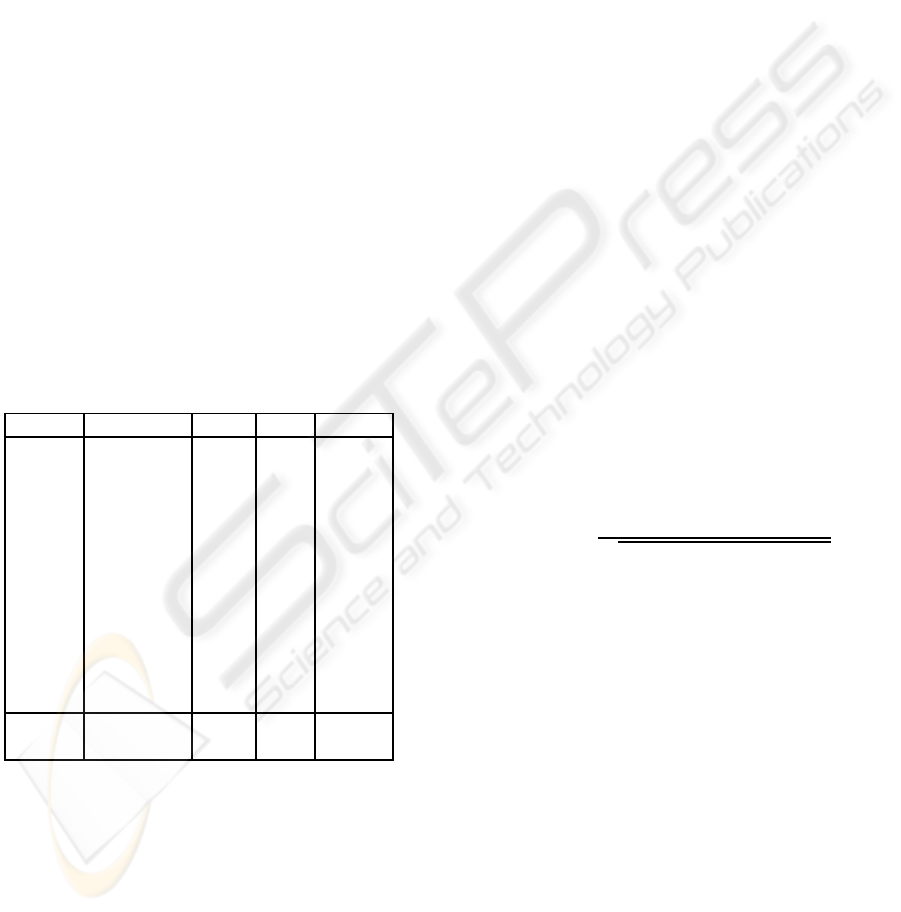
Figure 1: Simultaneous EEG/fMRI recording before BCG artifact removal.
where C is a diagonal matrix containing the correla-
tion coefficients associated to each variate in decreas-
ing order. We can then compute the canonical vari-
ates:
U
T
= Q
e
X
E =
e
XR
−1
e
X
E =
e
XΩ
X
V
T
= Q
e
Y
F =
e
YR
−1
e
Y
F =
e
YΩ
Y
(7)
2.3.2 Signal Reconstruction
Once the canonical variates are calculated, a subset
of them can be used to reconstruct the original signal.
The specific variates are selected by setting to zero the
regression coefficients corresponding to the unwanted
variates. The new signal approximation can be com-
puted using the new regression weights
e
Ω
X
and
e
Ω
Y
,as
follows:
b
X = (
e
Ω
−1
X
)
T
U =
e
Ω
T
U
U
b
Y = (
e
Ω
−1
Y
)
T
V =
e
Ω
T
V
V
(8)
2.4 Method
The artifact removal procedure involves the following
six steps:
1. identification of the BCG artifacts on the EEG,
2. segmentation of the EEG around the artifact,
3. application of CCA to two consecutive windows,
4. detection of artifactuated canonical variates,
5. removal of the artifactuated sources,
6. reconstruction of the original signal.
Figure 2: Normalized power spectrum of the Fp1 chan-
nel before (red line) and after (black line) artifact removal,
when six components are removed.
Figure 1 shows the original EEG. The artifacts are
easily distinguishable on the EEG channels and are
marked by vertical lines. At first inspection the arti-
fact appears synchronized over the channels but with
different amplitude. Moreoverthe shape changes over
time whereas the relative contribution of the artifact
to different electrode sites is time-independent. For
these reasons, CCA was applied to two consecutive
windows: this allows the extraction of components
that share the same topography over time.
BALLISTOCARDIOGRAPHIC ARTIFACT REMOVAL FROM SIMULTANEOUS EEG/FMRI RECORDING BY
MEANS OF CANONICAL CORRELATION ANALYSIS
13
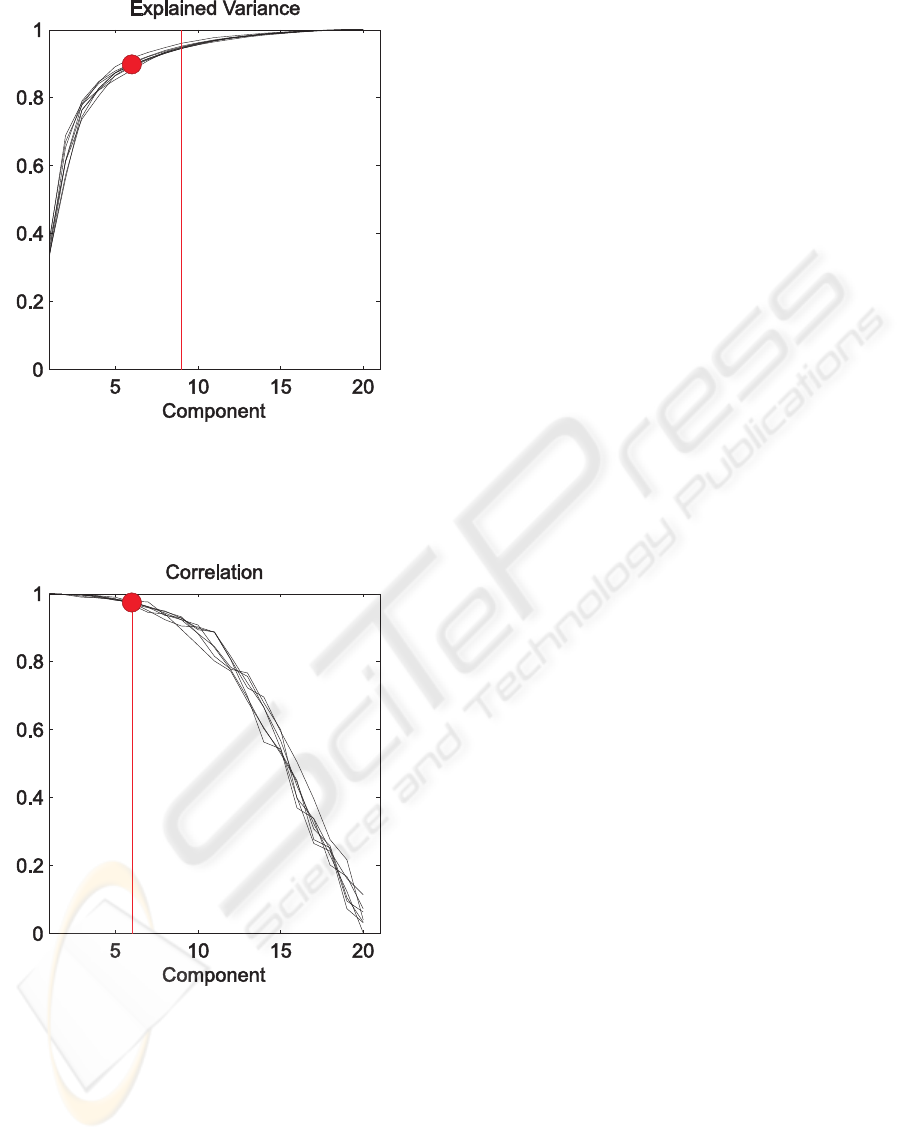
Figure 3: Cumulative explained variance for each BCG oc-
currence plotted as a function of the number of components:
the vertical line marks the component where the 95% of the
total variance is explained for all the BCG artifact. The red
dot represents the variance explained by the first six com-
ponents.
Figure 4: Correlation coefficients calculated by CCA plot-
ted for each BCG as a function of the components: the ver-
tical line marks the component where the correlation coef-
ficient is lower than 95% in all BCG’s.. The red dot repre-
sents he correlation of the sixth component.
The artifacts are manually identified on the EEG.
The data are then segmented by considering a win-
dow of 300 ms (the approximate duration of the ar-
tifact) around each artifact occurrence. CCA is ap-
plied to two consecutive windows (m × n, where n is
the number of points and m is the number of chan-
nels) and the canonical variates are calculated. The
sources outputted by the CCA algorithm are ordered
according to their correlation (see equation 6). The
basic assumption is that the artifact is determined by
the same sources active during two consecutive time-
windows, superimposed to EEG activity uncorrelated
to the artifact.
In order to guide the choice of the number of com-
ponents to remove, the following three features are
considered: the normalized power spectrum of the
Fp1 channel, where the artifact has high amplitude,
the cumulative explained variance and the correla-
tion coefficients given by CCA. Figure 2 represents
the normalized power spectrum of the Fp1 channel,
where the artifact has high amplitude, before and af-
ter artifact removal. In figure 3 the cumulative ex-
plained variance for each BCG occurrence is plotted
as a function of the number of components consid-
ered: the vertical line marks the component where the
95% of the total variance is explained for all the BCG
artifacts. In figure 4 the correlation coefficients calcu-
lated by CCA are plotted for each BCG as a function
of the components: again the vertical line marks the
component where the correlation coefficient is lower
than 95% in all BCG’s.
A graphical user interface (GUI), shown in figure
5, was developed in order to facilitate the artifact re-
moval procedure. A sliding bar allows the user to in-
crease the number of removed components from 0 to
k: at each step of the sliding bar, the first k compo-
nents, i.e. the k canonical variates associated to the
highest correlation, are removed. Simultaneously the
EEG before and after artifact removal is plotted, as
well as the normalized power spectrum of the Fp1
channel, the explained variance and the correlation
coefficients. A black dot represents the position of the
current component with respect to the explained vari-
ance and the correlation. The value of the explained
variance and the correlation at each step are also given
as the average over the BCG’s shown in the GUI. At
every step of the sliding bar, the plots and the values
of explained variance and correlation are updated. In
this way the user can determine the number of com-
ponents to remove based on visual inspection of both
EEG and its power spectrum (the smaller the harmon-
ics, the cleaner the signal), until the EEG appears
readable and the power spectrum does not change sig-
nificantly. Moreover the user can avoid excessive re-
moval of EEG activity by monitoring the explained
variance and the correlation of the component at the
current step.
BIOSIGNALS 2008 - International Conference on Bio-inspired Systems and Signal Processing
14
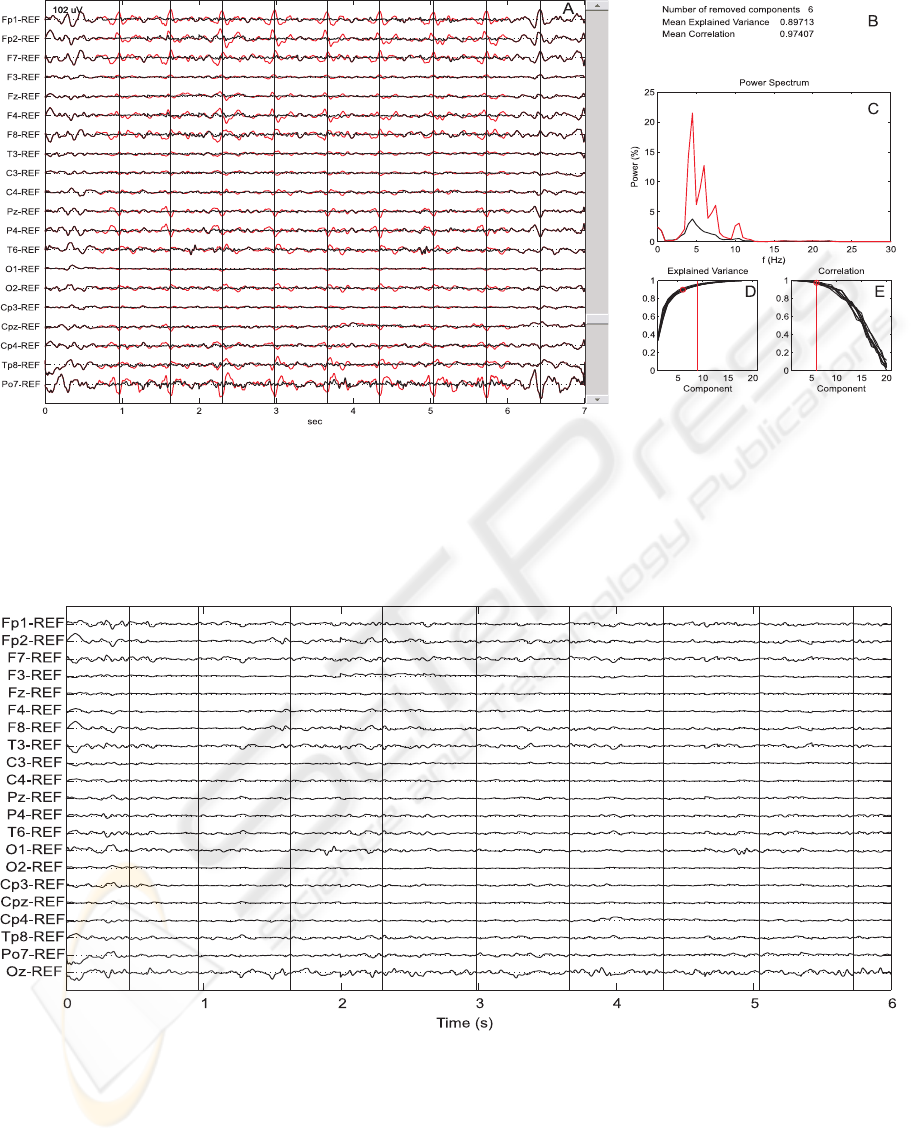
Figure 5: Screenshot of the graphical user interface (GUI) developed to remove the BCGa from EEG data. Panel A is
updated at every step of the sliding bar by a superposition of the original and the clean data. In panel B the number of
component removed at the current step are reported, as well as the explained variance and correlation, as the mean over the
BCG occurrences shown in panel A, for the particular number of components. Panel C represents the normalized power
spectrum of FP1 before (dashed line) and after (solid line) artifact removal. In panel D the cumulative explained variance for
each BCG occurrence shown in A is plotted as a function of the components. In E the correlation coefficients resulting from
the application of CCA to each BCG occurrence are also plotted as a function of the components.
Figure 6: Simultaneous EEG/fMRI recording after BCG artifact removal.
3 RESULTS AND DISCUSSION
Figure 6 shows the EEG after artifact removal, the
vertical lines define the time occurrence of the ar-
tifact. In this case the first six components were
removed (explained variance = 0.90; correlation =
0.97). The high amplitude artifact-related activity is
not visible anymore. Moreover,by monitoring the ex-
plained variance and the correlation coefficients, we
are able to preserve information in background EEG.
Table 1 shows how the number of removed compo-
nents is adaptively chosen, so that the algorithm can
BALLISTOCARDIOGRAPHIC ARTIFACT REMOVAL FROM SIMULTANEOUS EEG/FMRI RECORDING BY
MEANS OF CANONICAL CORRELATION ANALYSIS
15

cope with the intrinsic subject variability.
Figure 2 shows the normalized power spectrum
of the channel Fp1 before and after artifact removal
when the first six components were removed. The
harmonic components disappeared. Moreover, re-
moving more than the first five components does not
significantly change the power spectrum of the data.
We can infer that the first six componentswere artifact
related, whereas the remaining sources were EEG-
related.
Therefore, the results confirm the presence of arti-
factual sources that share the same topographies over
time.
4 CONCLUSIONS
We demonstrated that CCA can be a valuable tool
in removing the BCG artifact from simultaneous
EEG/fMRI recording.
We believe that CCA is able to take into account
the physiology of the artifact. The identification of
sources whose topographies do not change over time
allows the use of both spatial and temporal informa-
tion during the identification of the artifact. The use
of a moving window also allows the topographies to
adapt to the physiological variation of the blood flow.
This makes CCA an extension with respect to those
methods, like ICA or PCA, in which only the spa-
tial information is considered. Moreover CCA is less
sensitive than ICA to the window length (Hyvarinen
et al., 2001), allowing the use of a time window that
matches the artifact characteristics.
Further research has to be done in order to auto-
matically detect the BCGa on the EEG data and au-
tomatically identify the number of components to re-
move, in such a way that an optimal reconstruction is
achieved in each window. In order to assess the relia-
bility of the procedure, the application of the method
to a larger database of human recording is also neces-
sary. Moreover a simulation study is needed in order
to test the performances of the algorithm with respect
to noise and artifact characteristics.
REFERENCES
Allen, P. J., Polizzi, G., Krakow, K., Fish, D. R., and
Lemieux, L. (1998). Identification of EEG events in
the MR scanner: the problem of pulse artifact and a
method for its subtraction. Neuroimage, 8:229–239.
Ben´ar, C., Aghakhani, Y., Wang, Y., Izenber, A., Al-Asmi,
A., Dubeau, F., and Gotman, J. (2003). Quality of
EEG in simoultaneous EEG-fMRI for epilepsy. Clin
Neurophysiol, 114:569–580.
Golub, G. and Van Loan, C. (1996). Matrix Computations.
The Johns Hopkins University Press, Baltimore, 3rd
edition.
Hotelling, H. (1936). Relations between two sets of vari-
ates. Biometrika, 28(3/4):321–377.
Hyvarinen, A., Karhunen, J., and Erkki Oja, E. (2001). In-
dependent Component Analysis. Wiley, John & Sons,
Incorporated.
Niazy, R., Beckmann, C., Iannetti, G., Brady, J., and Smith,
S. (2005). Removal of fMRI environment artifacts
from EEG data using optimal basis sets. NeuroImage,
28:720–737.
Srivastava, G., Crottaz-Herbette, S., Lau, K., Glover, G.,
and Menon, V. (2005). ICA-based procedures for re-
moving ballistocardiogram artifacts from EEG data
acquired in the MRI scanner. NeuroImage, 24:50–60.
BIOSIGNALS 2008 - International Conference on Bio-inspired Systems and Signal Processing
16
