
IDENTIFICATION OF TIME-VARYING T-WAVE ALTERNANS
FROM 20-MINUTE ECG RECORDINGS
Issues Related to TWA Magnitude Threshold and Length of ECG Time Series
Laura Burattini
Department of Electromagnetics and Bioengineering, Polytechnic University of Marche, via Brecce Bianche
60131 Ancona, Italy
Wojciech Zareba
Heart Research Follow-Up Program, Cardiology Unit, Department of Medicine and Department of Biomedical
Engineering, University of Rochester, 601 Elmwood Ave, Rochester, NY 14642-8679, USA
Roberto Burattini
Department of Electromagnetics and Bioengineering, Polytechnic University of Marche, via Brecce Bianche
60131 Ancona, Italy
Keywords: Signal processing of the digital electrocardiographic signal, Repolarization variability, T-wave alternans.
Abstract: Aim of this study was the assessment of a T-wave alternans (TWA) identification procedure based on
application of an adaptive match filter (AMF) method, recently developed by ourselves, to a 20-minute
digital ECG recording (ECG20). Three-lead ECG20 tracings from 35 patients who survived an acute
myocardial infarction (AMI-group) and 35 healthy subjects (H-group) were analysed. The AMI-group
showed, on average, increased levels of TWA (P<0.01). Considering that noise may cause false positive
TWA detection, a threshold (THR
TWA
) was defined for TWA magnitude (TWAM) as the mean TWAM
+2SD over the H-group. TWAM exceeding this threshold identified a TWA-positive (TWA+) subject as
one at increased risk of sudden cardiac death. Fifteen (43%) AMI-patients vs. zero H-subjects were detected
as TWA+. This result meets clinical expectation. TWA manifested as a non stationary phenomenon that
could even be missed in all TWA+ subjects if our AMF (as well as any other technique) was applied to a
single short-term 128-beat ECG series, as usually done in previous reports. In conclusion, our AMF-based
TWA identification technique, applied to 20-minute ECG recordings, yields a good compromise between
reliability of time-varying TWA identification and computational efforts.
1 INTRODUCTION
T-wave alternans (TWA) is an electrophysiological
phenomenon which consists of two-to-one beat-to-
beat changes in the morphology (amplitude, shape
and, sometimes, polarity) of the electrocardiografic
(ECG) T wave. According to the literature, visible
and non-visible (microvolt) forms of TWA in ECG
recordings play an important role in the
arrhythmogenesis of failing myocardium (Schwartz
and Malliani, 1975; Zareba et al., 1994; Adam et al.,
1984; Smith et al., 1988; Rosembaum et al., 1994;
Kusmirek and Gold, 2007; Klingenheben and
Ptaszynski, 2007; Narayan, 2007). Visible forms of
TWA are infrequent. Non-visible TWA requires
computerized analysis of digital ECG recordings to
be recognized and parameterized in terms of
amplitude and duration. Thus, in the effort to assess
a clinically useful marker of sudden cardiac death,
development of methods for non-invasive automatic
detection of microvolt TWA has been a major
challenge in the last two decades (Rosenbaum et al.,
1996; Klingenheben et al., 2000; Ikeda et al., 2002;
Tapanainen et al., 2001;
Bigger and Bloomfield,
2007; Ikeda et al., 2006). Factors that may prevent a
reliable TWA quantification must be controlled by
186
Burattini L., Zareba W. and Burattini R. (2008).
IDENTIFICATION OF TIME-VARYING T-WAVE ALTERNANS FROM 20-MINUTE ECG RECORDINGS - Issues Related to TWA Magnitude Threshold
and Length of ECG Time Series.
In Proceedings of the First International Conference on Bio-inspired Systems and Signal Processing, pages 186-192
DOI: 10.5220/0001060601860192
Copyright
c
SciTePress

signal preprocessing, such as high frequency noise
filtering, detection of R peaks, RR stability testing,
and removal of baseline deviation from the
isoelectric line.
Recently, we developed a new adapting match
filter (AMF; Burattini et al., 2006) method for
automatic TWA detection, which, differently from
other reported techniques, does not require any pre-
processing of the ECG tracing, with the only
exception of R-peak detection. Making use of
simulated (Burattini et al., 2006) and experimental
(Burattini et al., 2007) data, we showed that this
method yields an improvement in reliability of TWA
detection over a previously reported correlation
method (Burattini,1998; Burattini et al., 1999).
Like any other TWA detection technique, our
AMF needs to be applied to ECG tracings with no
significant heart-rate variability and with a low noise
level. As a consequence, these techniques have
traditionally been applied to short-term ECG series,
typically consisting of 128 consecutive heart beats.
This rises the issue as to whether 128 beats portray
sufficient information on the presence of TWA. To
address this issue, in the present study we analyzed
3-lead (X,Y,Z) 20-minute digital ECG recordings
(ECG20). Our goal was to demonstrate that repeated
applications of our AMF-based method to several
tracings of 128 heart beats, within an ECG20, yields
a good compromise between reliability of TWA
identification and computational efforts. Our
analysis was performed on Holter ECG recordings
from patients who survived a myocardial infarction
since these are known to show increased levels of
TWA, compared to healthy subjects (Ikeda et al.,
2002; Pelicano et al., 2006; Ikeda et al., 2000; Puletti
et al., 1980).
2 METHODS
2.1 Clinical Data
Our study involved 35 healthy subjects (H-group;
RR=0.93±0.17 s) and 35 patients who survived an
acute myocardial infarction (AMI-group;
RR=0.88±0.14 s). For a better traceability during the
analysis, healthy subjects were identified as H01,
H02, … H35. Analogously, AMI patients were
identified as AMI01, AMI02, … AMI35.
A twenty-minute, three-lead (X,Y,Z) digital
Holter recording was obtained from each individual
in resting conditions, making use of Burdick
recorders (Burdick Inc., Milton, WI). Sampling rate
was 200 samples per sec. Series of 128 consecutive
cardiac beats were extracted every 10 seconds from
each tracing. Each series underwent our TWA
identification procedure as described below.
Because extraction of 128 cardiac beats every 10 s
causes a data overlap (on average 109 s for the H-
group, and 103 s for the AMI-group) between two
consecutive series, effects of this overlapping were
tested vs. an extraction procedure (data selection
every 128 beats) that avoids data overlapping.
2.2 T-Wave Alternans Detection by
Adaptive Match Filter
Our adaptive match filter method (AMF),
specifically designed to detect TWA (Burattini et al.,
2006 and 2007), was applied to each ECG series of
128 heart beats.
To avoid cases where TWA could be driven by
heart-rate variability (Adam et al., 1984;
Rosembaum et al., 1994; Burattini, 1998; Burattini
et al., 1999), an ECG time series has to be
characterized by a stable heart rate to be eligible for
TWA analysis. Specifically, we required that:
SDRR <0.1·MRR (1)
where MRR and SDRR are mean and standard
deviation of RR intervals (in s).
Under this condition, the TWA phenomenon is
assumed to be characterized by a specific frequency
of half heart rate: f
TWA
=0.5 cycles per beat, or f
TWA
=
1/(2*MRR) Hz. To account for physiological
variations of the RR interval, a narrow frequency
band, instead of a single frequency, was assumed
here to characterize the TWA phenomenon. On this
basis, our AMF was designed as a passband filter
with its passing band centred in f
TWA
. Technically,
the AMF was implemented as a 6
th
order
bidirectional Butterworth band-pass filter, having
the passing band 2·df
TWA
=0.12 Hz wide (value
experimentally found) and centred at a frequency
that adapts to mean RR interval. In particular, our
AMF was designed as a cascade of a low pass filter
(LPF) with cut-off frequency f
LPF
= f
TWA
+ df
TWA
, and
a high pass filter (HPF) with a cut-off frequency
f
HPF
= f
TWA
-df
TWA
. The squared module of the AMF
transfer function is expressed by the following
equation:
n
HPF
n
HPF
n
LPF
HPFLPFAMF
w
w
w
w
w
w
)w(H)w(H)w(H
2
2
2
222
11
1
⎟
⎟
⎠
⎞
⎜
⎜
⎝
⎛
+
⎟
⎟
⎠
⎞
⎜
⎜
⎝
⎛
⋅
⎟
⎟
⎠
⎞
⎜
⎜
⎝
⎛
+
=
=⋅=
(2)
IDENTIFICATION OF TIME-VARYING T-WAVE ALTERNANS FROM 20-MINUTE ECG RECORDINGS - Issues
Related to TWA Magnitude Threshold and Length of ECG Time Series
187

were n=3 (half of AMF order), w
LPF
=2πf
LPF
, and
w
HPF
=2πf
HPF
. Being the AMF applied in a
bidirectional fashion, no phase delay occurs. Thus,
the AMF is expected to detect the TWA signal by
filtering out not only noise and baseline wandering,
but also any other ECG component but the TWA.
The TWA signal provided by the AMF is a time
domain, constant phase and, possibly, amplitude-
modulated sinusoid with its maxima and minima
over the T-waves. A local estimate of TWA
amplitude (A
TWA
), associated to each single beat, is
directly given by the sinusoid amplitude in
correspondence of the T-wave apexes. If the T wave
of a beat is alternating, its A
TWA
is greater than zero.
In our procedure, all local A
TWA
values are used to
compute global (i.e. relative to all 128 beats of the
ECG series) estimates of TWA characteristic
parameters. In particular, the following global
parameters were determined: TWA duration
(TWAD, beat; defined as the total number of beats
with alternating T-waves), TWA amplitude (TWAA,
µV; defined as the mean A
TWA
over all alternating T-
waves), and TWA magnitude (TWAM, beat·µV;
defined as the product of TWAA times TWAD).
TWAM is used to detect the presence of TWA, since
it includes information about both TWAA and
TWAD. Moreover, TWAM allows identification of
different TWA episodes (such as those short in time
and high in amplitude, or long in time and low in
amplitude), which would not be detected if only
TWAD or TWAA, respectively, were used. Thus,
the AMF allows characterization of non-stationary
(i.e. time varying) characteristics of the TWA signal,
when present.
TWAD, TWAA and TWAM parameter values
are determined in each available lead.
Corresponding values from the three different leads
(X,Y,Z) are then averaged for final TWA
characterization relative to a specific 128-beat series.
The series with the highest TWAM is assumed as
the most representative of the entire 20-minute
recording.
2.3 Identification of TWA-Positive
Subjects
Considering that noise and artefacts may be detected
as TWA episodes, once TWA is identified and
parameterized, there is a need to define the TWA
level that characterizes a TWA-positive subject as
one at increased risk of sudden cardiac death. Taking
advantage of the H-group involved in our study, the
mean+2SD value of the TWAM distribution over
this group was assumed as the normality threshold
(THR
TWA
) of TWA magnitude. Thus, subjects with
TWAM greater than THR
TWA
were considered as
TWA positive (TWA+).
2.4 Statistical Analysis
Lilliefors test
(Lilliefors, 1967), was used to evaluate
the hypothesis that each data vector or parameter
vector had a normal distribution (significance was
set at 5% level) and could be expressed as mean ±
SD. Comparisons between two groups of normally
distributed samples were performed with two-tailed,
non-paired Student’s t-test (statistically significant
difference was assumed at P<0.05).
3 RESULTS
Application of our AMF method to an entire 20-
minute ECG recording (ECG20), with 128 beat ECG
series selected every 10 s, yielded normally
distributed TWA parameters with mean±SD for H-
group and AMI-group as given in Table 1. The
AMI-group was found to be characterized by having
significantly higher TWAD, TWAA, and TWAM.
The threshold value (THR
TWA
), as defined in
Methods, was 4176 beat·µV (that is, 2730+2×723).
With this threshold, fifteen patients of the AMI-
group (i.e. 43%) were classified as TWA+. No
subject of the H-group showed relevant TWA.
Extraction of ECG time series every 128 beats
(no overlap between two consecutive series)
provided a lower number of TWA+ among AMI-
patients (eleven cases, i.e. 31%), and significantly
lower estimates of TWA duration, amplitude and
magnitude parameters, with respect to the extraction
procedure performed every 10 s (Table 2).
Application of our AMF method to 128-beat
series taken in proximity of minutes 0 (
t
0
), 5 (t
5
), 10
(
t
10
), 15 (t
15
), and 20 (t
20
), yielded even lower
numbers of TWA+ patients associated with
significant reduction of mean TWAM, compared to
ECG20 with ECG time series extracted every 10 s
(Table 3). Eight (23%) out of the 15 (43%) patients
identified as TWA+ when analyzing ECG20
(namely, AMI02, AMI10, AMI11, AMI15, AMI18,
AMI19, AMI22 and AMI24), were never detected as
TWA+ when using single 128-beat series. Four
(11%) patients were detected as TWA+ at time t
0
and t
15
, two (6%) at t
10
, and only one (3%) at t
5
and
t
20
.
A representative example of the time course of
TWAD, TWAA and TWAM parameters averaged
over the three leads in our AMI01 patient is
BIOSIGNALS 2008 - International Conference on Bio-inspired Systems and Signal Processing
188
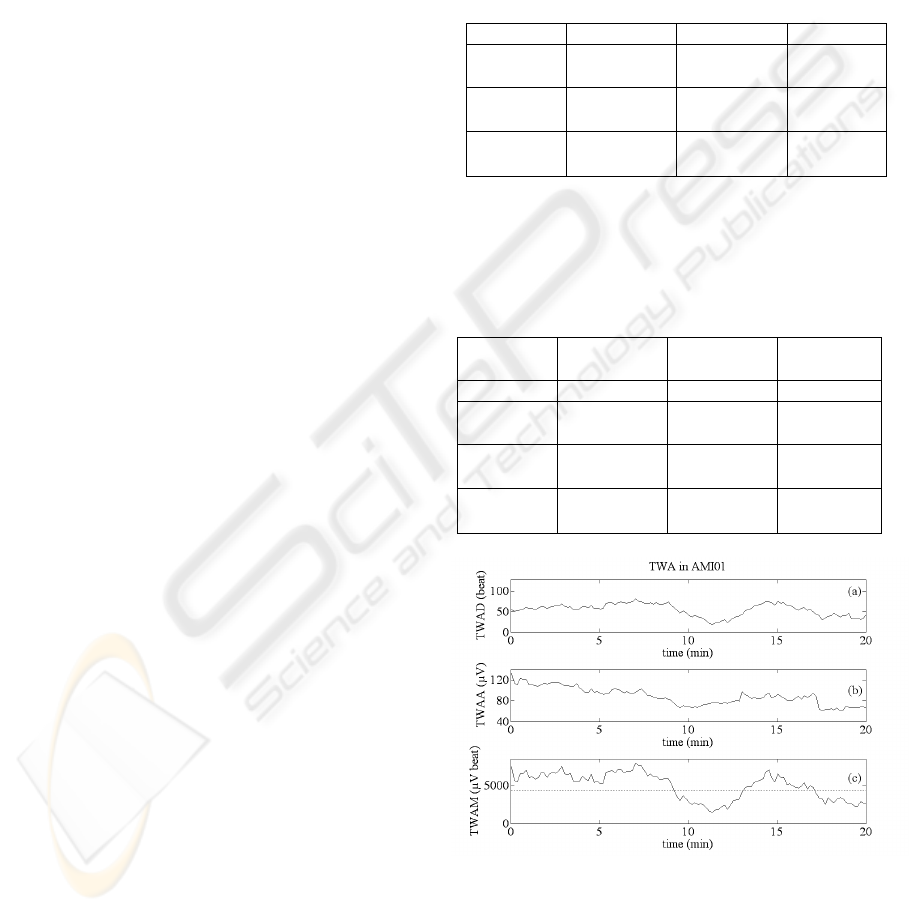
displayed in Fig. 1a to c. Panel c clearly shows that
TWAM, which has been assumed as a marker of the
presence of TWA, crosses the THR
TWA
value at
different time instants. Under-threshold values of
TWAM are due to a simultaneous decrement of both
TWAD and TWAA (panels a and b).
Because TWAM shows fluctuations with
threshold-crossing within ECG20, TWA could even
be missed in all TWA+ subjects if our AMF was
applied to a single, short-term 128-beat ECG series.
Confirmation of this statement is found in Fig. 2,
where TWAM waves from all fifteen TWA+
patients are displayed. Arrow pointers in proximity
of the eleventh minute mark 128-beat ECG series
with under-threshold TWAM which would miss all
TWA+ cases.
4 DISCUSSION
To satisfy the requirement of heart-rate stability for
reliable TWA detection, short-term ECG series have
been considered for TWA identification in most
reported studies. Indeed, spectral analysis has been
the first technique proposed in the literature for
automatically detecting TWA (Adam et al., 1984).
ECG series of 128-consecutive beats were
considered for its application because this is the
minimal requirement to guarantee reliable spectral
analysis. Since then, ECG time series of 128-
consecutive beats have been traditionally used for
TWA quantification. Thus, the issue arises as to the
reliability of using a single 128 beat sequence to
detect TWA+ cases. The present study was
designed to address this issue by applying our AMF-
based method for TWA detection (Burattini et al.,
2006). Comparison was performed among the results
obtained from 128 beat ECG series selected 1) every
10 s (data overlap), 2) every 128 beats (no data
overlap), 3) every 5 minutes, in a time frame of 20
minutes. For this technical investigation, we
considered a population of 35 AMI-patients
compared with a population of 35 H-subjects. The
H-population was used as reference to define a
threshold (THR
TWA
) for TWAM parameter provided
by our method as a marker to identify a remarkable
level of TWA.
A novel finding of our analysis was that, based
on the defined threshold, the use of a unique 128
beat ECG series is unsuitable to unmask and detect
TWA. An explanation of this shortcoming is found
in that TWA is a transient phenomenon
characterized by time-varying TWAD, TWAA and
TWAM parameters (Fig. 1). As shown in Fig. 2,
under-threshold values of TWAM, assumed as
marker of TWA, would miss TWA+ patients if a
unique 128-beat ECG series in proximity of the
eleventh minute was used.
Table 1: Comparison between TWA duration (TWAD),
amplitude (TWAA), and magnitude (TWAM)
distributions (mean±SD) in the H-group and AMI-group.
Data refer to 20-minute ECG recordings (ECG20) with
128 beat time series extracted every 10 s.
H-group AMI-group t-test
TWAD
(beat)
75±13 87±11 P<0.01
TWAA
(µV)
43±14 56±22 P<0.01
TWAM
(beat
*µV)
2730±723 3982±1386 P<0.001
Table 2: Comparison between TWA duration (TWAD),
amplitude (TWAA), and magnitude (TWAM)
distributions (mean±SD) in AMI-group. Data refer to 20-
minute ECG recordings with 128 beat time series
extracted every 10 s (ECG20 overlap) or every 128 beats
(ECG20 no overlap).
AMI-
group
ECG20
overlap
ECG20
no overlap
t-test
TWA+ 15 11
TWAD
(beat)
87±11 81±11 P<0.001
TWAA
(µV)
56±22 50±21 P<0.001
TWAM
(beat
*µV)
3982±1386 3453±1253 P<0.001
Figure 1: TWA in the AMI01 patient. Panels a, b, and c:
respectively, TWA duration (TWAD), TWA amplitude
(TWAA), and TWA magnitude (TWAM) as functions of
time. In panel c the normality threshold is represented with
a dotted line.
IDENTIFICATION OF TIME-VARYING T-WAVE ALTERNANS FROM 20-MINUTE ECG RECORDINGS - Issues
Related to TWA Magnitude Threshold and Length of ECG Time Series
189
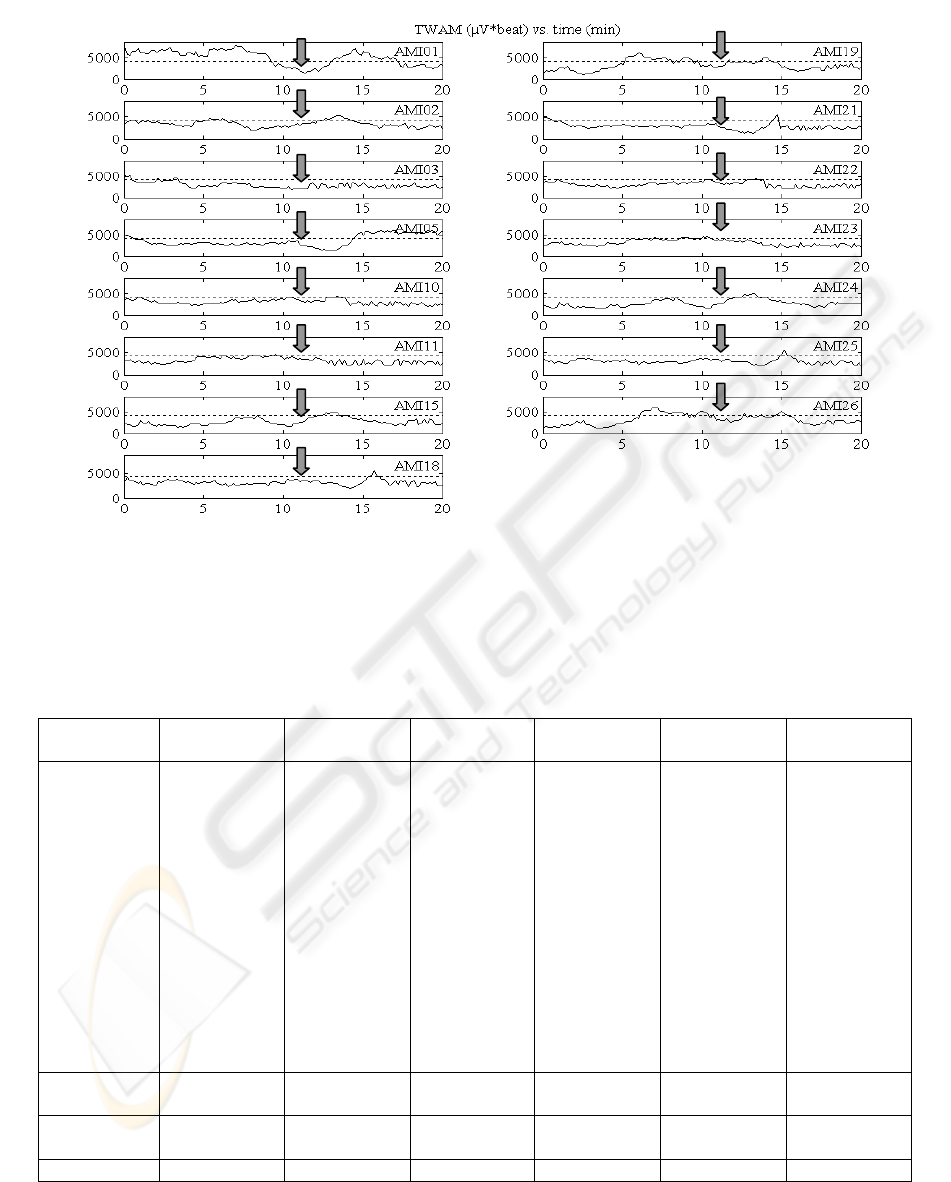
Figure 2: TWAM waves from our TWA+ patients. All them would not be recognised as TWA+ if a single 128 beat series
about the eleventh minute (arrows) was used, since TWAM is under threshold (dot line) about this time.
Table 3: TWA+ patients of AMI-group identified by our AMF method applied to the entire 20-minute ECG recording with
128 beats series extracted every 10 s (ECG 20 overlap), and to a single 128-beat series taken in proximity of minutes 0 (t
0
),
5 (t
5
), 10 (t
10
), 15 (t
15
), and 20 (t
20
). TWAM: TWA magnitude; TWA+: TWA positive patient. Student’s t-test is used to
compare the mean TWAM value over each considered 128-beat series (t
0
, t
5
, ..,t
20
) with mean TWAM over ECG 20.
AMI-group
ECG 20
overlap
t
0
t
5
t
10
t
15
t
20
TWA+
individual
patients
AMI01
AMI02
AMI03
AMI05
AMI10
AMI11
AMI15
AMI18
AMI19
AMI21
AMI22
AMI23
AMI24
AMI25
AMI26
AMI01
-
AMI03
AMI05
-
-
-
-
-
AMI21
-
-
-
-
-
AMI1
-
-
-
-
-
-
-
-
-
-
-
-
-
-
-
-
-
-
-
-
-
-
-
-
-
AMI23
-
-
AMI26
AMI01
-
-
AMI05
-
-
-
-
-
-
-
-
-
AMI25
AMI26
-
-
-
AMI05
-
-
-
-
-
-
-
-
-
-
-
Total TWA+
15
(43%)
4
(11%)
1
(3%)
2
(6%)
4
(11%)
1
(3%)
TWAM
(beat
*µV)
3982±1386 2708±1324 2352±974 2330±1030 2494±1298 2397±1178
t-test P<0.001 P<0.001 P<0.001 P<0.001 P<0.001
BIOSIGNALS 2008 - International Conference on Bio-inspired Systems and Signal Processing
190

We identified in 3-lead (X, Y, Z) 20-minute
digital ECG recordings a time frame that achieves a
good compromise between reliability of TWA
identification and computational efforts. Moreover, a
20-minute time frame is short enough to be possibly
obtained in controlled conditions, so that noise and
heart-rate variability due to emotional or physical
factors may not interfere significantly.
The definition of a threshold for TWAM is a
critical issue. The value identified here as mean
TWAM+2SD over our H-group yielded no presence
of TWA in this population, since the under-threshold
level of TWA is considered as background noise.
Our finding of no TWA in H-subjects is consistent
with what is commonly recognised in clinics.
Nevertheless, further studies on populations of
clinical relevance are desirable to define an optimal
normality threshold.
Several techniques have been proposed in the
literature for TWA detection (Adam et al., 1984;
Nearing et al., 1991; Burattini et al., 1999; Burattini
et al., 2006). Among these, the spectral method,
pioneered by Adam et al. (1984), is the most widely
used in clinics. However, being TWA a transient
(i.e. non-stationary) phenomenon (Kusmirek and
Gold, 2007; Cox et al., 2007; Richter et al., 2005;
and present study), a time-domain approach, as our
AMF method, appears, from a theoretical point of
view, more appropriate since it provides local (i.e.
relative to the single beat) as well as global (i.e.
relative to the entire ECG series under analysis)
TWA parameterization. Moreover, it is able to
discriminate between TWA phenomena sustained-
in-time (minutes) but low-in-amplitude and short-in-
time (few beats) but large-in-amplitude. Because
these two different kinds of TWA could potentially
have different clinical implications (statement to be
confirmed by future clinical studies), it appears
worthwhile to have a TWA detection method, which
allows discrimination between them. Such a
discrimination is not allowed by the spectral method,
which works, by definition, under the hypothesis of
stationary signal, and provides TWA measurements
that are averaged over the entire ECG time series
under analysis (128 beats). As a consequence, no
local (at the beat level) parameterization is possible
with the spectral method.
Two more TWA detection techniques proposed
in the literature are the correlation method (Burattini
et al., 1999) and the complex demodulation (Nearing
et al., 1991), which operate in the time domain.
Compared to the correlation method, our AMF
improves TWA detection in the presence of baseline
wanderings (Burattini et al., 2006). Complex
demodulation is computationally very heavy and has
never been used for practical purposes. In addition,
compared to any other TWA detection algorithm,
our AMF does not require pre-processing of the
ECG tracing, because noise and ECG frequency
components other than f
TWA
, are simultaneously
filtered out.
Our study suggests to analyse 20 minute ECG
recordings by applying our AMF to 128 beat ECG
time series selected every 10 seconds within a 20-
minute time frame. As a consequence, the TWA
global parameters (TWA duration, amplitude and
magnitude) associated to a time instant are the result
of an integration procedure over a 128 beats
window, corresponding (see Methods), on average,
to 119 s for the H-group, and 113 s for the AMI-
group. This, of course, results in a significant
overlap of data sets. A certain degree of overlap,
however, is necessary. In fact TWA episodes could
be divided into shorter ones during the windowing
procedure for 128 ECG time series extraction, and
this operation could prevent a correct TWA
detection and quantification. In addition, to be
eligible for TWA analysis, a 128 beat ECG is
required to satisfy the heart-rate stability condition
(eq. 1). The presence of local arrhythmic or noise
conditions, including ventricular premature beats,
artefacts, as well as false-positive and false-negative
beat detections, may cause rejection of a 128 beat
ECG. If no overlap among ECG time series is
present, all information on TWA in the time frame
belonging to the rejected ECG series is lost. Rather,
if a certain degree of overlap is allowed, some
information on TWA can be recovered from a close
ECG time series not affected by the local noise
factor. The time resolution recovering, consisting of
the transition from the global (relative to the entire
ECG series) domain to the local (relative to the
single beat) domain, is possible only with time-
domain TWA detection methods, through the
availability local TWA amplitude measure (A
TWA
).
Computational efforts limit the frequency of
time series extraction from an ECG20. Results of the
present study indicate that application of our AMF-
based method to 128 beat series extracted every 10 s
is a good compromise between reliability of non
stationary, transient TWA identification and
computational efforts. This kind of analysis, in fact,
can be routinely performed in real time in a clinic or
doctor’s office using a standard personal computer.
IDENTIFICATION OF TIME-VARYING T-WAVE ALTERNANS FROM 20-MINUTE ECG RECORDINGS - Issues
Related to TWA Magnitude Threshold and Length of ECG Time Series
191

REFERENCES
Schwartz P.J., Malliani A., 1975. Electrical alternation of
T wave: clinical and experimental evidence of its
relationship with the sympathetic nervous system and
with the Long QT Syndrome. Am Heart J,; 89(1): 45-
50.
Zareba W., Moss A.J., Le Cessie S., Hall W.J., 1994. T
wave Alternans in idiopathic Long QT Syndrome. J
Am Coll Cardiol, 23(7): 1541-1546.
Adam D.R., Smith J.M., Akselrod S., Nyberg S., Powell
A.O., Cohen R.J., 1984. Fluctuations in T-wave
morphology and susceptibility to ventricular
fibrillation. J Electrocardiol, 17(3): 209-218.
Smith J.M., Clancy E.A., Valeri C.R., Ruskin J.N., Cohen
R.J., 1988. Electrical alternans and cardiac electrical
instability. Circulation, 77: 110-121.
Rosenbaum D.S., Jackson L.E., Smith J.M., Garan H.,
Ruskin J.N., Cohen R.J., 1994. Electrical alternans and
vulnerability to ventricular arrhythmias. N Engl J Med,
330(4): 235-241.
Kusmirek S.L., Gold M.R., 2007. Dynamic changes of T-
wave alternans: does it predict short-term arrhythmia
vulnerability?. J Cardiovasc Electrophysiol, 18(5):
518-519.
Klingenheben T., Ptaszynski P., 2007. Clinical
significance of microvolt T-wave alternans.
Herzschrittmacherther Elektrophysiol, 18(1):39-44.
Narayan S.M., 2007. T-wave alternans and human
ventricular arrhythmias: what is the link?. J Am Coll
Cardiol, 49(3): 347-349.
Rosenbaum D.S., Albrecht P., Cohen R.J., 1996.
Predicting sudden cardiac death from T wave alternans
from the surface electrocardiogram: promises and
pitfalls. J Cardiovasc Electrophysiol, 7(11): 1095-
1111.
Klingenheben T., Zabel M., D’Agostino R.B., Cohen R.J.,
Hohnloser S.H., 2000. Predictive value of T-wave
alternans for arrhythmic events in patients with
congestive heart failure. Lancet, 356(9230): 651-652.
Ikeda T., Saito H., Tanno K., Shimizu H., Watanabe J.,
Ohnishi Y., Kasamaki Y., Ozawa Y., 2002. T-wave
alternans as predictor for sudden death after
myocardial infarction. Am J Cardiol, 89(1): 79-82.
Tapanainen J.M., Still A.M., Airaksinen K.E., Huikuri
H.V., 2001. Prognostic significance of risk stratifiers
of mortality, including T wave alternans, after acute
myocardial infarction: results of prospective follow-up
study. J Cardiovasc Electrophysiol, 12(6): 645-652.
Bigger J.T., Bloomfield D.M., 2007. Microvolt T-wave
alternans: an effective approach to risk stratification in
ischemic cardiomyopathy?. Nat Clin Pract Cardiovasc
Med, 4(6):300-301.
Ikeda T., Yoshino H., Sugi K., Tanno K., Shimizu H.,
Watanabe J., Kasamaki Y., Yoshida A., Kato T., 2006.
Predictive value of microvolt T-wave alternans for
sudden cardiac death in patients with preserved
cardiac function after acute myocardial infarction:
results of a collaborative cohort study. J Am Coll
Cardiol, 48(11): 2268:2274.
Burattini L., Zareba W., Burattini R., 2006. Automatic
detection of microvolt T-wave alternans in Holter
recordings: Effect of baseline wandering. Biomedical
Signal Processing and Control, 1(2): 162-168.
Burattini L., Zareba W., Burattini R., 2007. Heart-rate
adapting match filter detection of T-wave alternans in
experimental Holter ECG recordings. In: Proceeding
of the Fifth IASTED International Conference on
Biomedical Engineering, Gardner J.W. Ed., ACTA
Press, Zurich: 346-351.
Burattini L., 1998. Electrocardigraphic T-wave alternans
detection and significance. Doctoral thesis. University
of Rochester, Rochester NY.
Burattini L., Zareba W., Moss A.J., 1999. Correlation
method for detection of transient T-wave alternans in
digital ECG recordings. Ann Noninvasive
Electrocardiol, 4(4): 416-424.
Pelicano N., Oliveira M., da Silva N., Anao A., Feliciano
J., Fiarresga A., Alves S., Silva S., Quininha J., 2006.
Assessment of T-wave alternans after acute
myocardial infarction: influence of timing of PTCA on
cardiac electrical stabilization. Rev Port Cardiol,
25(4): 379-387.
Ikeda T., Sakata T., Takami M., Kondo N., Tezuka N.,
Nakae T., Noro M., Enjoji Y., Abe R., Sugi K.,
Yamaguchi T., 2000. Combined assessment of T-wave
alternans and late potentials used to predict arrhythmic
events after myocardial infarction. A prospective
study. J Am Coll Cardiol, 35(3): 722-730.
Puletti M., Curione M., Righetti G., Jacobellis G., 1980.
Alternans of the ST segment and T wave in acute
myocardial infarction. J Electrocardiol, 13(3): 279-
300.
Lilliefors H.W., 1967. On the Kolmogorov-Smirnov test
for normality with men and variance unknown. J Am
Stat Assoc, 62:399-402.
Cox V., Patel M., Kim J., Liu T., Sivaraman G., Narayan
S.M., 2007. Predicting arrhythmia-free survival using
spectral and modified-moving average analyses of T-
wave alternans. Pacin Clin Electrophysiol, 30(3):352-
358.
Richter S., Duray G., Hohnloser S.H., 2005. How to
analyze T-wave alternans. Heart Rhythm, 2(11):1268-
1271.
Nearing B.D., Huang A.H., Verrier R.L., 1991. Dynamic
tracking of cardiac vulnerability by complex
demodulation of the T wave. Science, 252(5004): 437-
440.
BIOSIGNALS 2008 - International Conference on Bio-inspired Systems and Signal Processing
192
