
POSSIBILITY OF MENTAL HEALTH SELF-CHECKS USING
DIVERGENCE PROPERTIES OF PULSE WAVES
Mayumi Oyama-Higa
Department of Integrated Psychological Science, Kwansei Gakuin University, Uegahara, Nishinomiya, Hyogo, Japan
Tiejun Miao
CCI Corporation and Chaos Technology Research Laboratory, kitashinagawa, shinagawa-ku, Tokyo, Japan
Keywords: Chaotic analysis, divergence, fingertip pulse waves, Lyapunov exponent, PC mouse, mental health.
Abstract: We conducted a nonlinear analysis of fingertip pulse waves and found that the Lyapunov exponent having
the “divergence” property of attractor trajectory was an effective index for estimating human mental health.
We showed that this method is effective for an early detection of dementia and depression, as well as in the
detection of changes in mental status. In addition, based on these results obtained from time series analysis
of the recorded pulse waves, we developed an application device allowing easily installed and convenient
measurement for daily check and monitoring mental/physical status. It was an easy-to-use and cost-less
device installed in a PC mouse. Also, we studied a representation method of constellation graphs to disclose
the fluctuation details of the Lyapunov exponents. In the representation, changes in mental status were
assessed and graphically visible by using of the fluctuation factor of the Lyapunov exponents.
1 INTRODUCTION
Some serious mental health problems exist in Japan.
For example, the number of annual suicides has
reached 30,000 for three consecutive years 2004 to
2006.Most suicides are related to depressive
symptoms. In addition, although Japan has the
world’s highest longevity rate, the cases of dementia
increase along with the rapidly increase in the aged
population, thereby leading to some social problems
(ref. plala, http). Social and family responses are
essential to help those with depression and dementia,
but in most cases, these diseases progress without
self-acknowledged, and hence need the necessary
methods for an early detection and treatment.
It is generally necessary to check the status of
behavior and mental health in daily life to detect the
onset of depression and dementia. Subjective
observation alone is insufficient; it is required to
evaluate objective data using scientific methods. So
far, scientific methods include the analysis of brain
waves and image diagnosis of the brain, which
require high levels of technology and knowledge;
these are not simple measurement methods in terms
of time or cost. Therefore, easy and economical
measurement methods are required.
The Lyapunov exponent referencing the
“divergence” of an attractor trajectory in the
nonlinear analysis of fingertip pulse waves is an
effective method for assessing mental health in
humans (Tsuda 1992). In particular, it was found to
be effective for the detection of dementia and the
diagnosis of depression (Oyama-Higa 2006). In
section 2, we describe the method used to calculate
the “divergence value” using the nonlinear analysis
of fingertip waves. In section 3, we explain the
meaning of the use of fingertip pulse waves and the
relation between the “divergence value” and
cognitive psychology. In section 4, the relation
between the Lyapunov exponent and mental health
is explained. In section 5, we show the
representation method of constellation graphs
developed for mental health self-checks. Finally, we
outline our future work, and make some discussions
in relating to possible applications.
361
Oyama-Higa M. and Miao T. (2008).
POSSIBILITY OF MENTAL HEALTH SELF-CHECKS USING DIVERGENCE PROPERTIES OF PULSE WAVES.
In Proceedings of the First International Conference on Bio-inspired Systems and Signal Processing, pages 361-370
DOI: 10.5220/0001060503610370
Copyright
c
SciTePress
2 METHODS OF RECORDING
AND ANALYSIS OF FINGERTIP
PULSE WAVES
2.1 Recording Method of Fingertip
Pulse Wave
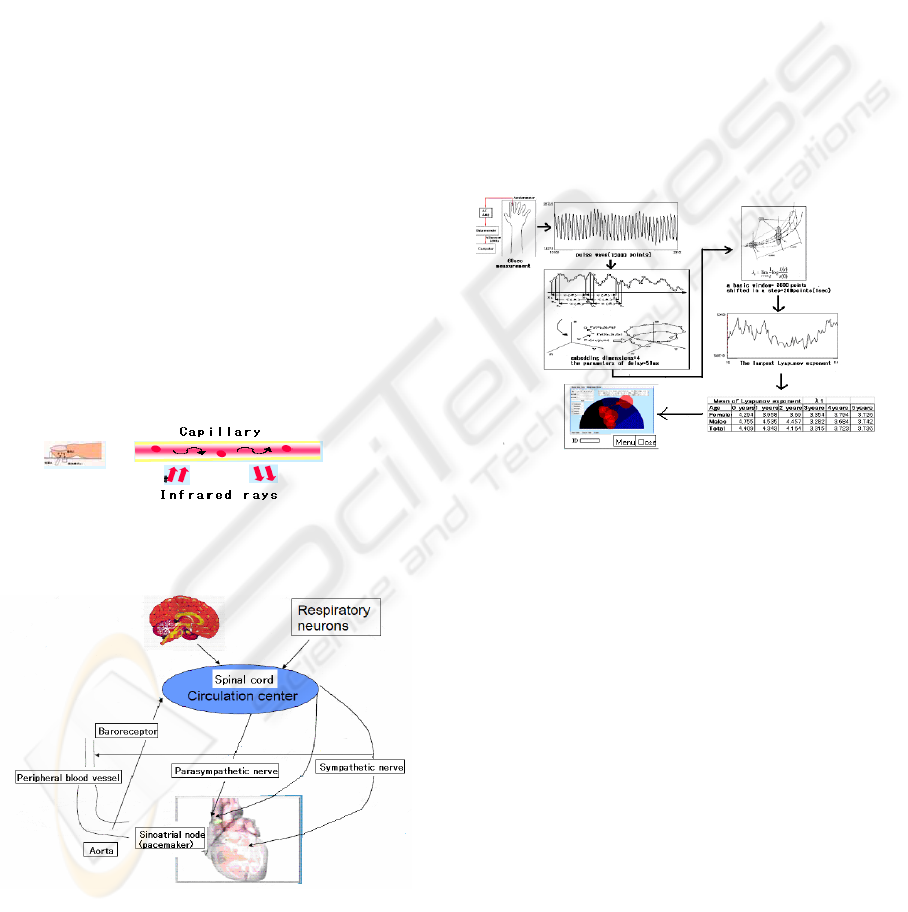
Fingertip pulse waves were measured by photo-
plethysmography method. Changes in the amount of
hemoglobin flowing through the capillaries were
measured by infrared photo-electric method (Fig. 1).
The waveform is naturally synchronized with the
beating of the heart. Dynamics changes in
hemoglobin levels caused by the constriction of
capillaries in the fingertip constitute time series data
from a complex system that includes information
from the sympathetic and parasympathetic nerve.
Changes in hemoglobin levels in the capillaries are
thought to be related to the baroreceptor, which are
linked to the sympathetic and parasympathetic nerve
via the brain stem and spinal cord (Figure. 2). Pulse
wave data were collected at a sampling frequency of
200 Hz with a resolution of 12 bits. The
measurement duration was variable, depending on
the experimental conditions. Time series data
consisting of 12,000 points can be obtained in 1 min
of measurement.
Figure 1: Measurement of pulse waves using infrared
irradiation of capillaries.
Figure 2: Diagrammatic representation of the interaction
from brain stem to peripheral blood vessels through the
action of sympathetic and parasympathetic nerves.
This is a convenient measurement method because it
does not require special care with regard to room
temperature, place of measurement, and
measurement conditions. Moreover, because the
measurement time is very short, the collection of
data is not a burden to the subject.
2.2 Chaos Analysis of the Pulse Wave
Fingertip pulse waves were demonstrated to have
chaotic characteristics (Tsuda1992, Sumida 2000,
and Miao 2006). On the basis of chaotic analysis of
time series, we analyzed the recorded data to
determine divergence properties of the pulse waves.
In chaos analysis, the attractor was reconstructing
using time delay method (Tarkens,1981,1985). The
parameters used are delay time of 50 ms and
embedding dimension 4.
Figure 3: Procedure from measurement of pulse waves to
Lyapunov exponent computations.
Beside of the effective information obtainable from
the shape of the four-dimensional attractor, we
calculated the Lyapunov exponent, which is an
index of trajectory instability and a characteristic of
chaos, using Sano and Sawada algorithm (Sano and
Sawada 1985).
As shown in Figure 4, we used the following method
to calculate the Lyapunov exponent. We assumed
that a small sphere (hypersphere) of radius ε is the
initial value for a three-dimensional chaotic dynamic
system. After being mapped once, the sphere was
stretched in the e1 direction and compressed in the
e3 direction, and assumed the shape of an ellipsoid
(Figure. 4). We designated the logarithm of the
expansion rate per unit time along the directions e1,
e2, and e3 as λ1, λ2, and λ3, respectively. Here, λ1,
λ2, and λ3 are the Lyapunov exponents and their set
is the Lyapunov spectrum. Because four embedded
dimensions were set as the optimum number of
dimensions for the pulse wave, w obtained the four
Lyapunov exponents, λ1, λ2, λ3 and λ4, as the
BIOSIGNALS 2008 - International Conference on Bio-inspired Systems and Signal Processing
362

Lyapunov spectrum. Of these, the largest Lyapunov
exponent, λ1, was used in the calculation to prepare
the constellation graphs.
The following equations show the method of
calculating the Lyapunov exponent. For the time
series data x(i), with i = 1, 2,…, N obtained from the
fingertip pulse waves, the phase space was
reconstructed using the method of time delays.
Assuming that we create a d-dimensional phase
space using a constant time delay τ, the vectors in
the space are generated as d-tuples from the time
series and are given by
)}({)))1((),...,(()( ixdixixi
k
=−−=
τ
X
(1)
where
))1(()(
τ
−−= kixix
k
, with k = 1, 2,..., d.
To reconstruct the phase space correctly, the
parameters of delay (τ) and embedding dimensions
(d) should be chosen optimally (Sano and Sawada,
1985). In time series data recorded from human
finger photoplethysmograms, we chose the
parameters τ = 50 ms and d = 4, as in (Tsuda, 1992)
and (Sumida, 2000).
In the reconstructed phase space, one of the
important measures of complexity is the largest
Lyapunov exponent λ1. If
)(tX
is the evolution of
some initial orbit
)0(X
in the phase space with time,
then
||
|)(|
ln
1
limlim
0
1
ε
δ
λ
ε
ε
t
t
t
X
→∞→
=
(2)
where
)()()( ttt
εε
δ
XXX −=
and
)0()0(
ε
ε
XX −=
for almost all initial difference vectors
)0()0(
ε
ε
XX −=
. We estimated
1
λ
using the algorithm
of Sano and Sawada (1985), where
1
λ
describes the
divergence and instability of the orbits in phase
space.
Figure 4: Method used to calculate the Lyapunov
exponent.
The initial 8000 points of pulse wave data were
taken as one window to calculate the largest
Lyapunov exponent, λ1. In the next step, the
window was shifted by 200 points and the exponent
was calculated from the next window of 8000 points.
This procedure was repeated until the pulse wave
data were exhausted. Three minutes of measurement
yielded 36,000 data points; therefore, we can obtain
a (36,000 – 8000)/200 = 140-point time series of
Lyapunov exponents. With 1 min of measurement,
we can achieve a (12,000 – 8000)/200 = 20-point
time series of Lyapunov exponents. The variation in
the largest Lyapunov exponent is a measure of the
variation in the trajectory of the four-dimensional
attractor. The largest Lyapunov exponent is the
divergence of the attractor trajectory and is an
important value related to psychological indices
(Oyama-Higa, 2005, 2006).
3 ESTIMATING
PHYSIOLOGICAL AND
PSYCHOLOGY STATUS
3.1 Outline of Self-checking Method
The subjects were asked to answer some simple
questions to ensure the normal measurement of pulse
waves. This information was used to interpret the
observed divergence in measured values. The
questions were status-checking items regarding
physical conditions and a simple assessment of their
mood at the time of measurement. Answers were
chosen from one of three available levels (Table 1).
In addition to these questions, the subjects were
asked to describe their mood and condition at the
time of the measurement in more definite terms
(Table 1). This enabled the person to identify factors
that can affect divergence values. Because these
records were made in free-form style, key words
alone could be used. However, when a subject is
allowed to write freely, for example, about things
that he or she had communicated to a friend, music
he or she enjoyed, positive results in a sporting
activity, and good or bad news that had been
received, it is easier to study the relationships
between these events and the divergence value.
The types of situations that elicit emotions such
as delight, anger, sorrow, and pleasure differ from
person to person. For example, a condition that
creates a suitable level of divergence, such as
listening to music or having a conversation with
someone, must be recorded as data unique to that
subject. In addition, extreme tension, fatigue, and
low spirits also cause changes in divergence.
Therefore, comparing the status recorded at the time
POSSIBILITY OF MENTAL HEALTH SELF-CHECKS USING DIVERGENCE PROPERTIES OF PULSE WAVES
363

of measurement with the corresponding divergence
values helps a person to assess his or her own mental
status. The responses and simple comments on the
subject’s condition are stored so that they can be
seen by clicking the corresponding divergence value
on the graph. We plan to vary the simple questions
asked according to the category of the subject, e.g.,
child, adult, or aged person.
Table 1: Checking items of subjective evaluation of
subject’s state.
Freestyle reporting: The subject enters a note on his or her
condition at the time of measurement. These notes can be in the
form of a descriptive comment on the subject’s condition,
keywords, and other comments.
Comment example 1: [Had a pleasant chat with a friend about
hobbies.]
Comment example 2: [Feeling low after failing a test.]
3.2 Divergence Analysis for Various
Physiological and Psychological
Status
Biological systems are considered to be complex and
fluctuating, with chaotic characteristics. Although
chaotic systems appear to be extremely complicated
and to behave in a random and unstable manner,
they in fact change according to deterministic rules.
Biological signals emanating from humans or vital
signs come in many types, such as body
temperature, blood pressure, and pulse rate.
Fingertip pulse waves are biological signals that
produce time series data with chaotic characteristics.
Moreover, unlike cardiac waves, fingertip pulse
waves contain various types of information,
including information from the nervous system. In
the field of psychology, several methods have been
suggested as indices for assessing mental health.
However, these methods are generally subjective
and therefore intrinsically lacking in objectivity.
Questionnaires have often been used as relatively
simple psychological tests, and the measurement and
analysis of brain waves can be used to objectively
assess the neurological state at the time of
measurement. However, the measurements are not
simple and the analysis methods are not yet suitable
for analyzing detailed psychological changes.
Another possible method for measuring biological
information is to analyze the R–R intervals of
heartbeats and pulse waves. However, no analysis
has attempted to take into account the chaotic
characteristics of biological information.
The Lyapunov exponent is a property of chaotic
systems that expresses the attractor and represents
the “divergence” of the attractor trajectory. We
focused on the Lyapunov exponent, which has not
previously been evaluated quantitatively as an index
of psychological change in humans, and investigated
its relationships to dementia and communication
skills (an ADL index) in aged persons (Oyama-
Higa,2006), its relationship to error rate at work
(Imanishi,2006), its relationship to diurnal changes
and indices of cumulative fatigue in employees
(Miao,2006),(Oyama-Higa,2006), and time series
fluctuations in divergence in 0- to 5-year-old
children, as well as the effects of parental affection
toward children (Oyama-Higa,2006).
It became clear that suitable functioning and
harmony of the sympathetic nerves, which are
related to adaptability to the external environment
and to society, as well as to flexibility, spontaneity,
and cooperativeness of the mind, are important for
humans to live in a mentally healthy state. These
values were related to the largest Lyapunov
exponent obtained using nonlinear analysis (Oyama-
Higa, 2005, 2006). The largest Lyapunov exponent,
which represents the time series variation in the
attractor trajectory, is defined as the “divergence.”
When this value remains low continuously (i.e.,
when a long period with low divergence persists),
the person has low ability to adapt to the external
world in daily life and is incapable of maintaining a
mentally healthy state. However, a continuously
high level of divergence indicates an extremely tense
or stressful state. A mentally healthy state also
cannot be maintained in this situation. Normally in
humans, a healthy state is indicated by the condition
in which constant variation occurs in the divergence.
Status Good Normal Poor
Sleep
∨
Appetite
∨
Health
∨
Will to work
∨
Mental health
∨
Current mood
∨
BIOSIGNALS 2008 - International Conference on Bio-inspired Systems and Signal Processing
364
Emotions are a part of being human, and these are
believed to cause the variation in divergence.
Physical immunity is critical for the maintenance of
human health, and lowered immunity causes various
diseases. Therefore, to prevent the lowering of
physical immunity and to increase resistance and
prevent diseases, we pay attention to what we eat
and we rest, take medicine when necessary, and
exercise to improve our stamina. However, mental
toughness, as reflected in the ability to communicate
in a positive manner, willingness to perform a given
job, and the ability of mental toughness to withstand
dramatic changes in the external world, are also very
important. We can call these “mental immunity,” but
no methods have been developed to scientifically
investigate this kind of immunity. We analyzed
fingertip pulse waves using nonlinear analysis,
examined their relationships to various
psychological indices, and found that the largest
Lyapunov exponent obtained through chaos
analysis, which corresponds to the “divergence” of
the attractor, was closely related to mental
immunity. This value was also closely linked with
the functioning of the sympathetic nerves of the
autonomic nervous system.
For humans, a mentally healthy condition means
having the ability to cope flexibly with external
changes in “divergence.” This can be considered
mental flexibility or mental immunity, in contrast to
physical immunity. Mental immunity represents
adaptability to the external changes that a person has
to face in his or her everyday life, including a
person’s ability to communicate and express oneself,
and the suitability of psychological flexibility. When
expressing themselves, humans skilfully fend off
various types of changes, contacts, and assaults from
the external environment, and deal with or cope with
them. This is the essence of mental immunity.
Change occurs constantly in day-to-day life.
“Divergence,” which represents a change in the state
of mental immunity, is a critical index. At the same
time, divergence varies depending on the condition
of the person. For example, a long period without
“divergence” suggests that the person is not in a
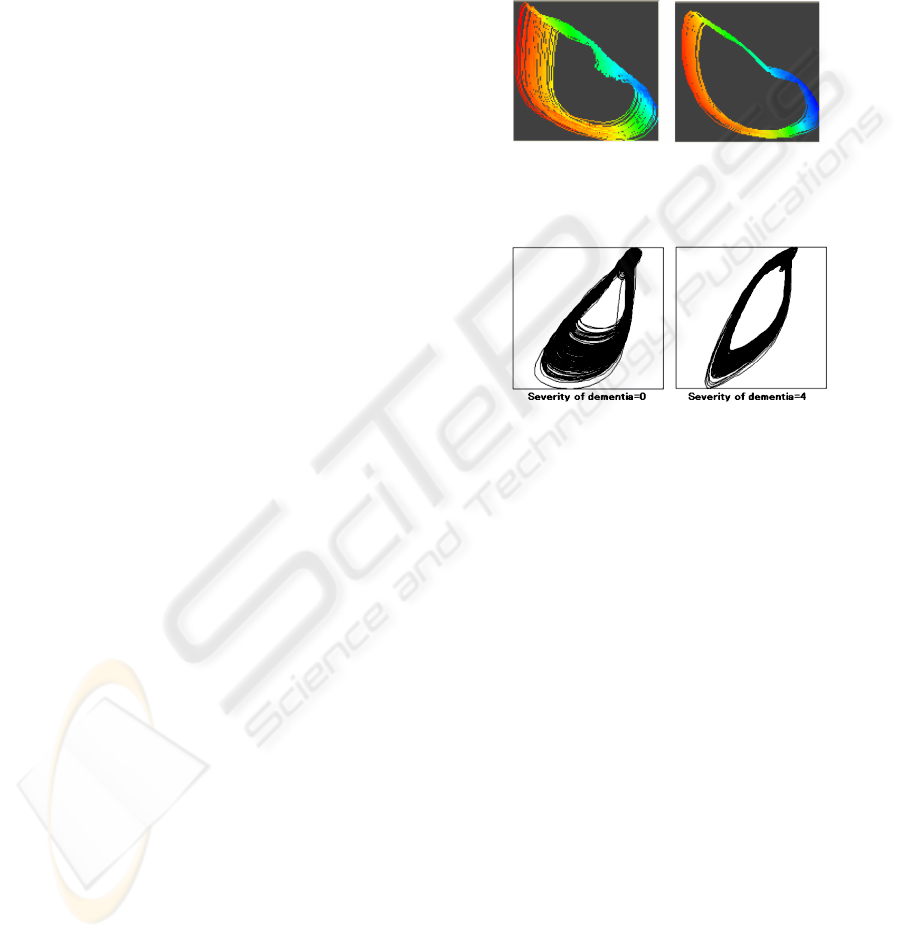
normal state. In examples of the attractors of a
mentally healthy person and patients with depressive
psychosis, the depressed patients have low
divergence (Figure. 5). In patients with dementia,
the divergence becomes smaller as dementia
advances (Figure. 6).
In a normal state, the level of divergence
fluctuates constantly. During times of extreme
tension and stress, the divergence will be
continuously high. Afterward, however, a mentally
healthy person naturally finds a way to relax, which
brings the divergence back to its normal state. A low
level of divergence would continue when a person is
in a depressed state or when age-related dementia is
present. This suggests that the person is incapable of
bringing the divergence back to its natural level on
his or her own, indicating decreased adaptability to
the external environment.
Healthy person Depressed patient
Figure 5: Attractors of a healthy person and a depressed
patient prepared from 30 s of measurements.
Figure 6: Attractors in elderly subjects with dementia of
(severity = 0) and (severity = 4) severity.
4 CASE STUDIES AND A SYSTEM
FOR MENTAL HEALTH
All measurements were taken after obtaining the
informed consent of subjects.
4.1 Studies of Aged Subjects with
Different Communication Skills
Subjects: Data were obtained from 179 subjects (40
males; 139 females) at three nursing homes for the
aged in Shiga prefecture, Japan.
Date of measurement: August to November 2003.
Measurement method: Fingertip pulse waves were
measured three times for 3 min each. Systolic blood
pressure, diastolic blood pressure, pulse, and body
temperature were measured with the patient in a
relaxed state at 25ºC (room temperature) prior to the
measurement of pulse waves.
Indices: Five grades indicating the severity of
dementia judged by a doctor. We obtained data for
the ADL index of communication skills (three-
POSSIBILITY OF MENTAL HEALTH SELF-CHECKS USING DIVERGENCE PROPERTIES OF PULSE WAVES
365
graded evaluation), composed of seven items and
estimated by a care manager. We examined the
relation between the data and the maximum
Lyapunov exponent calculated from the fingertip
pulse waves.
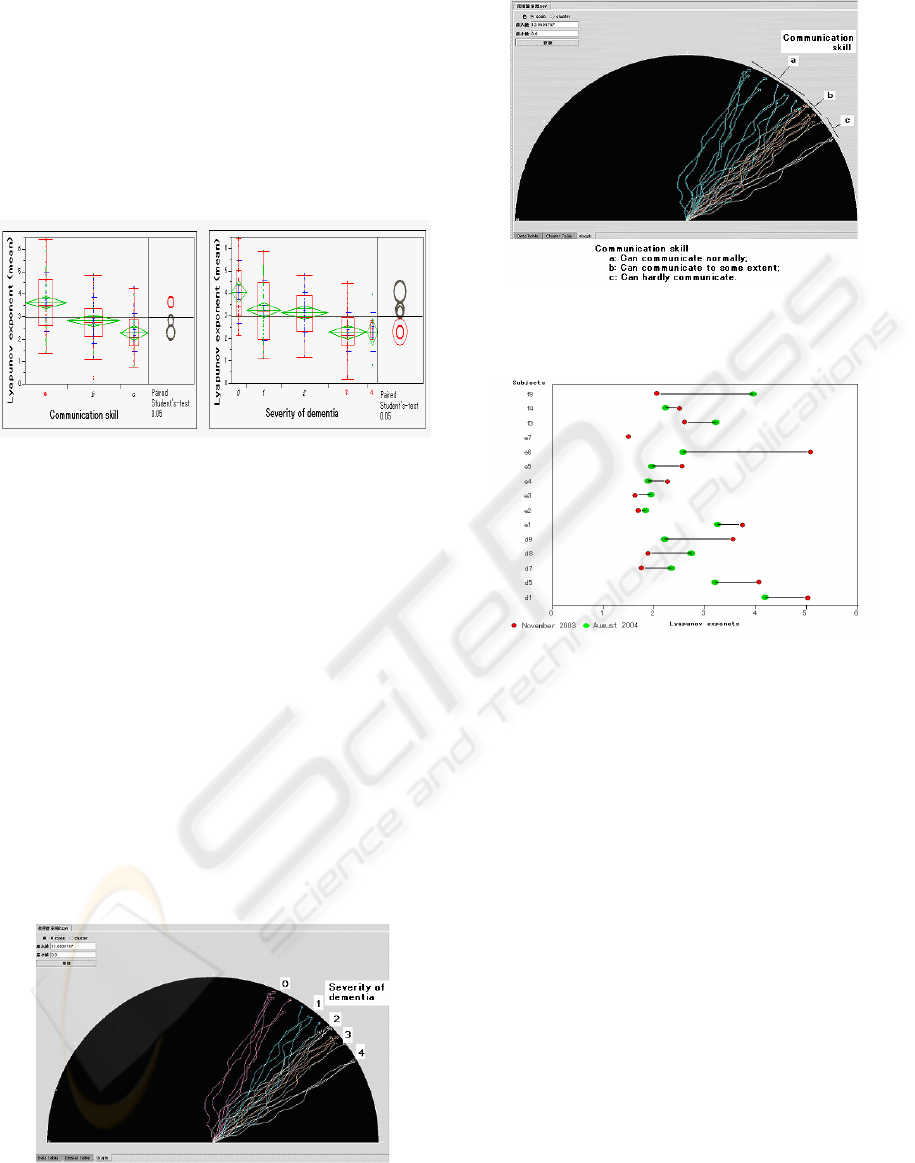
Results: There was a significant relation between
the maximum Lyapunov exponent and
communication skills (Figure 7 A) and severity of
dementia (Figure 7 B). t-student test was used.
Figure 7: Relation of the Lyapunov exponent and (A)
communication skills and (B) severity of dementia in
elderly patients.
In constellation graphs, the right side indicates small
Lyapunov exponents and the left side indicates large
Lyapunov exponents (Figures. 7, 8). Because of the
large quantity of data, five cases that were similar to
the median of data for each rank in index (i.e.,
dementia, 0–4; communication skills, a–c) are
shown.
Fifteen subjects with high cognition were selected
and measurements were retaken after 9 months, in
August 2004 (Figure. 10). Values of the Lyapunov
exponent increased in some subjects and decreased
in others compared to the first measurements taken
in November 2003. These results indicate that
changes in the Lyapunov exponent always occur.
However, attention is needed to understand the
causes of very low values.
Figure 8: Relation between severity of dementia (0–4) and
the Lyapunov exponent. One line indicates one subject.
Figure 9: Relation between communication skills (a–c)
and the Lyapunov exponent. One line indicates one
subject.
Figure 10: Results of the re-measurement of the Lyapunov
exponent after 9 months (15 subjects). Subject e7 had died
prior to the second measurement.
4.2 Case Studies of Maternal
Attachment of Children
Subjects: Data were obtained from 242 children 0-
to 5 years old from nurseries in Osaka and Himeji.
Date of measurement: January 2004–March 2005.
Measurement method: Fingertip pulse waves were
measured twice for 1 min each.
Pulse waves were measured in a relaxed
environment at 25ºC (room temperature). Within the
age range of children tested, 3-year-olds had lower
mean values in the largest Lyapunov exponent than
ones of the other ages. There was a significant
relation between mean values in the largest
Lyapunov exponent and children ages (p < 0.05
using t-student test). Divergence was highest in 0-
year-olds, followed by 1-year-olds and 2-year-olds,
and was lowest in 3-year-olds (Fig. 11). For 3-year-
old children, some widely held beliefs concerning
their states and attachment seemed to correspond
BIOSIGNALS 2008 - International Conference on Bio-inspired Systems and Signal Processing
366
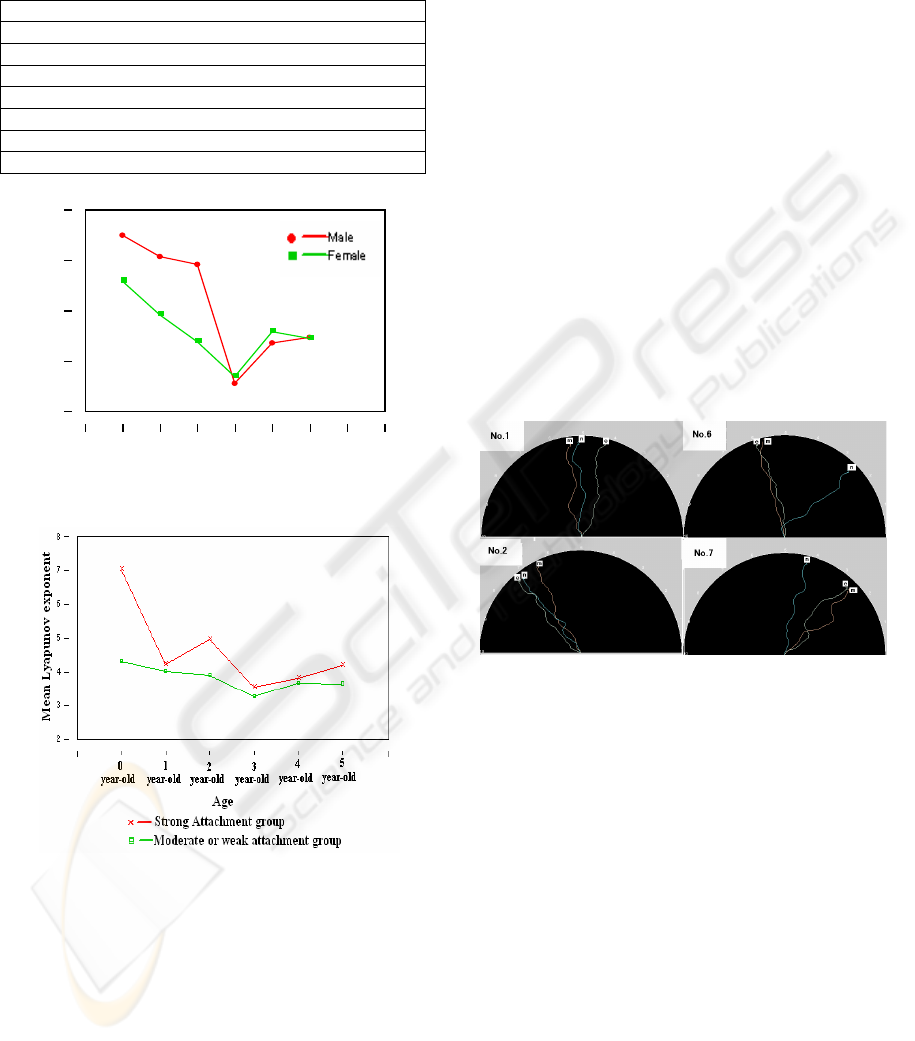
scientifically to the divergence of the attractor
trajectory in pulse waves.
Table 2: Relation between the age and number of children.
Males Females Total
0-year old 2 5 7
1-year old 13 10 23
2-year old 19 13 32
3-year old 27 27 54
4-year old 44 25 69
5-year old 34 23 57
Total 139 103 242
3
3.5
4
4.5
5
Mean Lyapunov exponent
0 1 2 3 4 5
Age
Figure 11: Relation between the Lyapunov exponent and
the age of children (242 subjects).
Figure 12: Relation between the Lyapunov exponent and
maternal attachment to the child.
Additionally, questionnaires were completed by the
mothers to study maternal attachment to the children
(Index: Maternal Attachment Inventory MAI
(Muller, 1994). After measurements were taken, the
children were divided into two groups: a group with
high maternal and a group with low maternal
attachment. There was a significant relation between
attachment and the Lyapunov exponent (p < 0.05
using t-student test; Fig. 12). These results indicate
that problems of maternal attachment are also related
to divergence in children, and could therefore be of
help to mothers in child rearing.
4.3 Studies of Employees and the
Tiredness Index
The Lyapunov exponents of 12 employees of a
specific company were measured three times during
the day: in the morning, immediately after arriving
at the office; in the afternoon, 1 h after lunch; and in
the evening, before leaving the office for the day. At
the same time, the subjects were questioned to
determine their tiredness index. We then examined
the relation between the Lyapunov exponent and the
tiredness index. Changes in the Lyapunov exponent
with the time of day differed among the employees
(Figure. 13). Because the management of mental
health in business has caused many problems,
including occurrences of depression, the Lyapunov
exponent is a useful index not only for employees’
self-management, but also for employers.
Figure 13: Changes in the Lyapunov exponents of
employees of a specific company in the morning,
afternoon, and evening.
The relation of the Lyapunov exponent to the
tiredness index indicated that subjects with a low
Lyapunov exponent in the afternoon tended to have
depressive tendencies and strong anxiety (Table 3).
4.4 Experiments of Arithmetic
Operations
Kraepelin tests that is addition work of numerical
value were conducted twice for 15 min each on
subjects in their 20s and 40s, and changes in the
Lyapunov exponent were studied before and after
the tests. The Lyapunov exponent increased in all
subjects after the Kraepelin test. The subjects gave
the impression that they felt better after the
Kraepelin test than they did before the test (Fig. 14).
POSSIBILITY OF MENTAL HEALTH SELF-CHECKS USING DIVERGENCE PROPERTIES OF PULSE WAVES
367
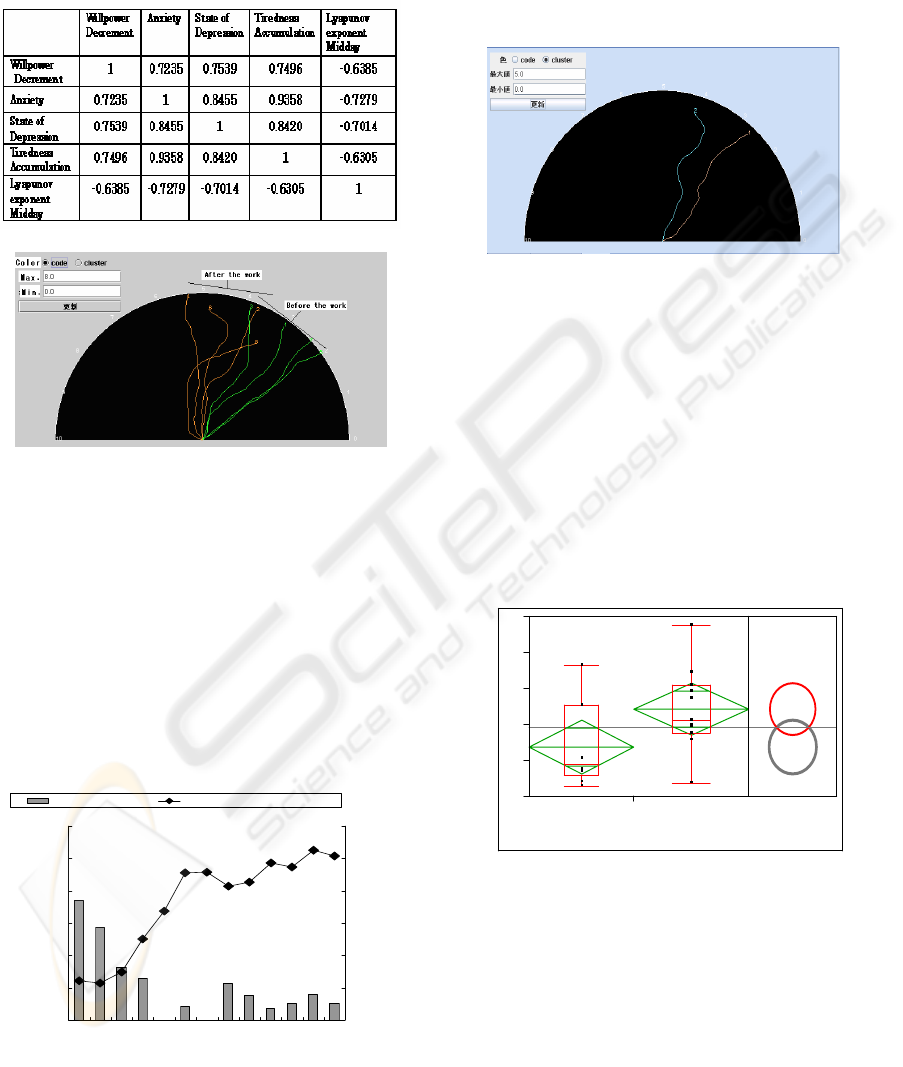
Table 3: Relation between the Lyapunov exponent in the
afternoon and the tiredness index of employees. An
inverse correlation greater than –0.7 means that a low
Lyapunov exponent indicates a depressive tendency and a
strong tendency toward anxiety.
Figure 14: Changes in the Lyapunov exponent before and
after the Kraepelin test.
4.5 Studies of Operation Error in
Monitoring and Judgment Work
An apparatus used to simulate monitoring on a
personal computer was developed to examine the
relation between the Lyapunov exponent and the
human error rate. The experiment was conducted by
increasing the number of monitoring images from
three to six, and then to nine images. In all cases, the
error rate was high when the Lyapunov exponent
was low (Figure. 15).
0
3
6
9
12
15
18
12345678910111213
Blocks
Errors by Block (
%
)
2.8
3
3.2
3.4
3.6
3.8
4
Ly apunov Exponent s by Bl oc
k
Errors b
y
Block L
y
a
p
unov Ex
p
onent s b
y
Block
Figure 15: Relation between the Lyapunov exponent and
human error rate in monitoring work over 30 min.
Symbols and line indicate the Lyapunov exponent by
block (3min); bars indicate the human error rates by block.
4.6 Studies of Painting Work
We measured the Lyapunov exponent when a certain
artist did nothing and again 3 min after he began
painting. The Lyapunov exponent increased while
the artist painted (Figure. 16).
Figure 16: Changes in the Lyapunov exponent while
painting. Orange, before painting; blue, during painting.
4.7 Studies of giving Birth Processes
The Lyapunov exponent was measured in seven
pregnant women before and after giving birth
(obstetrics and gynaecology in Nara city; Figure 17).
Comparisons were made between the values
measured within 1.5 h before birth and after birth.
The Lyapunov exponent was significantly higher
before birth than after birth (Student t-test, p < 0.05).
Giving birth increased the functioning of the
sympathetic nervous system.
1
2
3
4
5
6
Lyapunov
After Before
‚a‚`
ƒyƒA‚²‚Æ
Student‚ÌtŒŸ’è
0.05
Figure 17: Comparison of the Lyapunov exponent
measured in pregnant women within 1.5 h before and 1.5 h
after giving birth.
5 SELF-CHECK SYSTEM
5.1 Equipment Components
A device that is easy to use and gives minimum
burden on the subject is needed to measure the pulse
t-student test
significance 0.05
BIOSIGNALS 2008 - International Conference on Bio-inspired Systems and Signal Processing
368
waves. It is not possible to check the mental health
of a person through just one round of measurements.
For these reasons, the device must be convenient to
use. We took note of the fact many people often do
their work with PCs, and therefore developed a
device that can make these measurements using a
mouse. The pulse wave sensor is installed on one
side of the pulse wave mouse; measurements can be
made by simply touching the sensor with a finger.
The mouse is connected to the PC through a USB
port and can also be used as an ordinary mouse
(patent pending).
Software installed on the PC starts and ends the
measurements, and sets their duration.
5.2 Representation System using
Constellation Graphs in Mental
Health Self-Checks
Previous studies indicated the possibility of using
the Lyapunov exponent as a new psychological
index. However, as noted above, it is dangerous to
judge mental health using only one measurement.
Therefore, even over the period of a single minute,
several measurements are necessary to assess daily
fluctuations. It is also necessary to prepare a self-
feedback system to determine when changes in the
values of the Lyapunov exponent can be observed.
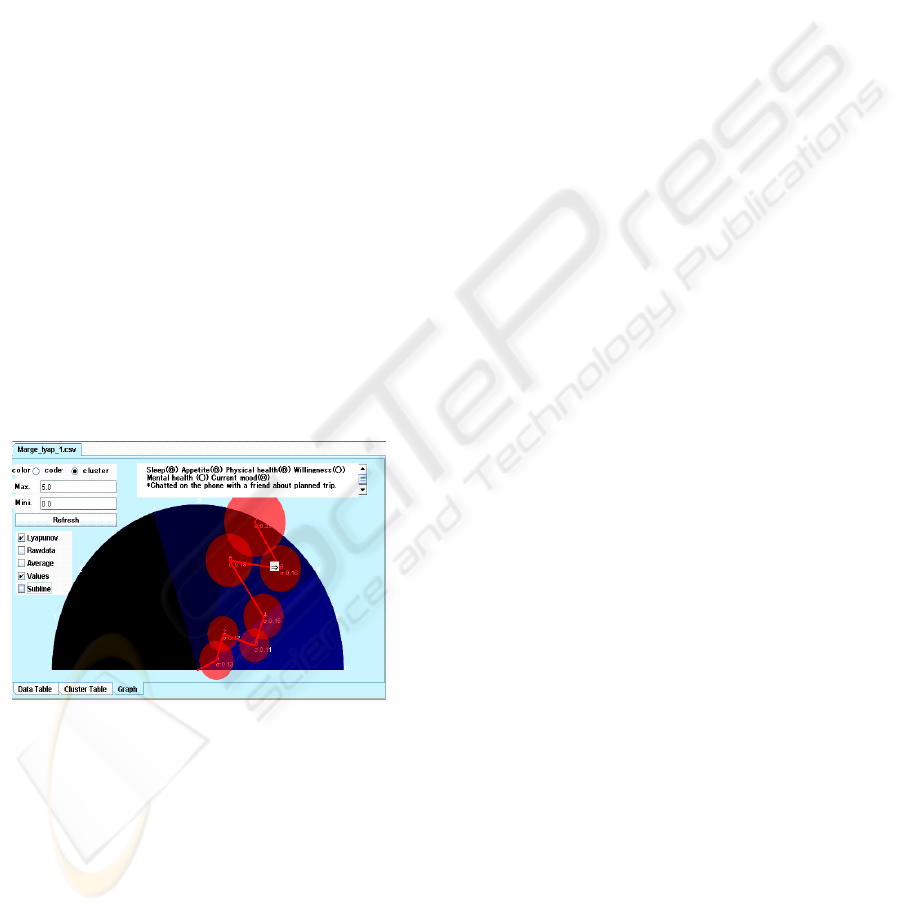
Figure 17: Example of a time series constellation graph for
a self-diagnosis system. The right area of the graph
indicates large Lyapunov exponents; the left area indicates
small Lyapunov exponents. Changes among seven
measurements are shown; circles indicate the standard
deviation of the Lyapunov exponent for each
measurement. If the point constitutes a change, the self-
stated status at that point is shown.
To do this, a time series of the Lyapunov exponent
must be recorded over several days and weeks to
monitor natural variation, and the status of the pulse
wave data should be recorded using simple words or
keywords. To accomplish these measurements, the
development of apparatus capable of taking
measurements easily and of software that can
indicate changes in mental health is necessary (Fig.
17).
5.3 Future Plan and Some Problems
There are three potential types of self-diagnosis
system that use the divergence of fingertip pulse
wave attractor. The first type is the personal
computer (PC)-completed type, in which all
operations from measurement to display are
performed on one PC. In the second type, pulse
wave data stored on a PC are transferred to a server
via the Internet to construct a database. The software
used to analyze the pulse waves on the server is
either downloaded or pulse wave data are sent
through the server. In the third type, a sensor for
taking pulse wave measurements is installed on a
cellular phone and the display of the results is
provided as an image on the cellular phone. In this
case, the Internet is also used. In the second and
third types, results are accumulated in a database via
the Internet, and a system is constructed for an
available search. We expected that data will be
accumulated through Internet use, enabling further
advanced study. However, sufficient caution should
be taken to protect the security of personal
information.
If the self-management of mental health and
early detection and treatment of diseases can be
accomplished using this system, many people might
be saved from terrible situations resulting from
mental problems or instability. In addition, sending
data regarding the mental indexes of humans using a
network may lead to innovations in communication.
However, sufficient care should be taken in the data
management because of recent problems concerning
the protection of personal information. However, in
terms of the effectiveness in promoting further
research, the accumulation of information would be
extremely helpful for various future studies.
6 CONCLUSIONS
Mental management in humans is increasingly
important as society continues to change. Accurate
measurements have been difficult to obtain in the
past using both subjective and objective methods,
and the time and cost required to take brain
measurements have imposed heavy burdens on
patients. Measurement of pulse waves is simple and
POSSIBILITY OF MENTAL HEALTH SELF-CHECKS USING DIVERGENCE PROPERTIES OF PULSE WAVES
369

has the merit of imposing a comparatively minor
burden on the subjects.
The complete realm of information obtainable
from pulse waves has not yet been fully elucidated,
but we have found that the information is deeply
related to the behavior of the autonomous system
networked throughout the body via the spinal cord
from the part of the brain stem responsible for much
of human activity and responses. The divergence of
pulse waves is thought to be the value most related
to the function of the nervous system, including the
sympathetic and parasympathetic nerves that are
integrated with the brain stem. In the future, we plan
to further document these relations through various
experiments.
ACKNOWLEDGEMENTS
We thank all of the people who cooperated with us
in taking measurements.
REFERENCES
http://www9.plala.or.jp/rescue/social.html,
www.chihoucare.org/, http://dementia.prit.go.jp/
Oyama-Higa M., Miao T., and Mizuno-Matsumoto Y.,
2006. Analysis of dementia in aged subjects through
chaos analysis of fingertip pulse waves. 2006 IEEE
Conference on Systems, Man, and Cybernetics,
Taipei, Taiwan, 2863–2867.
Tsuda I., Tahara T., and Iwanaga I., 1992. Chaotic
pulsation in capillary vessels and its dependence on
mental and physical conditions. Int. J. Bifurcation and
Chaos 2: 313–324.
Sumida T., Arimitu Y., Tahara T., and Iwanaga H., 2000.
Mental conditions reflected by the chaos of pulsation
in capillary vessels. Int. J. Bifurcation and Chaos 10:
2245–2255.
Sano M., and Sawada Y., 1985. Measurement of the
Lyapunov spectrum from a chaotic time series. Phys.
Rev. Lett. 55: 1082.
Miao T., Shimoyama O., and Oyama-Higa M., 2006.
Modelling plethysmogram dynamics based on
baroreflex under higher cerebral influences. 2006
IEEE Conference on Systems, Man, and Cybernetics,
Taipei, Taiwan, 2868–2873.
Oyama-Higa M., and Miao T., 2005. Representation of a
physio-psychological index through constellation
graphs. ICNC’05–FSKD’05, http://dx.doi.org/
10.1007/11539087_109.
Oyama-Higa M., and Miao T., 2006. Discovery and
application of new index for cognitive psychology.
2006 IEEE Conference on Systems, Man, and
Cybernetics, Taipei, Taiwan, 2040–2044.
Imanishi A., and Oyama-Higa M., 2006. The relation
between observers’ psychophysiological conditions
and human errors during monitoring task. 2006 IEEE
Conference on Systems, Man, and Cybernetics,
Taipei, Taiwan, 2035–2039.
Oyama-Higa M., Tsujino J., and Tanabiki M., 2006. Does
a mother’s attachment to her child affect biological
information provided by the child? Chaos analysis of
fingertip pulse waves of children. 2006 IEEE
Conference on Systems, Man, and Cybernetics,
Taipei, Taiwan, 2030–2034.
Takens F., 1985. In: Braaksma B. L. J., Broer H. W., and
Takens F., eds. Dynamical Systems and Bifurcations,
Lecture Notes in Math. Vol. 1125. Springer,
Heidelberg.
Takens F., 1981. Detecting Strange Attractors in
Turbulence, Lecture Notes in Math. Vol. 898.
Springer, New York.
Muller, M.E., 1994. Questionnaire to Measure Mother-to
Attachment. Journal of Nursing Measurement, 2(2),
129-141.
BIOSIGNALS 2008 - International Conference on Bio-inspired Systems and Signal Processing
370
