
ANALYSIS OF FOCUSES OF ATTENTION DISTRIBUTION
FOR A NOVEL FACE RECOGNITION SYSTEM
C. Spampinato
Department of Informatics and Telecommunication Engineering, University of Catania
Viale Andrea Doria,6, 95125, Catania, Italy
M. Nicotra, A. Travaglianti
Catania Territorio d’Eccellenza – ICT E1, Municipality of Catania, Viale Vigo, 95100, Catania, Italy
Keywords: Face Recognition, Bottom-up Attentive Analysis, FOAs distribution.
Abstract: In this paper we propose an automated approach to recognize human faces based on the analysis of the
distribution of the focuses of attention (FOAs) that reproduces the ability of the humans in the interpretation
of visual scenes. The analysis of the FOAs (distribution and position), carried out by an efficient and source
light independent visual attention module, allows us to integrate the face features (e.g., eyes, nose, mouth
shape) and the holistic features (the relations between the various parts of the face). Moreover, a remarkable
approach has been developed for skin recognition based on the shifting of the Hue plane in the HSL color
space.
1 INTRODUCTION
Face recognition is a research area of biometrics that
for its complexity and importance is becoming one
of the most interesting topics of study in the image
analysis and understanding field. A general
statement of the face recognition problem is as
follows: given a video image of a scene, identify one
or more persons in the scene using a stored database
of faces. The problem of face recognition is open,
because an effective model has not been proposed
yet, and the shortcomings of these systems are
evident when compared to the human capability to
recognize the faces.
Several approaches for automating the process of
face recognition have been proposed in the last
twenty years. Generally, a face recognition involves
automating three related tasks: 1) Face Detection, 2)
Features Extraction and 3) Face Matching.
The automatic systems have to execute all the
three tasks above.
For face detection the majority of the approaches
are based on the skin pixels segmentation using the
color spaces processing (Brand et al., 2001), (Ikeda,
2003).
An interesting algorithm is proposed in (Phung et
al., 2002) where a human skin color model in the
YCbCr color space is presented, and the k-means
algorithm is proposed for clustering the skin pixels
in three Gaussian clusters. The pixels are considered
belonging to one of three clusters on the basis of the
Mahalanobis distance.
For the face features extraction various methods
have been developed. Methods based on deformable
templates seem to be the most effective. Yuille et al.
(Yuille et al., 1991) describe the use of deformable
templates called “snakes” (Kass et al., 1998), based
on simple geometrical shapes to locate eyes and
mouths. Several methods use the active shape model
(ASMs), (Jiao et al., 1998) and (Wang et al., 2000),
with different approaches (e.g. wavelet, Gabor filter,
etc.) for the detection of the features. Cootes et al.
(Cootes et al., 1995) have proposed an effective
model for interpretation and coding of face images
with results in the range [70%-97%], but in their
approach the landmarks to detect the main facial
features are manually located.
One of the most relevant algorithms for face
matching is the eigenfaces proposed in (Pentland et
al., 1994). The eigenfaces, based on the
eigenpictures, removes the data redundancy within
224
Spampinato C., Nicotra M. and Travaglianti A. (2008).
ANALYSIS OF FOCUSES OF ATTENTION DISTRIBUTION FOR A NOVEL FACE RECOGNITION SYSTEM.
In Proceedings of the First International Conference on Bio-inspired Systems and Signal Processing, pages 224-230
DOI: 10.5220/0001058802240230
Copyright
c
SciTePress

the face images. Other approaches have pointed out
the structural coupling of the face features. One of
the most effective is the Elastic Bunch Graphic
Matching (Wiskott et al., 1997) which uses the
wavelet functions.
All the mentioned methods are not effective in
all the possible scenarios, and require a high
processing time and great amounts of memory for
features storaging.
A techniques commonly used for features
dimensionality reduction are Principal Components
Analysis (PCA) (Yang et al., 2004) and Linear
Discriminant Analysis (LDA) (Etemad et al, 1997).
The main goal of PCA is to reduce the
dimensionality of the data, while retaining as much
as possible of the variation present in the original
dataset. The reduction is obtained by selecting a set
of orthogonal vectors maximizing the variance
overall the samples.
Instead LDA seeks to find the direction in the
dataset that maximizes between-class scatter and
minimizes the within-class scatter.
Although these two methods reduce the space
dimensionality, they face the computational
difficulty when the dimension of the data is too
huge. Moreover a critical issue of the LDA method
is the singularity and instability of the within-class
scatter matrix. Indeed, especially in face recognition
problems, there are a large number of features
available, while the total number of training patterns
is limited, commonly less than the dimension of the
features space. This implies that the within-class
scatter matrix might be singular and instable (Jain et
al, 1982).
In order to overcome the singularity problem, an
alternative method, called Fisherfaces (Belhumeur et
al, 1997), was proposed. Such method is a two stage
dimensionally reduction technique carried out by: 1)
performing PCA to project the n-dimensional image
space onto a lower dimensional subspace and 2)
applying LDA to the best linear discriminant
features on such subspace.
Although Fisherfaces method solves the
singularity problem, often the instability remains a
huge drawback. Several methods, based on
Fisherfaces, were proposed to bypass such limitation
(Liu et al, 1993), (Thomaz et al, 2003).
The aim of our paper is to propose an algorithm
that avoids the computational costs inherent to an
high features space dimensionality by using a
restricted number of features face. Moreover our
method shows a reasonable accuracy comparable
with the best existing methods as shown in the
section results. Sect. 2 outlines the overall face
recognition system, Sect. 3, Sect .4 and Sect. 5
illustrate, respectively, the subsystems Face
Detection, Face Features extraction, and Face
Matching of the algorithm. Results and future work
are focused, respectively, in the last two sections.
2 PROPOSED SYSTEM
Many researchers in computer science, neuroscience
and psychology have pointed out the importance of
either the face features (e.g., mouth shape, nose
shape, etc.) or the holistic features (such as the
distance between the nose and the mouth or the
distance between the eyes, etc.) for the face
recognition. For example, Bruce in (Bruce et al.,
1998) has attentioned the holistic features. Other
studies support the hypothesis that the face
recognition in human relies only on the face features
(e.g., big ears, crooked nose, etc.). For example, in
(Faro et al., 2006) an attentive system, based on the
Itti and Koch model of visual attention (Itti et al.,
2000), recognizes faces by analyzing and classifying
only the face features, located by using the Active
Contour Model and Active Shape Model.
The use of only face features has been criticized,
based on the evidence provided in the Barlett and
Searcy study (Barlett et al., 1993) using the Thatcher
Illusion. In fact, inverting the main features of a face
(i.e. putting the mouth in place of the eyes) the result
is an strange object that is not recognized as a face.
This supports the importance of the holistic
features in the face recognition process.
The proposed recognition system integrates both
theories and is based on the hypothesis that in the
recognition process humans memorize the
distribution of some particular points, called
“focuses of attention” (FOAs) that bind both face
and holistic features. It consists of four main parts
(shown in fig.1):
• Face Detection: by a suitable clustering
algorithm based on color processing;
• Visual Attention for Features Extraction:
where the points of interest are focused by a
pure bottom-up attention module;
• Features Extraction: by a suitable analysis of
the identified FOAs;
• Face Matching: where the features (face and
holistic ones), extracted by the previous module,
are compared with the others stored in the
database for face matching.
The FOA extraction module is based on the
emulation of the human capability to interpret
ANALYSIS OF FOCUSES OF ATTENTION DISTRIBUTION FOR A NOVEL FACE RECOGNITION SYSTEM
225
complex visual scenes. In fact, humans have a
remarkable ability to interpret scenes in real time, in
spite of the limited speed of the neuronal hardware
available for such tasks. Visual processes appear to
select a subset of the available sensory information
before further processing (Tsotsos et al., 1995), most
likely to reduce the complexity of scene analysis.
This selection seems to be implemented in the form
of a spatially circumscribed region of the visual
field, called “focus of attention” (FOA), which scans
the scene (by using sequence of eye movements,
called saccades) both in a rapid, bottom-up,
saliency-driven, and task-independent manner as
well as in a slower, top-down, volition-controlled,
and task-dependent manner. Bottom-up attention
directs the gaze to salient regions (image-based
saliency cues), while topdown attention enables goal
directed visual search (task-dependent cues).
In particular, our algorithm implements the
architecture proposed by Koch and Ullman (Koch et
al., 1985) where human visual search strategies are
explained by the “feature integration theory,” based
on the saliency map that defines the relationships
between the components of a scene depending on
the importance that the components have for the
generic observer.
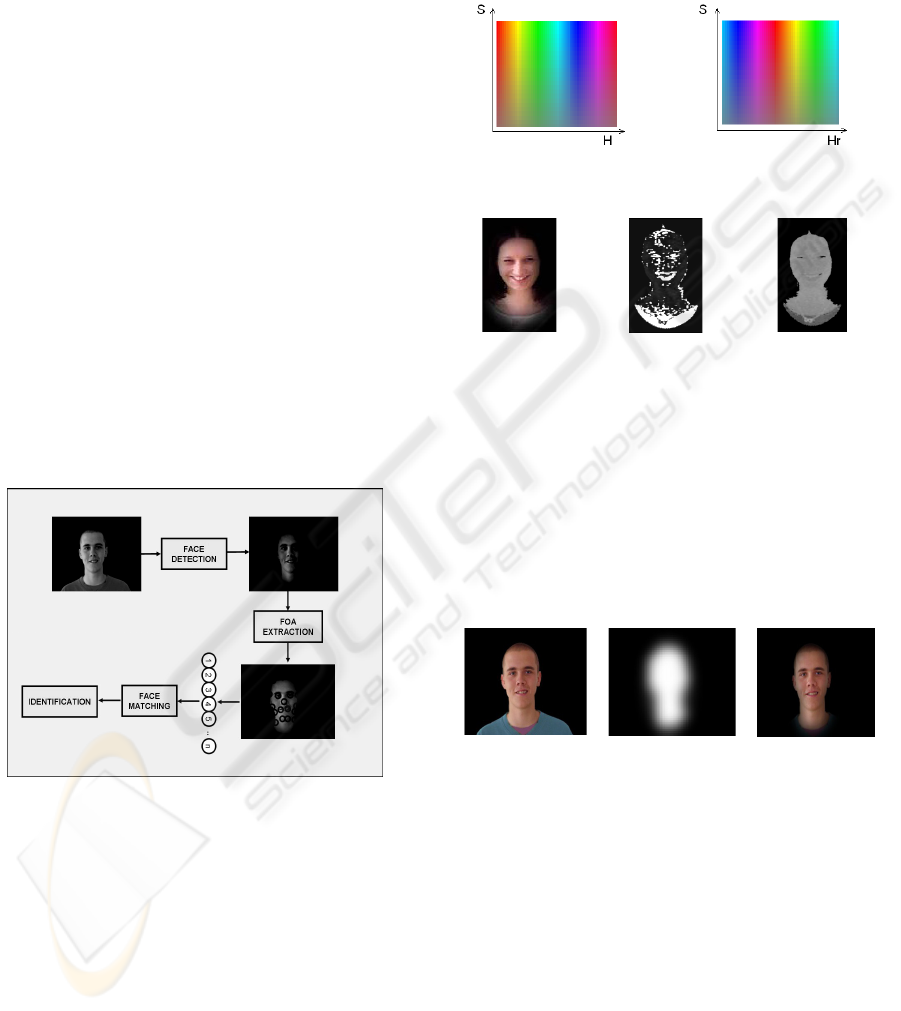
Figure 1: The Overall System.
3 FACE DETECTION
Usually, the face detection process depends strongly
from the illumination of the scene. For this reason in
our algorithm the HSL (Hue, Saturation, Luma)
space color has been chosen. In this space H=0
represents red while H = 255 is violet (fig. 2(a)). For
the Caucasian, Mongolian and American races, the
pixels of the skin are close to the red color, hence for
a better analysis we have defined a new space called
HrSL (Hue centered on Red-Saturation-Luma)
obtained by shifting the HSL space (see Fig. 2). In
the new space the red color is represented by the
value H=127 and not by 0 as in the HSL space. This
shifting allows us to realize an effective thresholding
of the skin pixels as is shown in fig.3.
(a)
(b)
Figure 2: (a) HSL space, (b) HrSL space.
(a)
(b)
(c)
Figure 3: (a) Original Image. Images obtained by a
suitable thresholding in the HSL space (b) and in the
HrSL space (c).
The face detection process (shown in fig. 4) uses a
clustering algorithm, which consists of three steps:
Identification of three clusters ;
Selection of the winner cluster ;
Filtering the input image with a mask
obtained by a smoothing of the winner
cluster
(a)
(b)
(c)
Figure 4: (a) Imput Image, (b) Mask obtained by a
smoothing of the winner cluster, (c) Final Image with face
detection.
More in details the clustering algorithm used is
based on a modified version of the k-means
algorithm. The first step aims to divide the Hr plane
of the input image in a lot of the clusters using the
minimization of the Euclidean Distance between
each one points value of the Hr plane and the
centroid value, which represents the mean of the
values of each one region of the image. A very great
number of cluster produces an increasing of the CPU
time and the merging problem, whereas few clusters
could be non sufficient to separate the main parts of
BIOSIGNALS 2008 - International Conference on Bio-inspired Systems and Signal Processing
226
the Hr plane. In according to experimental test, we
choose three clusters.
After the clustering algorithm we divide the
image in cluster to identify the winner cluster,
which is the cluster whose the RGB value is nearest
at (195,145,155). Applying a suitable filtering we
obtain the face mask that allows us to detect the
face.
4 VISUAL ATTENTION FOR
FEATURES EXTRACTION
The output image of the face detection step is the
input image for the algorithm that extracts features
based on a visual attention system. The visual
attention module proposed in this paper detects
salient regions from a color image simulating
saccades of human vision using a saliency map
similar to the one proposed by Itti & Koch (Itti et al.,
2000). The differences in computing the saliency
map are: 1) we don’t apply Gaussian pyramid, thus
reducing the computational complexity and
increasing the spatial resolution of the processed
images and 2) we don’t use the double color
opponent mechanism, and therefore the dependence
of attention module on the illumination source is
reduced, 3) the HSL space is the best representative
of how the humans perceive the colors.
The first step to compute the saliency map is to
convert the image, obtained by the face detection
module, in the HrSL space. Experimentally, we have
noticed that the Saturation plane is unnecessary for
the computation of the saliency map, while Hr and L
planes allow us, respectively, to detect the contours
and the shapes of the face (e.g. eyes, nose, mouth,
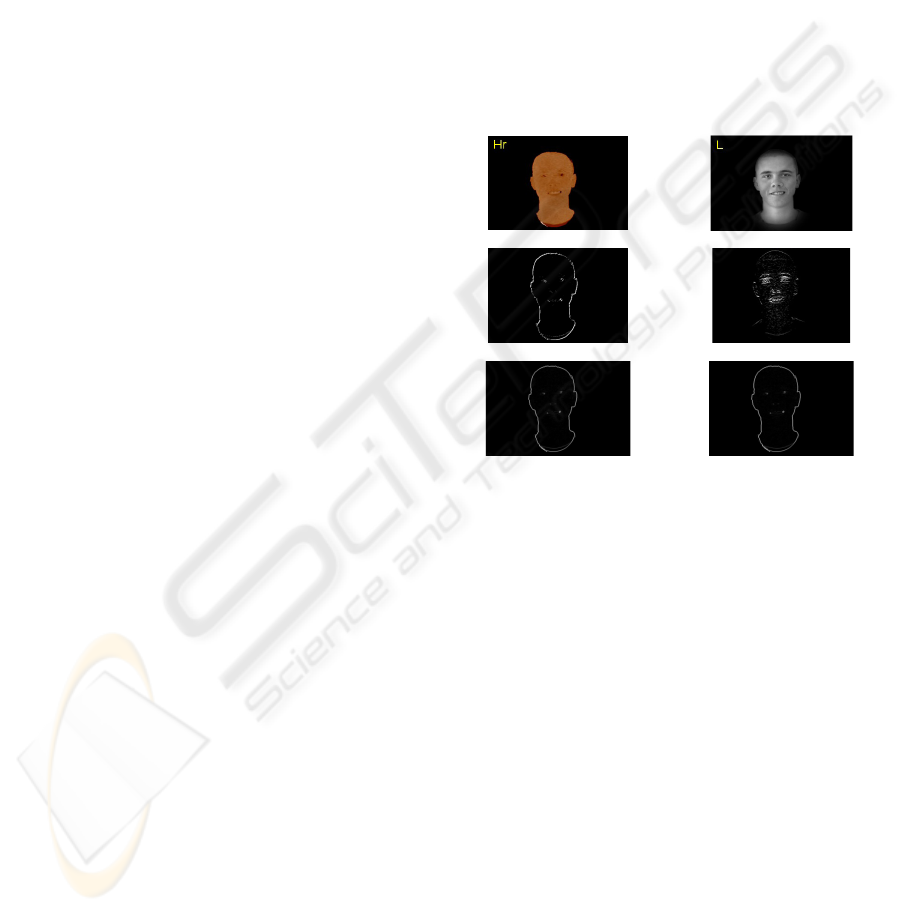
etc…). After having extracted the Hr and L planes,
the following filters have been applied to the both
planes, obtaining the images partially shown in fig. 5:
• Directional Prewitt filters (oriented at 0°,
45°, 90°, 135°) obtaining Hr_Prewitt
0°
,
Hr_Prewitt
45°
, Hr_Prewitt
90°
,
Hr_Prewitt
135°
and L_Prewitt
0°
,
L_Prewitt
45°
, L_Prewitt
90°
,
L_Prewitt
135°
,features;
• Canny Filter to both planes, obtaining the
H
r_Canny_map and L_Canny_map;
The images, processed with the above non-linear
filters, are combined with the aim to obtain the
features maps as follows:
1. All the Hr images processed with Prewitt
filters are summed obtaining the Hr-Prewitt
Features Map;
2. All the L images processed with Prewitt
filters are summed giving more weight to the
90° Map, obtaining the so called L-Prewitt
Features Map;
3. The Hr_Canny map and L_Canny map are
processed using a normalization function N(·)
that implements the mechanism of iterative
spatial inhibition by using the DoG
(Difference of Gaussian) filter proposed in
(Itti et al., 2000). The obtained maps are
called respectively Hr-Edge Map and L-Egde
Map.
(a)
(b)
(c)
(d)
(e)
(f)
Figure 5: (a) Hr plane of the detected face, (b) L plane of
the detected face, (c) Hr-Prewitt
90°
Map, (d) L-Prewitt
90°
Map, (e) Hr-Canny Map, (f) L-Canny Map.
Applying the normalization factor N(·) to both
the Hr-Prewitt Features Map and Hr- Egde-Map
and summing these two maps we obtain the Hr-
Saliency Map (fig.6(a)).
The same procedure is applied for L-Saliency
Map (fig.6(b)) which is obtained by summing the L-
Prewitt Features Map and L-Egde Map. Finally, the
Saliency Map (fig.6(c)) is computed by summing the
L-Saliency (with a greater weight) with the Hr-
Saliency Map.
After having extracted the saliency map, the first
Focus of Attention (FOA) is directed to the most
salient region (the one with the highest grey level in
fig.6(c)).
Afterwards, this region is inhibited according to
a mechanism called inhibition of return (IOR),
allowing the computation of the next FOA.After the
FOAs distribution extraction, a FOAs analysis has
been carried out in order to identify the eyes, the
ANALYSIS OF FOCUSES OF ATTENTION DISTRIBUTION FOR A NOVEL FACE RECOGNITION SYSTEM
227
ellipse surrounding the face and the mouth. For the
eyes position detection, we consider the most two
salient regions of the obtained FOAs distribution.
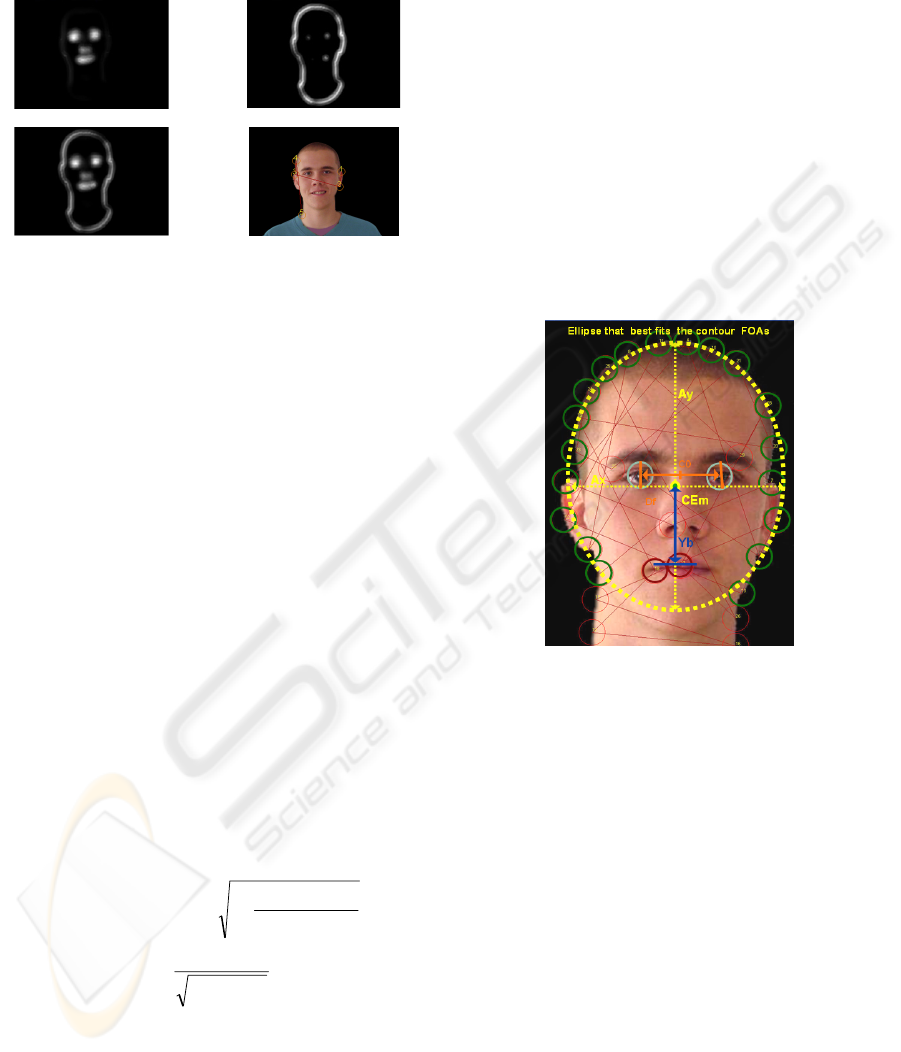
(a)
(b)
( c)
(d)
Figure 6: (a) L_Saliency Map, (b) Hr_Saliency Map, (c)
Saliency Map, (d) Some identified FOAs.
For the ellipse identification the algorithm
computes a set of distances from each extracted
FOA. All the FOAs, which distance by the centre is
greater than a suitable threshold, are considered as
belonging to the face boundaries. By an
interpolation of these FOAs we obtain the searched
ellipse. By analyzing the remaining FOAs, we are
able to extract the mouth. After the feature
extraction the holistic face features have been
extracted.
5 FEATURES EXTRACTION
The aim of this module is to extract the face features
and the holistic features starting from the most
important FOAs previously identified. The identified
holistic features are:
The normalized area (A
N) and the
eccentricity (E) of the ellipse that best fits
the contour FOAs, as described below:
2
2
),max(
),min(
1)(100
yx
yx
xy
AA
AA
AAsignE −⋅−⋅=
22
yx
yx
N
AA
AA
A
+
⋅
=
Where
x
A and
y
A are, respectively, the horizontal
and the vertical axes of the ellipse;
the distance between the central point of
the FOAs eyes (C
0) and the center of the
such ellipse (CEm);
the focal distance between the eyes (C
f);
the vertical distance (Yb) between the
central point of the mouth (C
m) and the
center of the ellipse (CEm);
the distance between the eyes and the
mouth: computed as the distance between
the central point of the eyes FOAs C
0 and
Cm;
the distribution of the 20 most salient
FOAs;
Overall the computed holistic features are shown
in fig.7. For the face features we consider the
position of the most relevant FOAs and starting from
these locations we apply the snakes, as in (Faro et
al., 2006), that allow us to extract the searched
features.
Figure 7: Extracted Holistic Features.
The final step is to match the extracted features
with the ones stored in the database. The considered
features for the matching are:1) FOAs Distribution,
2) Face Features and 3) Holistic Features.
The face matching must be independent from the
rotation, the scaling and the translation. For this
reason the first step is to apply a Procrustes analysis
(Bin et al., 1999) to the FOAs distribution. After this
transformation we extract the holistic (based on the
FOAs distribution) and the face features and finally
we compute the fitting value that is given by the
following formula:
11 2 2 33
F
it T T T
α
αα
=
⋅+ ⋅ + ⋅
where T
1
is the fitting value of the distribution, T
2
the fitting value for the features extracted by using
the FOAs dist., and T
3
the fitting value for the facial
features extracted by deformable models. The
recognized person is the one whose Fit value is the
BIOSIGNALS 2008 - International Conference on Bio-inspired Systems and Signal Processing
228

greatest, and if it is greater than a threshold,
otherwise nobody is recognized.
6 EXPERIMENTAL RESULTS
The proposed method has been tested on a database
of 114 subjects. Each subject is represented by 5
images in different positions (side view with an
angle of 45°, frontal view with serious expression,
side view with angle 135°; frontal view showing no
teeth and frontal view showing the teeth). Each
image is characterized by a spatial resolution of
640*480, with a uniform background and natural
light. Subject’s age is between 18 and 50 years.
For face matching, the features of the side view
with an angle of 45°, frontal view with serious
expression, and side view with angle 135° of each
person have been used to create the face model; the
remaining two images of each person (frontal view
showing no teeth and frontal view showing the
teeth) have been used for the testing phase.
Concerning face detection, the success rate is
100%. For the features extraction on all the detected
images, the percentage of success is about 93%. The
66% of the images whose features have been
extracted correctly, has been used for the model face
creation. The test for face identification has been
carried out on the remaining images (181 images,
corresponding to the 34%).
The experimental results are shown in Table 1.
Table 1: Experimental results.
Algorithm
N° Test
images
Correct
Evaluation
Success
rate
Face
Detection
570 570 100 %
Features
Extraction
570 531 93.1%
Face
Matching
181 170 93.9%
The overall recognition rate of our method is
87.42%. The classification performances are more
than satisfying, especially if compared with other
well-know methods in literature. Indeed Eigenfaces
(Pentland et al., 1994) shows an average recognition
rate of 88.0%, Fisherfaces(Belhumeur et al, 1997)
86%, Liu Method(Liu et al, 1993) 86.5%.
7 CONCLUSIONS AND FUTURE
WORKS
An automated face recognition system based on the
emulation of the human capability to interpret
complex visual scenes has been proposed. The
system proves effective due to the integration of the
face and holistic features.
This integration is attained by applying both the
FOAs distribution analysis and the algorithm
proposed in (Etemad et al, 1997).
An important peculiarity of the system is the
independence from both the illumination source and
the dimension of the face to be recognized. The
independence from the illumination source has been
obtained by using the proposed HrSL color space.
Moreover, the HrSL allows us to best detect the
skin pixels. The independence from the face
dimension has been carried out adopting the
Procrustes analysis.
An improvement that generalizes the system
regards the face detection module; in fact, the high
accuracy of the method is due to the background
uniformity of the used images. In other cases for a
better clustering it will be necessary to associate at
the color processing module a spatial processing
system.
In addition, the system is set to work only with
Caucasian, Mongolian and American races; for a
correct functioning with the other races it is
sufficient to shift the Hue color plane. Although the
features extraction and the face matching systems
have shown good results, they should be tested
especially with different face images with different
orientation and non-uniform background.
For this reason it will be very interesting to
develop a parallel system able to analyze at the same
time different locations of the scene, especially for
complex scenes with many faces and other objects.
Finally, we plan to apply the proposed approach
not only for face recognition but also for gesture
recognition.
ACKNOWLEDGEMENTS
This paper has been partially supported by the
project “Catania Territorio d’eccellenza – ICT E1”
of the Catania municipality. Moreover we would to
thank the CVL and ŠCV, PTERŠ, Velenje for the
face database.
ANALYSIS OF FOCUSES OF ATTENTION DISTRIBUTION FOR A NOVEL FACE RECOGNITION SYSTEM
229

REFERENCES
Brand, J.D., Mason, J.S.D., Pawlewski, M.: Face
detection in colour images, Proceedings of the IEEE
ICIP 2001, Thessaloniki, Greece, October 7-10, 2001.
Ikeda, O.: Segmentation of faces in video footage using
HSV color for face detection and image retrieval,
Proceedings of the IEEE ICIP 2003, Barcelona,
Catalonia, Spain, September 14-18, 2003.
Phung, S.L., Bouzerdoum, A., Chai, D.: A novel skin
color model in YCbCr color space and its application
to human face detection, Proceedings of the IEEE
ICIP 2002, Rochester, New York, USA, September
22-25, 2002.
Yuille, A. L.: Deformable templates for face detection
Journal of Cognitive Neuroscience, Vol. 3, No. 1, pp.
59-70, 1991.
Kass, M., Witkin, A., Terzopoulos, D.: Snakes: Active
countorn models, International Journal of Computer
Vision, pages 321–331, 1998.
Jiao, F., Li, S., Shum, H. and Schuurmans, D.: Face
allignment using statistical models and wavelet
features. Proc. of CVPR’03 IEEE, pages 1063–1069,
2003.
Wang, W., Shan, S., Gao, W., Cao, B. and Baocai, Y.: An
improved active shape model for face alignment.
Vision Research, 40:1489–1506, 2000.
Cootes, T. F., Taylor, C. J., Cooper, D. H. and Graham,
J.: Active shape model their training and application.
Computer vision graphics and image understanding,
61:38–59, 1995.
Pentlad, A., Moghaddam, B., Starner, T. , Oliyide, O. and
Turk, M.: View based and modular eigeispaces for
face recogntion. M.I.T. Media Laboratory, Percentual
Computing section-Technical report, 245, 1994.
Wiskott. L., Fellous, J.-M., and von der Malsburg, C.:Face
Recognition by Elastic Bunch Graph Matching, IEEE
Trans. on PAMI, Vol.19, pp.775-779, 1997.
Yang, J., Zhang, D., Frangi, A.F., Yang, J.Y., Two
dimensional PCA: a new approach to appearance-
based face representation and recognition”, IEEE
Trans. On PAMI, Vol.26, No.1, pp 131-137, 2004.
Etemad, K., Chellapa, R.: Discrimant analysis for
recognition of human face images, Journal of the
Optical Society of America A, Vol.14, No.8, pp.1724-
1733, 1997.
Jain, A.K., Chandrasekaran, B.: Dimensionality and
sample size consideration in pattern recognition
practice, Handbook of Statistics, P.R. Krishnaiah and
L.N. Kanal Eds., North Holland, vol.2, pp.835-855,
1982.
Belhumeur, P.N., Hespandha, J.P., Kriegman, D.J.,
“Eigenfaces vs Fisherfaces recognition using class
specific linear projection”, IEEE Trans. On PAMI,
Vol.19, No.7, pp.711-729, 1997.
Liu, K., Cheng, Y.Q., Yang, J.Y., Algebraic feature
extraction for image recognition based on an optimal
discriminant criterion”, Pattern Recognition, Vol.26,
No. 6, pp 903-911, 1993.
Thomaz, C.E., Gillies, D. F., A new Fisher-Based method
applied to Face Recognition, Lecture Notes on
Computer Science 2756, pp.596-605, 2003.
Bruce, V., Hancock, P., and Burton, A.: Human face
perception and identification, In Wechsler, Philips,
Bruce, Fogelman-Soulie, and Huang, editors, Face
Recognition: From Theory to Applications, pages 5 1-
72. Springer-Verlag, 1998.
Faro, A., Giordano, D. and Spampinato, C.: An
Automated Tool For Face Recognition using Visual
Attention and Active Shape Model Analysis, Proc. of
IEEE EMBC 2006, New York, USA, August 29-30,
2006.
Itti, L. and Koch, C.: A saliency-based search mechanism
for overt and covert shifts of visual attention. Vision
Research, 40:1489–1506, 2000.
Barlett, J. C., Searcy, J.: Inversion and Configuration of
Faces, Cognitive Psychology 25, 281-316, 1993.
Tsotsos, J.K., Culhane, S.M. , Wai, W.Y.K., Lai, Y.H. ,
Davis, N. and Nuflo, F.: Modelling Visual Attention
via Selective Tuning,” Artificial Intelligence, vol. 78,
no. 1-2, pp. 507–545, Oct. 1995.
Koch, C. and Ullman, S. : Shifts in Selective Visual
Attention: Towards the Underlying Neural Circuitry,”
Human Neurobiology, vol. 4, pp. 219–227, 1985.
Bin L., Hancock, E.R.: Matching Point-sets using
Procrustes Alignment and the EM Algorithm, Proc. of
BMV99, Manchester, United Kingdom, July 1999.
BIOSIGNALS 2008 - International Conference on Bio-inspired Systems and Signal Processing
230
