
ACOUSTIC INDICES OF CARDIAC FUNCTIONALITY
Guy Amit
1
, Jonathan Lessick
2,3
1
School of Computer Science, Tel-AvivUniversity, Tel-Aviv, Israel
2
Department of Cardiology, Rambam Medical Center, Haifa, Israel
Noam Gavriely
3
, Nathan Intrator
1
3
Rappaport Faculty of Medicine, Technion-Israel Institute of Technology, Haifa, Israel
Keywords: Heart sounds, time-frequency analysis, feature extraction, cardiac functionality.
Abstract: The mechanical processes of the cardiac cycle generate vibratory and acoustic signals that are received on
the chest wall. We describe signal processing and feature extraction methods utilizing these signals for
continuous non-invasive monitoring of cardiac systolic function. Vibro-acoustic heart signals were acquired
from eleven subjects during a routine pharmacological stress echocardiography test. Principal component
analysis, applied to the joint time-frequency distribution of the first heart sound (S1), revealed a pattern of
an increase in the spectral energy and the frequency bandwidth of the signal associated with the increase of
cardiac contractility during the stress test. Novel acoustic indices of S1 that compactly describe this pattern
showed good linear correlation with reference indices of systolic functionality estimated by strain-
echocardiography. The acoustic indices may therefore be used to improve monitoring and diagnosis of
cardiac systolic dysfunctions.
1 INTRODUCTION
The human heart is a mechanical system whose
primary function is to pump blood throughout the
body in order to provide adequate perfusion of
organs. This function is achieved by a complex
interplay between the cardiac muscle, the vascular
system and the blood, highly regulated by
mechanical and neural control mechanisms.
Cardiovascular diseases, such as coronary artery
disease, hypertension and cardiomyopathy, may
impair the mechanical functionality of the heart,
leading to the clinical syndrome of heart failure
(HF). As these diseases are major public health
problems worldwide, technologies for improving
early diagnosis and patient monitoring are essential.
The low-frequency vibratory and acoustic
signals, produced by the mechanical processes of the
cardiac cycle and received on the chest wall, provide
a direct and simple way for assessing the mechanical
functionality of the cardiovascular system (Tavel,
1978). However, the utilization of these signals in
the clinical setting has been mostly limited to
qualitative assessment by manual methods, as
research and development efforts in recent years
focused on modern imaging technologies such as
echocardiography and cardiac computerized
tomography. These valuable techniques require
complex equipment, as well as expert operators and
interpreters. In particular, these imaging tools can
not be used continuously or outside of the hospital
environment. Consequently, long-term non-invasive
monitoring of mechanical functionality remains
unavailable in the common medical practice.
In this work, we revisit the problem of
quantitative analysis of mechanical vibro-acoustic
heart signals using modern signal processing tools.
In an earlier study, we have shown the feasibility of
using vibro-acoustic signals to extract temporal
information about the phases of the cardiac cycle
(Amit, 2005). In the current study, we address the
potential of continuously assessing the global
systolic functionality of the left ventricle using
indices extracted from the first heart sound, S1.
According to Rushmer’s theory of the origin of heart
sounds, S1 is generated by the vibrations of the
entire cardiohemic system, as a result of blood
acceleration and deceleration following the onset of
ventricular contraction and the closure of the
77
Amit G., Lessick J., Gavriely N. and Intrator N. (2008).
ACOUSTIC INDICES OF CARDIAC FUNCTIONALITY.
In Proceedings of the First International Conference on Bio-inspired Systems and Signal Processing, pages 77-83
DOI: 10.5220/0001058700770083
Copyright
c
SciTePress

atrioventricular valves (Rushmer, 1978). The
amplitude of S1 has been previously shown to be
related to the pressure gradient (dP/dt) developing in
the left ventricle during isovolumetric contraction
(Sakamoto, 1965). A good correlation was also
reported between dP/dt and the instantaneous
frequency of S1 (Chen, 1997). While these previous
studies were performed on anesthetized dogs, the
relation between the characteristics of S1 and global
left-ventricular systolic functionality has not been
studied in humans in routine clinical settings.
We study the relationship between acoustic
indices, extracted from the time-frequency energy
distribution of S1, and reference echocardiographic
indices that are related to left-ventricular systolic
functionality. To achieve dynamic, yet controllable,
hemodynamic conditions, we used clinical settings
of a routine echocardiography pharmacological
stress test. In the following sections, we describe the
signal processing and feature extraction methods
applied to the vibro-acoustic heart signal, introduce
novel acoustic indices of systolic functionality and
present quantitative results on the correlation
between these indices and echocardiography-derived
measures. We conclude by discussing the potential
applicability of our methods for continuous non-
invasive monitoring of cardiac systolic function.
2 METHODS
2.1 Patients and Protocol
The study was approved by the local ethics
committee for medical research. Data was acquired
from eleven male subjects of ages 36-79 (mean
60±14), referred to a routine Dobutamine stress echo
test (DSE) for assessment of ischemic heart disease.
The referral indications included positive ergometry
stress test, atypical chest pain and chest pain during
physical activity. Two of the subjects had a history
of coronary artery disease. These two subjects were
diagnosed as positive for myocardial ischemia in the
DSE test. The remaining nine patients were
diagnosed as negative for ischemic heart disease.
Prior to data recording, the patients signed an
informed consent form. The standard DSE protocol
consisted of four 3-minute stages of increasing
Dobutamine dosage, from 10 to 40µg/kg/min. If the
target heart rate, defined as 0.85 * (220 – Age), was
not achieved at the end of the final stage, 0·25 mg
boluses of atropine were given at 1-min intervals, up
to a maximum of 1 mg.
2.2 Data Acquisition
Vibro-acoustic heart signals were recorded using a
digital data acquisition system constructed in our
lab. The system consisted of 4 piezoelectric contact
transducers (PPG Sensor Model 3, OHK Medical
Devices, Haifa, Israel), an ECG sensor (EKG-BTA,
Vernier Software & Technology, Beaverton, OR), a
preamplifier with high input impedance and a linear
frequency range of 1Hz – 4KHz (A.S. ZLIL, Bnei-
Brak, Israel), a 16-bit analog-to-digital converter
(PMD-1608FS, Measurement Computing Corp.,
Norton, MA), and a designated signal recording
software running on a portable personal computer.
The transducers were placed at the apex area, the
aortic and pulmonary areas (second
intercostal
space, right and left sternal border, respectively) and
at the right carotid artery, and were firmly attached
using either elastic straps or adhesive bands. The
patients were lying on their left side. Vibro-acoustic
and ECG signals were continuously recorded during
the stress test (30-45 minutes long) at a sample rate
of 4KHz. Echocardiography images were acquired
using a GE Vivid 7 ultrasound machine (General
Electric Healthcare, Wauwatosa, WI). Two-
dimensional echo cine loops of a single heart beat
were captured before the beginning of the stress test
(baseline), during each stage of the test and
following the test (recovery), from three apical
views (4-chamber, 2-chamber and apical long axis)
at a high frame rate of 70-100 FPS.
2.3 Echo Data Processing
The captured echo cine loops were post-processed
using EchoPAC Dimension ’06 software (GE
Healthcare Wauwatosa, WI) in order to extract
quantitative echocardiographic indices of systolic
functionality. The indices used were peak systolic
velocity (PSV) and peak systolic strain rate (PSSR),
shown to be strongly correlated with left-ventricular
systolic functionality (Greenberg, 2002). These
indices were first calculated separately for each
cardiac wall (septal, lateral, inferior, anterior,
posterior, and anteroseptal) and for three segments
per wall (basal, middle and apical), and then
averaged to obtain a global functionality index.
Index calculation was done using 2D strain analysis,
based on speckle tracking technique. This modality
allows objective analysis of the entire myocardial
motion throughout the heart cycle by tracking
natural acoustic markers in the image. It was shown
to provide accurate strain measurements, compared
with tagged MRI (Amundsen, 2006). Strain indices
BIOSIGNALS 2008 - International Conference on Bio-inspired Systems and Signal Processing
78
were successfully calculated for 10 patients. One
patient was excluded due to inadequate quality of
the captured echo images.
2.4 Acoustic Signal Processing
Each of the four recorded signal channels was first
pre-processed by a applying a digital band-pass filter
in the frequency range of 20-250Hz (Figure 1a). The
signal was then partitioned into cardiac cycles using
the peaks of the ECG-QRS complexes as reference
points (Figure 1b). Signal segments with noisy ECG
were excluded from the analysis. The signal cycles
were aligned by their starting points and their
amplitudes were color-coded to create a two-
dimensional signal map, showing the time-domain
dynamics of the first and second heart sounds
throughout the stress test (Figure 1c). Fast Fourier
transform (FFT) was applied to each cycle of the
first heart sound (S1), defined as the cycle segment
from 50ms before the QRS peak to 200ms after the
QRS peak. The logarithm of the power spectrums
was color-coded to generate a spectral map of S1
throughout the recording (Figure 1d).
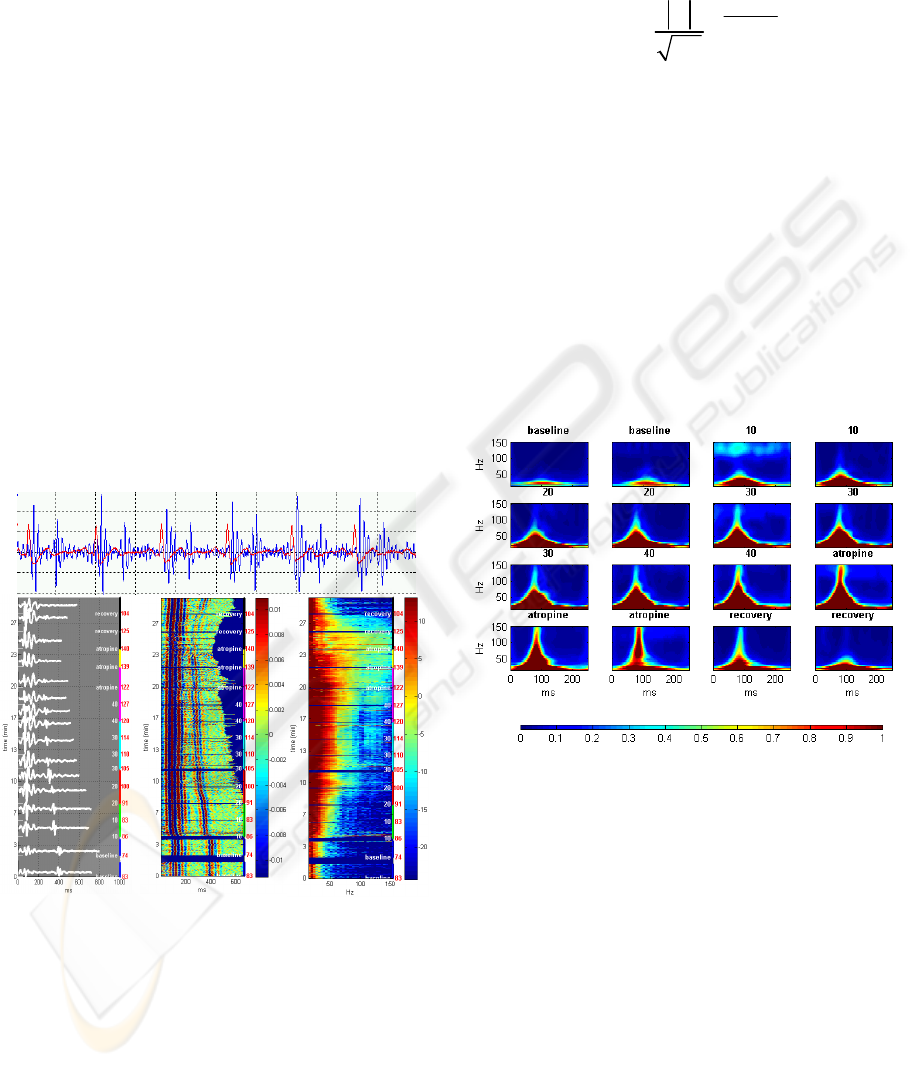
(a)
(b) (c) (d)
Figure 1: Generation of time-domain and frequency-
domain signal maps in a healthy subject: (a) the heart
sound signal (blue), segmented using the ECG (red). (b)
aligned multiple sound signal cycles throughout the test
(left y-axis), with heart rate (red labels) and test staged
(white labels and colored segments), (c) continuous color-
coded map of segmented sound signals (d) continuous
color-coded power spectrum of the first heart sound (S1).
In order to characterize the joint time-frequency
energy distribution of S1, S-transform was applied
to each cycle of S1. S-transform (Stockwell, 1996) is
a linear transform that provides frequency-dependent
resolution, while maintaining a direct relationship
with the Fourier spectrum. It is defined by:
22
(-)
-
-2
2
(, ) ()
2
tf
ift
f
Sf st e e dt
τ
π
τ
π
ℜ
=
∫
Where s(t) is the original signal, τ is the time delay
and f is the frequency. The progressive resolution of
the transform provides a time-frequency resolution
superior to Fourier-based techniques, while its
linearity ensures accurate decomposition without
artifactual cross-terms that are typical to quadratic
transforms. S-transform is therefore suitable for
analysis of non-stationary multi-component signals
such as heart sounds.
After applying S-transform to each cycle of S1, the
resulting time-frequency representations were
grouped by the stages of the stress test and averaged
to produce a small number of representative time-
frequency maps (
Figure 2).
Figure 2: S-transform time-frequency representation of S1
acoustic signal obtained in a representative healthy subject
during the stages of the stress test. Each plot represents an
average of the S-transform of all S1 cycles over a
specified period of the test.
2.5 Acoustic Feature Extraction
The purpose of feature extraction is to find a
compact representation of high dimensional data,
without significant loss of information content.
Principal component analysis (PCA) is a well-
known statistical technique for dimensionality
reduction (Duda, 1973). The principle of PCA is to
project the data on a new orthogonal basis, such that
the variances of the linearly transformed data are
sorted in descending order along the coordinates,
with the maximal variance on the first coordinate
ACOUSTIC INDICES OF CARDIAC FUNCTIONALITY
79
(first principle component), the second largest
variance on the second coordinate, and so on. The
projection of the original data on the first few
principal components provides a low-dimensional
representation of the data, which emphasizes the
significant features (in terms of statistical
variability) in the data. The choice of the significant
principal components is done by examining their
associated eigenvalues.
PCA was applied on the aggregation of
segmented S1 signals. The analysis was performed
on both the frequency domain spectral maps (Figure
1d) and on the time-frequency representations
produced by the S-transform (Figure 2), vectorized
by concatenating adjacent columns. The most
significant principal components, having
eigenvalues greater than 10% of the first eigenvalue,
were selected and weighted by their relative
eigenvalues. The projection of the data on this
weighted combination of the significant principal
components was chosen as a one-dimensional
feature representing the dynamic characteristics of
the acoustic signal during the stress test. To obtain
an interpretable trend line, this feature was
normalized by the median value of the baseline stage
and smoothed by a moving average filter. The
resulting index, denoted acoustic variability index
(AVI) is interpreted as the trend of relative change in
the spectral energy distribution of S1.
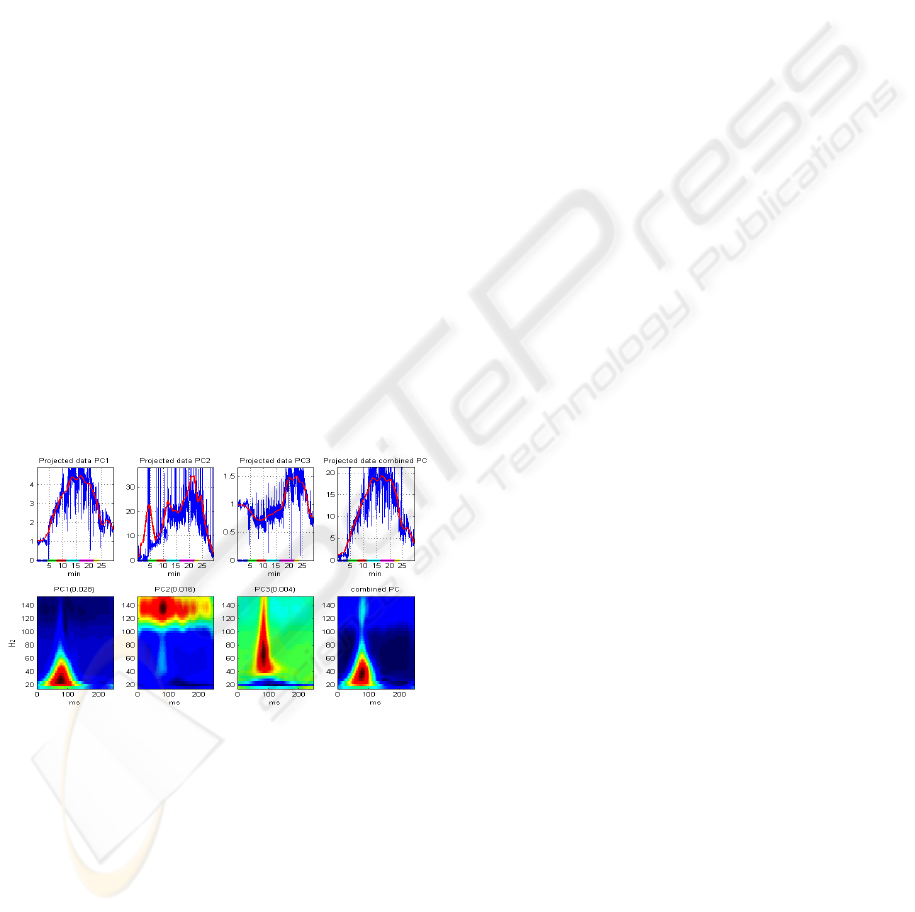
Figure 3: Principal component analysis applied to the
vectroized time-frequency representation of S1 cycles
during a stress test. The bottom plots show the coefficients
of the first 3 principal components (PC), and their linear
combination, weighted by the eigenvalues (shown in
parenthesis). The upper plots show the AVI index during
the entire stress test, obtained by projecting the data on the
respective PC. The red lines are the result of smoothing
the projected data with a moving-average filter.
Figure
3 illustrates an example of applying PCA to
the time-frequency data shown in
Figure 2, and
calculating the time-frequency AVI.
A second feature extracted from the spectrum of
each cycle of S1 was the frequency bandwidth of the
signal, defined by the highest frequency with
significant energy content. Prior to calculating this
feature, signal cycles with a high wide-band energy
content, compared to their local environment, were
classified as noise and excluded from further
processing. The bandwidth feature was calculated
for each cycle by searching the spectrum for the first
frequency whose energy is at least 10dB below the
maximal energy. The feature trend line obtained
from all cycles was normalized by the median value
of the baseline stage, and denoted Acosutic Spectral
Index (ASI).
3 RESULTS
The color-coded signal map in figure 1c illustrates
the time-domain characteristics of the heart sound
signal during the stress test. As expected, there are
noticeable changes in the duration of ventricular
systole and diastole, as the heart rate increases in
exercise and decreases in recovery. However, there
are no apparent morphological changes in the signal
that can be associated with the stress response.
Fourier analysis uncovers a pattern of an ascent in
the spectral energy of the first heart sound as the
Dobutamine dose is increased, and a descent back to
baseline levels during recovery figure 1d. In addition
to the overall energy rise, there is also an increase in
the frequency bandwidth of S1, as higher frequency
components in the range of 50-150Hz emerge and
strengthen. The time-frequency representation,
obtained by S-transform, enables localization of
these spectral changes in time (Figure 2): the high-
frequency components are centered about 80ms after
the beginning of the signal (30ms after the peak of
ECG-QRS complex), growing up to 150Hz in the
highest Dobutamine dose, then falling back to the
baseline upper-limit frequency of 50Hz in the
recovery phase. There is no apparent time shift of
the signal’s energy distribution throughout the test.
Principal component analysis, applied to the
spectral maps of S1, was able to identify the major
frequency bands that contribute to the data
variability. When applied to the vectorized time-
frequency distributions, PCA also pointed out the
temporal location of these frequency bands. Figure 3
shows a representative example of the coefficients of
the first three principal components (PC), and the
projection of the time-frequency data on these
principal components. The first PC, representing the
axis with the largest data variability, captures the
BIOSIGNALS 2008 - International Conference on Bio-inspired Systems and Signal Processing
80
pattern already observed qualitatively in the time-
frequency distributions in
Figure 2: it varies from
30ms to 120ms relative to the beginning of the
cycle, and from frequency of 20Hz to 70Hz, thus
showing the strengthening of the signal’s low-
frequency components. The second PC captures the
variability of the high frequency components
between 110 to 150Hz for the entire duration of the
S1 signal. The third PC shows a wide-band
variability of frequency ranging from 40Hz to
150Hz, localized in time around 80ms from the
beginning of the cycle. This component strengthens
during the peak stress response. A combination of
the most significant principal components, weighted
by their eigenvalues, and the projection of the data
on this combined PC provide a one-dimensional
feature, denoted time-frequency acoustic variability
index (TF-AVI), which summarizes the dynamics of
the joint time-frequency energy distribution of S1
throughout the stress test.
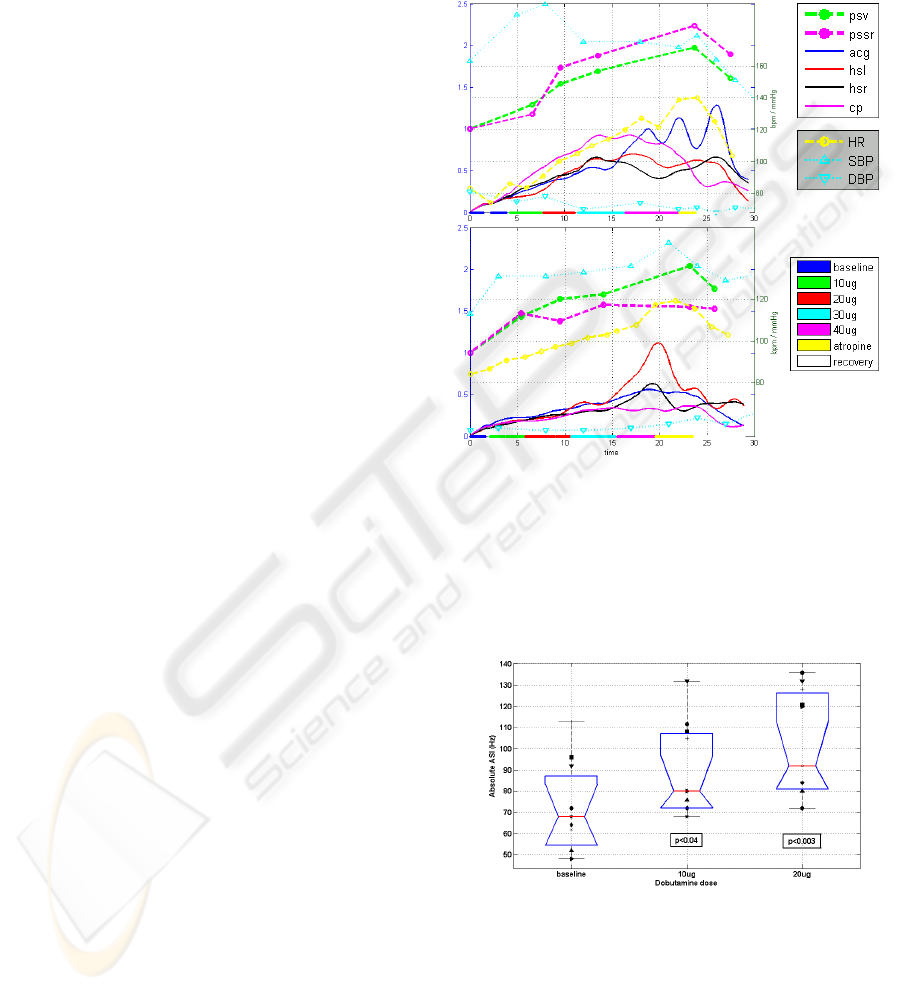
The TF-AVI trend lines, extracted separately
from each of the four transducers in two
representative subjects are plotted in Figure 4, along
with the stages of the stress test, the heart rate and
blood pressure trends and the relative change in the
echocardiographic indices of peak systolic velocity
(PSV) and peak systolic strain rate (PSSR). While
the TF-AVI provides a continuous line with one
point per cardiac cycle, the reference
echocardiographic indices are available only at
discrete time points of each stage in the stress test.
Nevertheless, there is a noticeable correlation
between the two indices: for the plot in Figure 4a
(subject #5), the correlation coefficients between the
echo indices PSV and PSSR and the corresponding
TF-AVI, averaged over all transducers were 0.91
and 0.89 respectively. For the plot in Figure 4b
(subject #6) the correlation coefficients were 0.97
and 0.83 (p < 0.05 in all cases).
Both paired and unpaired t-test showed that the
absolute values of the acoustic spectral index (ASI)
at the end of low-dose Dobutamine induction were
significantly higher than the baseline values (p<0.04
for the 10ug stage, p<0.003 for the 20ug stage,
Figure 5). The correspondence between the ASI and
the echocardiographic indices in all of the subjects
was tested by comparing the values of the relative
index change at the end of the low-dose Dobutamine
stages. These points were selected since the
inotropic effect is more prominent at the early stages
of the test. In addition, the higher heart rates at later
stages of the test reduce the reliability of the tissue
tracking procedure used to extract the reference
echocardiographic indices. As shown in
Figure 6, a
good linear correlation (r=0.78, p<0.01) was
observed between ASI calculated from the apex
signal and the relative PSSR at the end of the 20ug
stage. At the end of the 10ug stage the correlation
coefficient between the two indices was 0.68
(p< 0.03).
(
a
)
(
b
)
Figure 4: TF-AVI indices of subjects #5 (a) and #6 (b).
Each plot displays the trend lines of TF-AVI from the
transducers at the apex (acg), aortic area (hsr) pulmonary
area (hsl) and carotid artery (cp), along with the relative
echo indices PSV and PSSR, trend lines of heart rate and
blood pressure, and color-coded stages of the stress test.
See text for details.
Figure 5: Absolute ASI values of all subjects at baseline
and after low-dose Dobutamine induction (10 and 20
ug/kg/min). The box plot displays the median, lower
quartile, upper quartile and data extent. Each marker
symbol represents a different subject. The p-values
represent a t-test comparison to the baseline values.
ACOUSTIC INDICES OF CARDIAC FUNCTIONALITY
81

Figure 6: The correlation and regression line between
relative PSSR index and relative ASI at the end of first
(10ug) and second (20ug) low-dose Dobutamine
induction. Each marker symbol represents a different
subject.
4 DISCUSSION
More than 40 years ago, Sakamoto et al. reported a
nearly linear relationship between the amplitude of
the first heart sound, S1, and the maximum of the
time derivative of the left ventricular systolic
pressure (dP/dt) in dogs (Sakamoto, 1965). Later it
was shown that myocardial infarction in humans
caused a shift of the maximum energy of S1 to a
lower frequency range (Adolph, 1970), and that a
reduction in the spectral energy of S1 correlated well
with the presence of significant coronary artery
disease (Clarke, 1978). More recently, Chen et al.
showed a good cross-correlation between the
instantaneous frequency of S1 and dP/dt of dogs in
various contractile states (Chen, 1997). They
suggested that the resonant frequency of S1 is
proportional to the fractional power of the tension of
the left-ventricular myocardium during contraction,
which relates to the left ventricular pressure gradient
by Laplaces’s law. The results of the current study
are in agreement with these previous studies
regarding the relation between the amplitude and
frequency spectrum of the first heart sound and the
dynamics of left ventricular contraction. The
acoustic indices developed in the current study
exhibited a marked correlation with the pattern of
inotropic and chronotropic changes throughout the
Dobutamine stress test. The increase in the spectral
energy, along with the emergence of higher
frequency components was consistently observed in
multiple recording locations in all of the subjects.
Although the study was conducted on a small group
of subjects, statistically significant differences were
observed across-subjects between baseline and low-
dose Dobutamine stages, confirming the reliability
of the results. The good correlation obtained with the
reference strain echocardiography indices suggests
that the acoustic indices truly characterize the
variations in the myocardial systolic functionality.
The relationship between the cardiovascular
physiological processes and their acoustic
manifestation on the chest wall is complex and most
probably non-linear. This relationship is affected by
neurohormonal modulation of the heart’s inotropic
and chronotropic states, as well as by changes in the
properties of the thoracic cavity conducting the
acoustic vibrations. Nevertheless, this work provides
a framework and a set of computational tools for
robust quantitative analysis of vibro-acoustic heart
signals that can be utilized for non-invasive,
continuous monitoring of cardiac functionality.
The capability of this framework to diagnose a
pathologic functionality reduction could not be
addressed quantitatively in this work, due to the
small number of subjects and the fact that the great
majority of the subjects had normal cardiac
functionality. Interestingly, the single subject that
was diagnosed in the echocardiography examination
with a reduced segmental wall motion during stress,
due to myocardial ischemia (subject #10) had the
lowest values of absolute and relative ASI, as well
as the lowest values of PSSR, indicating that the
compromised wall motion might result in a
frequency reduction of the first heart sound.
The usage of strain-echocardiography indices for
evaluation of left-ventricular function is still not a
part of the common clinical practice. Nevertheless,
there are strong research evidences for the relation
between peak strain rate and the invasive
contractility measure of peak elastance (Greenberg,
2002), and for the ability of global strain indices to
detect left-ventricular systolic dysfunction. (Reisner,
2004). Strain echocardiography was therefore used
in this research as a quantitative ‘gold-standard’
reference, which can be obtained non-invasively
during the routine protocol of the stress test.
One of the major challenges of extracting
meaningful physiological information from signals
acquired in routine clinical settings is noise
robustness. The data used in this work was
contaminated with various types of noise, including
body movements, interferences of the ultrasonic
transducer and audible sounds. The signal analysis
methods used in this work were specifically
designed to cope with these types of noise. In
particular, the statistical approach of transforming
the data to a new orthogonal basis of the principal
components was able to accentuate physiologically
meaningful patterns, while diminishing noisy-related
components.
BIOSIGNALS 2008 - International Conference on Bio-inspired Systems and Signal Processing
82

5 CONCLUSIONS
We have described a signal analysis framework for
robust extraction of systolic functionality indices
from acoustic heart signals. The developed tools
were constructed and tested on data from a
pharmacological stress test, with strain
echocardiography as the gold standard reference.
Using principal component analysis on the time-
frequency representation of the first heart sound we
have characterized the pattern of spectral changes
occurring during the stress test, and associated this
pattern to the alternations in systolic functionality by
showing it is linearly correlated to echocardiography
derived indices of cardiac contractility. Our analysis
framework and proposed indices can be applied to
real-time continuous monitoring of cardiac
functionality, thus enabling improved diagnosis and
management of cardiac dysfunction.
ACKNOWLEDGEMENTS
We would like to express our gratitude to the team
of the Echocardiography lab at the Rambam medical
center, for their kind assistance in data collection.
We would like to thank Dr. Zvi Friedman and
Dr. Peter Lysyansky from GE Healthcare for
providing the strain echocardiography analysis tools.
REFERENCES
Adolph, RJ., Stephens, JF., Tanaka, K., 1970. The clinical
value of of frequency analysis of the first heart sound
in myocardial infarction, Circulation 41:1003-1014.
Amit, G., Gavriely, N., Lessick, J., Intrator, N., 2005.
Automatic Extraction of Physiological Features from
Vibro-Acoustic Heart Signals: Correlation with Echo-
Doppler, Computers in Cardiology 2005:299-302.
Amundsen, BH., Helle-Valle, T., Edvardsen,, T., Torp, H.,
Crosby, J., Lyseggen, E., Støylen, A., Ihlen, H., Lima,
JAC., Smiseth, OA., Slørdahl, SA., 2006. Noninvasive
Myocardial Strain Measurement by Speckle Tracking
Echocardiography, J Am Coll Cardiol, 47:789-793.
Chen, D., Durand, LG., Lee, HC., Wieting, DW., 1997.
Time-frequency analysis of the first heart sound: Part
3, Med. Biol. Eng. Comput. 35;455-461.
Clarke, WB., Austin, SM., Pravib, MS, Griffen, PM.,
Dove, JT., McCullough, J., Schreiner, BF., 1978.
Spectral Energy of the Fist Heart Sound in Acute
Myocardial Ischemia, Circulation 57;593-598.
Duda, RO., Hart, PE., 1973. Pattern Classification and
Scene Analysis. Wiley New-York.
Greenberg, NL., Firstenberg, MS., Castro, PL., Main, M.,
Travaglini, A., Odabshian, JA., Drinko, JK.,
Rodriguez, LL., Thomas, JD., Garcia, MJ., 2002.
Doppler-Derived Myocardial Systolic Strain Rate Is a
Strong Index of Left Ventricular Contractility,
Circulation 105:99-105.
Reisner, SA., Lysyansky, P., Agmon, Y., Mutlak, D.,
Lessick, J., Friedman, Z., 2004. Global Longitudinal
Strain: A Novel Index of Left Ventricular Systolic
Function, J Am Soc Ehocardiogr 17:630-633.
Rushmer, RF., 1978. Cardiovascular Dynamics, WB
Saunders Co. Philadelphia, 4th edition.
Sakamoto, T., Kusukawa, R., MacCanon, DM., Luisada
AA., 1965. Hemodynamic Determinants of the
Amplitude of the First Heart Sound, Circ. Res. 16;45-
57.
Stockwell, R., Mansinha, L., Lowe, R., 1996.
Localization of the complex spectrum: the S
transform, IEEE Transactions on Signal Processing,,
44:998-1001
Tavel, ME., 1978. Clinical Phonocardiography & External
Pulse Recording. Year Book Medical Publishers Inc.
Chicago, 3rd edition.
ACOUSTIC INDICES OF CARDIAC FUNCTIONALITY
83
