
FORCE MEASUREMENT DURING GAIT THERAPY
ASSISTED BY A ROBOTIC TREADMILL
The Case of Lokomat®
M. Bocciolone, M. Lurati, M. Vanali
Department of Mechanical Engineering, Politecnico di Milano, Via La Masa 34, Milano, Italy
F. Molteni
Valduce Hospital, Villa Beretta Rehabilitation Center, Via N. Sauro 17, Costamasnaga (LC), Italy
Keywords: Gait analysis, assisted gait, rehabilitation, force measurement, data analysis, controlled orthosis.
Abstract: The present paper deals with force measurement during gait therapy assisted by a special robotic treadmill
with driven robotic orthoses that guide inferior limbs movements. The objectives, the measurement setup
and the results are presented. This work has been carried out in order to gather data necessary to begin the
analysis and the design of a new ankle motion device. The presented results also show how these
measurements can be useful in gait parameters assessment and patient’s muscle activity level.
1 INTRODUCTION
Nowadays mechanical measurements give a valid
and important aid in the rehabilitation field, both for
the design of specific devices and for the
development of suitable data analysis techniques.
Different types of sensors can be fixed on the
rehabilitation machines (Comolli et al., 2005), and
particular wearable sensors allow to perform the
measurements directly on the patient’s body, e.g. the
acceleration of body segments during gait (Zijlstra,
2003). Mechanical measurements can be useful to
properly set-up the rehabilitation device parameters
or to evaluate the patient’s conditions during
rehabilitation sessions (Melis et al., 1999).
This paper deals with force measurements
applied to the case of locomotion therapy assisted by
a specific robotic treadmill, the Lokomat®. This is a
rehabilitation device composed of a driven robotic
gait orthosis that guides the patient’s legs on a
treadmill while a desired percentage of the body
weight is sustained by a special support system. The
patient is sustained while his hips, thighs, knees and
legs are actively guided during the entire gait cycle,
therefore reproducing a physiologic movement. The
feet are instead passively pulled with a spring-belt
system: consequently ankles and feet follow non
“natural” trajectories and do not reproduce the actual
human walking. The foot sustainment is strictly
necessary to avoid the patient to stumble. Even if
this eventuality wouldn’t represent a danger for the
patient’s health because of the presence of suitable
security devices, it would cause the system
emergency stop to avoid the patient to fall, thus
interrupting the rehabilitation session. The growing
interest around this topic and the study of possible
solutions are the starting point of the present work.
The internal forces exchanged between the patient
and the Lokomat® have been measured in order to
analyze the mechanical behaviour of the utter system
(human and mechanical), and to investigate the
forces transmission from the suspension system to
the ground and vice versa. This knowledge is the
basis to upgrade the ankle motion system allowing a
better control and a more physiological ankle
movement. This paper describes the design of the
tests, the experimental set-up and the obtained
results. The analysis of the results has allowed to get
information about the patient’s working conditions.
The achieved data have also been the inputs in order
to design an innovative prototype device able to
control the ankle motion (Bucca et al., 2008). The
possibility of the patient’s conditions evaluation and
the rehabilitation parameters assessment have been
therefore investigated in the paper.
35
Bocciolone M., Lurati M., Vanali M. and Molteni F. (2008).
FORCE MEASUREMENT DURING GAIT THERAPY ASSISTED BY A ROBOTIC TREADMILL - The Case of Lokomat
R
.
In Proceedings of the First International Conference on Biomedical Electronics and Devices, pages 35-40
DOI: 10.5220/0001047400350040
Copyright
c
SciTePress
Force measurements during patients’
rehabilitation sessions have been performed using
suitable transducers (load cells) expressly built and
calibrated. These have been installed between the
patient and the Lokomat® frame. The body weight
sustaining force and the left/right foot pulling force
have been measured during the assisted gait, both for
an healthy subject and for an actual patient.
2 MEASUREMENT SETUP
This paragraph describes in detail the measurement
setup, the installed sensors and the Lokomat®
system.
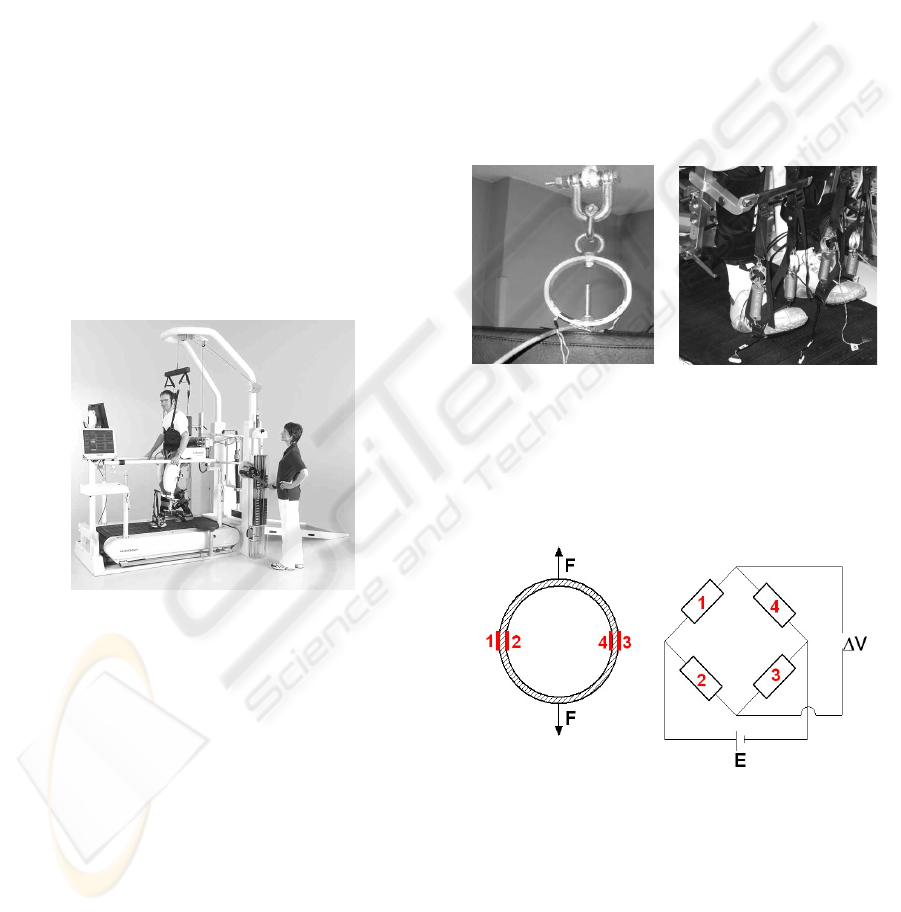
The Lokomat® rehabilitation device (Figure 1)
is essentially composed by three parts:
1. a hip support system that sustains a desired
percentage of the patient’s weight;
2. two electrically driven leg orthoses;
3. a passive spring-belt system that pulls and
drives the feet.
Figure 1: view of Lokomat® (with the courtesy of
Hokoma, from website www.hocoma.ch).
The body weight support system allows the therapist
to set the counterweight that sustains the patient
during the gait, accordingly to the medical
directions. This parameter setup is crucial because it
influences the rehabilitation session effectiveness
and therefore the patient’s progresses. During the
gait the patient is submitted to dynamic forces,
which have been measured and analyzed using
suitable techniques. In order to perform this goal, a
specific load cell (diameter 90 mm, thickness 5 mm,
depth 30 mm, output sensitivity 7.69 mV/N) has
been installed between the cable and the pin that pull
the system frame (Figure 2). In the following it will
be referred as the sensor N. 5.
Because of the main interest toward the feet pulling
system, other transducers have been installed to
measure the involved internal forces. Four load cells
(diameter 45 mm, thickness 2 mm, depth 20 mm,
sensitivity 20 mV/N), have been inserted between
the springs and the belts that pull up the feet. Sensor
N. “1” and “2” have been installed on the left side,
“3” and “4” on the right one (Figure 3).
All the load cells are not commercial products
but have been designed and realized for this specific
application. The transducers incorporate an
aluminium cell ring as the elastic element. Four
strain gauges, located as shown in Figure 4, are used
as sensors able to measure the strains due to the
force (extension or compression) acting along a
diameter.
Figure 2: sensor number
5.
Figure 3: sensors number
1-2 (left leg), 3-4 (right
leg).
The strain gauges are connected in a full Wheatstone
Bridge. The arrangement allows the thermal
compensation. The bandwidth is 0-20 Hz.
Figure 4: mechanical and electrical design of the load
cells.
All the output voltage signals have been acquired
with a National Instruments Acquisition System,
using a 12 bit PCMCIA DAQ card and a notebook
for data storing.
BIODEVICES 2008 - International Conference on Biomedical Electronics and Devices
36
3 TEST DESCRIPTION
Several tests have been carried out in two different
conditions:
1. during the gait of a 65 kg healthy person, with
no specific pathology (it will be referred as the
“normal” condition);
2. during the gait of a patient with a specific
motor disability.
In the first case (healthy subject) different speed
and counterweight conditions have been tested, and
are listed below:
• gait speed of 1.5 km/h and 2 km/h;
• counterweight of 20 kg and 35 kg;
• active and passive gait: in the active session
the subject was asked to walk in normal
conditions, therefore using his muscles at
100% and contrasting the Lokomat®
resistance; in the passive session he was asked
not to use his muscles, being completely
transported and guided by the Lokomat®
orthoses.
In the second case (real injury condition) a Spinal
Cord Injury (SCI) patient has been monitored during
a usual rehabilitation session. Because of the
specific pathology he was almost unable to use the
left leg but not the right one. Considering that the
patient used to have his gait sessions at 2 km/h with
40 kg of counterweight, two different speed
parameters have been tested (1.5 km/h and 2 km/h),
and he was asked to walk both passively and
actively. In order to prevent negative effects on the
patient’s rehabilitation sessions, only the usual 40 kg
counterweight has been tested.
4 RESULTS
This paragraph presents the results obtained in the
most meaningful tests for both test conditions.
4.1 “Normal” Conditions
A first effective analysis can be performed analyzing
the data obtained from the sensor N. 5 (the one
measuring the body sustaining dynamic force).
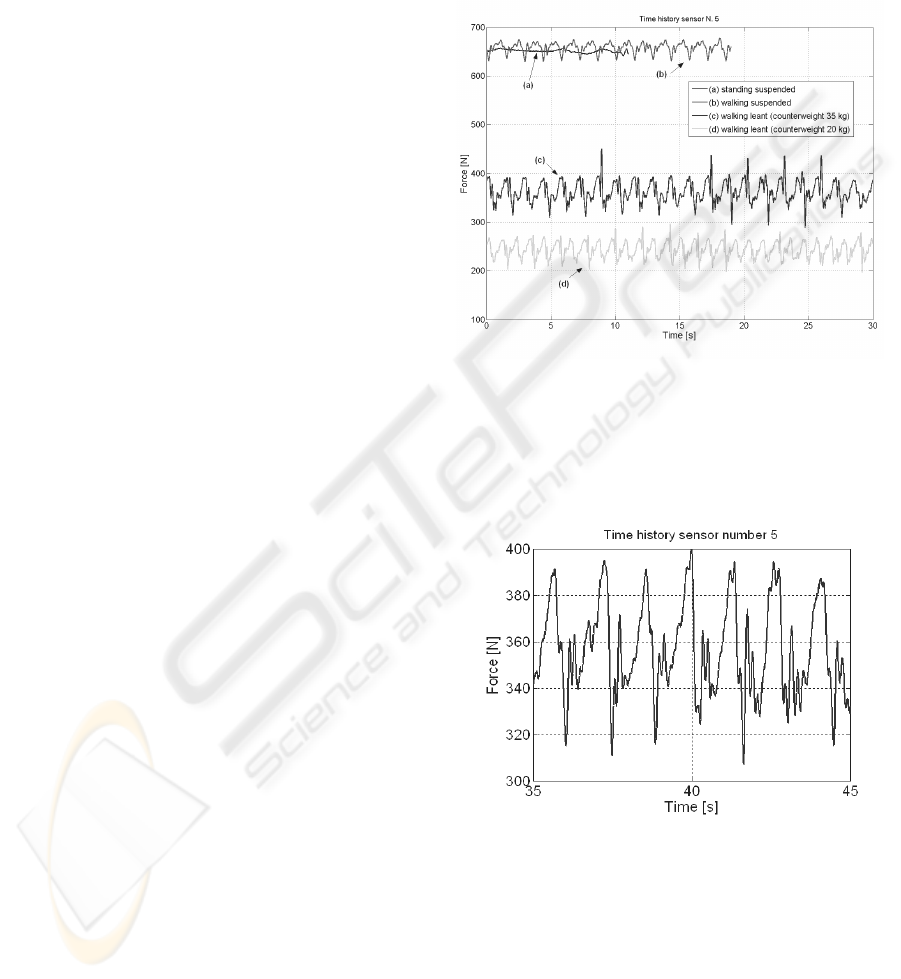
Figure 5 shows the force time histories 30 s long,
measured in the following conditions:
a) subject standing and suspended;
b) subject walking suspended;
c) subject walking leant with 35 kg
counterweight;
d) subject walking with 20 kg counterweight.
The measured forces, except obviously the case of
standing subject (a), present a periodic shape due to
the alternate left and right foot contact.
Figure 5: measured body sustaining force in different test
conditions.
A characteristic force waveform can be observed in
a step cycle, considering for example a 10 s long
time interval, in the case of subject walking at
1.5 km/h with a counterweight of 35 kg (Figure 6).
Figure 6: body sustaining force - time history.
The subject has a left (or indifferently right) foot
contact in 2.7 s and therefore a foot contact in 1.35 s.
The lowest force values are exhibited at the foot
contact instant while the highest when the foot rises.
The time-history analysis allows to evaluate the
actual load variations. In this case the measured
mean value is 359 N, with minimum and maximum
values equal to 310 N and 400 N. It has therefore
been calculated that the subject has sustained an
FORCE MEASUREMENT DURING GAIT THERAPY - The Case of Lokomat®
37
average weight of 275 N (∼28 kg), with a minimum
of 235 N (∼24 kg) and a maximum of 324 N
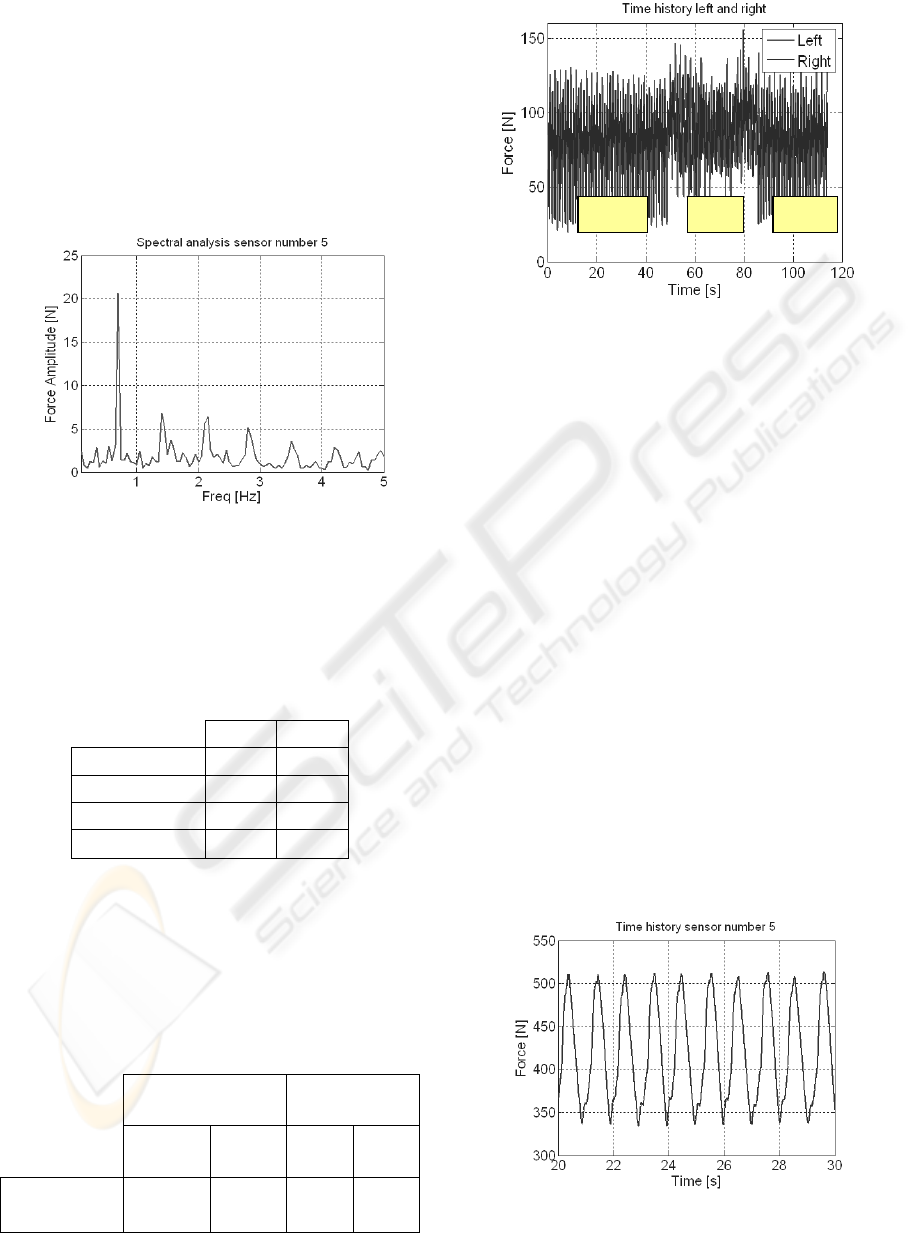
(∼33 kg). The analysis in the frequency domain
(using DFT techniques) is useful to identify the
dynamic component parameters. Figure 7 shows the
force amplitude spectrum: there is a main
component at 0.7 Hz (correspondent to the feet
contact frequency at a speed of 1.5 km/h) and other
lower multiple components.
Figure 7: body sustaining force - amplitude spectrum.
Table 1 contains the numeric results for all test
conditions, in terms of mean, max and min values
and peak to peak amplitude.
Table 1: measured body sustaining force (mean, max, min,
peak-to-peak values) for 35 kg and 20 kg counterweight.
35 kg 20 kg
Mean value
359 N 242 N
Max value
400 N 265 N
Min value
310 N 215 N
Peak-to-peak
90 N 50 N
The analysis of the data acquired by the cells
installed over the feet (sensors N.1 to N.4), gives
some important indications about the subject’s real
activity during the gait. Table 2 presents the numeric
results, comparing the suspended and the leant
subject conditions, both for left and right leg.
Table 2: numerical results for left/right foot pulling force.
Suspended
patient
Leant patient
Right Left Right Left
Peak-to-
peak
30 N 25 N 105 N 110
N
Figure 8: left and right foot pulling force (comparison
between active and passive zones).
In this case the mean values are not meaningful
because of their dependence on the static tension the
therapist gives preparing the patient. The dynamic
components are instead indices of the subject’s
muscle activity. The peak-to-peak value grows from
30 N to 105 N for the right leg and from 25 N to
110 N for the right, showing a strong increment of
the forces needed to sustain the feet when the subject
walks leant on the treadmill respect to the suspended
case.
The comparison between the time histories of the
active and passive sessions shows a significant
difference in the measured forces, being useful for
the subject’s work evaluation (Figure 8).
4.2 SCI Patient Gait
The previous analyses, performed in the case of an
healthy subject, have been applied to the case of a
SCI patient. The considered patient is affected by an
asymmetric left/right motor disability, and therefore
well suits a study case.
Figure 9: time history (body sustaining force).
passive active passive
BIODEVICES 2008 - International Conference on Biomedical Electronics and Devices
38
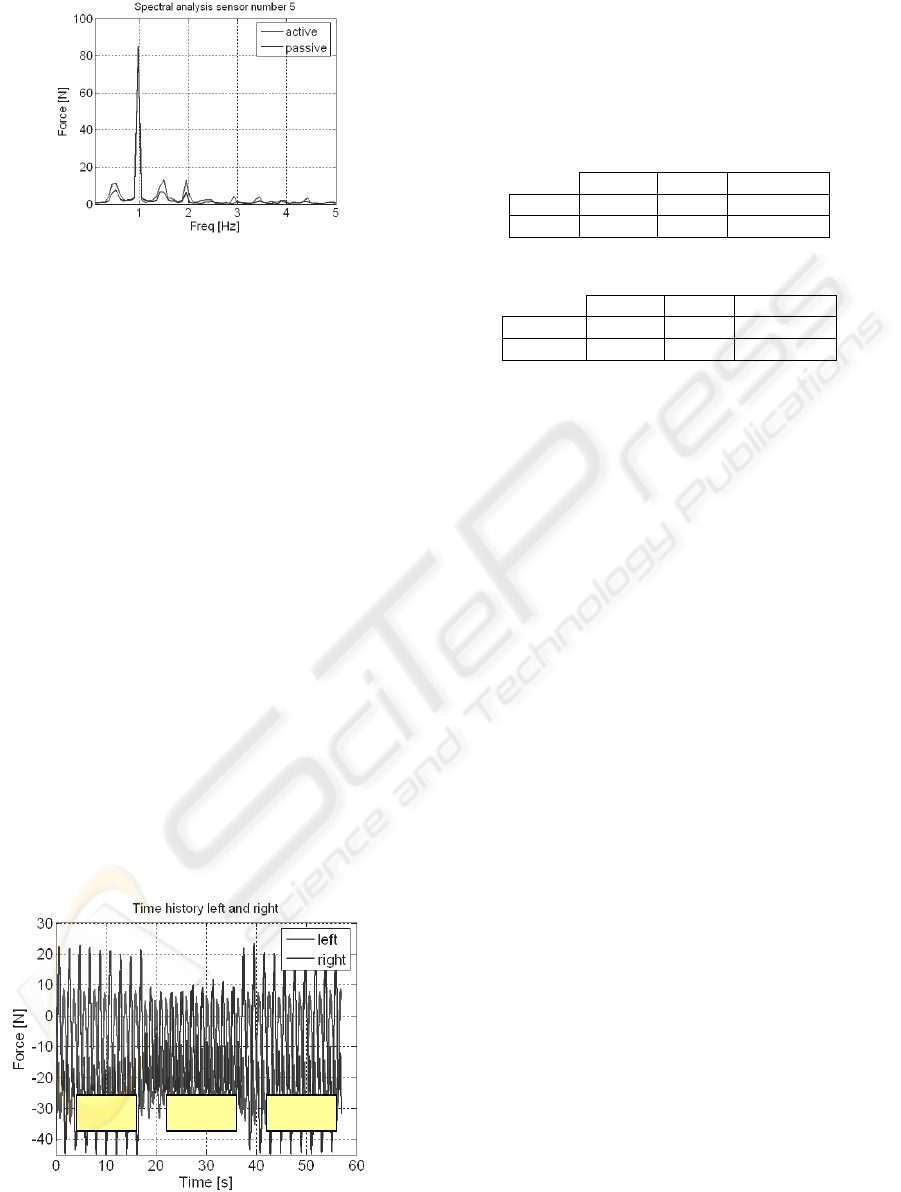
Figure 10: spectral analysis (body sustaining force).
The body sustaining force time history (Figure 9)
shows a more regular signal waveform, confirmed
by the spectral analysis (Figure 10), where the main
spectral component (associated to the foot contact
frequency) is more marked if compared with the
normal case. Comparing the active and passive
session spectra, it can be observed that the secondary
dynamic components tend to become lower in the
passive case, but when the patient tries to walk
actively a little increase appears (like the “normal”
gait case, where multiple components are well
marked).The analysis in the time domain has pointed
out significant differences in the measured
sustaining force depending on the patient’s speed
gait: the mean, max and min values of the aliquot
part of the weight sustained by the patient himself
are respectively 147 N, 59 N, 226 N for speed of 2
km/h. In the case of speed of 1.5 km/h the values are
127 N, 29 N, 226 N. The first case (2 km/h) is the
usual rehabilitation condition for the patient: he
seems therefore able to realize a more fluent gait
supporting a higher load.
The analyses of the time histories of the feet
sensors are useful to obtain indications about the
patient’s muscular activity (Figure 11).
Figure 11: left and right foot pulling force (comparison
between active and passive zones).
The calculation of the standard deviation of the
forces, index of the dynamic forces exchanged
between the patient and the orthosis, shows an
increment related to the patient gait efficiency
(Table 3, Table 4).
Table 3: feet pulling force values for 2 km/h speed.
2 km/h
Passive Active Increment
Right
12.3 N 19.8 N +61%
Left
12.6 N 14.1 N +12 %
Table 4: feet pulling force values for 1.5 km/h speed.
1.5 km/h
Passive Active Increment
Right
12.1 N 19.9 N +64%
Left
12.8 N 16.3 N +27 %
In agreement with the patient’s pathology the results
has pointed out a significant difference between
active and passive sessions only for the right leg,
with an increment of 61% and 64% respectively for
2 and 1.5 km/h, while 12% and 27% for the left leg.
5 DISCUSSIONS AND
CONCLUSIONS
Measurement chains able to gather the forces during
gait therapy assisted by a robotic treadmill have
been designed and settled-up. Results have pointed
out that these measurements can help doctors and
therapists in the patient’s assessment and the
rehabilitation parameters set-up. The obtained
results have also been the starting point for the study
of an ankle motion system improvement.
The actual load sustained by the patient during
assisted gait is a fundamental parameter. The proper
value is different for each patient, depending on the
physical condition and the specific pathology. A too
high value may be detrimental to the patient, while a
too low value may be inappropriate, raising the
patient’s recovery time length. The measurement of
the actual load, and especially of the dynamic load
variations, for sure very important to this aim, has
been performed and the results analyzed.
Beside this, the knowledge of the involved
internal forces can help the therapist in the
rehabilitation session evaluation, allowing to
properly set-up all the parameters, as the gait speed
and the session time length.
The very good results obtained in the present
work provide the basis for future developments
aimed to the real diagnostic possibilities. Additional
experimental tests will be carried out in order to
active passive active
FORCE MEASUREMENT DURING GAIT THERAPY - The Case of Lokomat®
39

consider a greater number of patiens, thus validating
the obtained results and estimating the associated
uncertainty levels.
The authors think that the measured internal
forces are associated to the actual muscular activity
of the patient. Therefore the next step in this
research field will be the correlation between the
measured forces and the results coming from the
electromyography of lower-limb muscles during
walking, in order to validate the presented results.
The possibility of the patient’s assessment based on
force measurements is very interesting, giving a lot
of advantages as low cost and ease of carrying out.
ACKNOWLEDGEMENTS
Authors wish to thank Mauro Rossini (Villa Beretta
Rehabilitation Centre) for his helpful discussion.
This work was supported by the Fondazione Cariplo
in the framework of the research program
HINT@Lecco.
REFERENCES
Zijlstra, W., 2003. Assessment of spatio-temporal gait
parameters from trunk accelerations during human
walking, Gait and Posture Vol. 18, 1-10.
Bucca, G., Bezzolato, A., Bruni, S., Molteni, F., 2008. A
mechatronic device for the rehabilitation of ankle
motion, BIODEVICES 2008 Conference, Funchal,
Madeira.
Comolli, L., et al, 2005. Metrological characterization of a
cycle-ergometer, 6th Congress of the Italian Society of
Movement Analysis in Clinics.
Melis, E.H., et al, 1999. Analysis of assisted-gait
characteristics in persons with incomplete spinal cord
injury, Spinal Cord, Vol. 37, Issue 6 pp. 430-439.
BIODEVICES 2008 - International Conference on Biomedical Electronics and Devices
40
