
PET-CT IMAGING AND DIAGNOSIS SYSTEM FOLLOWING
DOCTOR’S METHOD
Hiroshi Arisawa, Takako Sato and Sinya Hata
Graduate School of Yokohama Nat. Univ., 79-7, Tokiwadai, Hodogayaku, Yokohama, 240-8501, Japan
Keywords: Medical Imaging, PET-CT, Expert Systems.
Abstract: Computer Assisted Diagnosis (CAD) is one of the promising technologies for the future Medical Image
Processing Systems. Among them, whole-body PET (Positron Emission Tomography) and X-ray CT
(Computer Tomography) image based cancer detection has been playing an essential role in the modern
medical world. Using PET-CT images the Radiologist can find a very small cancer or a malignant tumor.
On the other hand, this diagnosis process is very stressful work, because such area is too small and localized
but may appear at any place of patient bodies. This paper presents an automated diagnosis system in order
to improve the above difficulties. The system consists of three parts, Diagnosing Algorithm, Algorithm
Interpreter(Engine) and Image Viewer. The algorithm and the engine can reproduce doctor's methods
faithfully as the rule-based inference system. Using this system, we made an retrospective studies for the
actual group of patients and the results shows the usefulness of this approach.
1 INTRODUCTION
Computer assisted diagnosis systems are an
important issue in the world of modern medicine.
Computer-based interpretations of 2-D images (such
as CT, MRI, etc) are among this group of systems
which have been utilized by physicians with
promising results. Because of this, a great deal of
research on computer-assisted-diagnosis support
systems (CAD; Computer Aided Diagnosis) have
been proposed (Jiang et al, 2000) (Toriwaki et al,
2000) (Tsai et al, 2001) (Cheng et al, 1998) (Ukai et
al, 2000), especially for diagnostic imaging tools.
The diagnostic method for cancer detection using
the PET (Positron Emission Tomography) and X-ray
CT (Computed Tomography) images is a core
technology, which attracts the interests of many
medical scientists (Murakami, 2003). During cancer
inspection by a PET scan, drugs called FDG
(Fluorodeoxyglucose: a glucose-mimicking
radioactive element) are administered to the patient,
and the gamma rays emitted from the patient are
photographed by the nuclear imaging system. The
PET images show the various level of absorption
(SUV: Standard Uptake Value) of the FDG through
out the body. As a result, we can observe the FDG
concentration absorbed by the tissues and organs.
This is useful because malignant cancer cells have
an increased glucose metabolism, so much more
FDG is taken into a cancer cell, and so, a SUV value
will become much higher than a normal cell. This is
referred to as an “abnormal accumulation.”
However, more FDG will also be taken into areas
where inflammation has occurred or organs (such as
kidneys, urinary bladder, liver, etc.) which take in
more glucose naturally even without the effects of
cancer. This latter is called a “physiological
accumulation.” The purpose of an automated
diagnosis system is finding out which areas have
signs of an abnormal accumulation based on the
images of the whole body PET scan.
During a PET scan of the whole body,
tomography is performed by rotating the camera
around the axis of the body at intervals of about
3mm. From the results of a whole body tomography
(from a femoral region to the parietal region), a
physician receives about 3000 slice images per
patient. In order to manually analyze these images a
physician needs to have much knowledge and
experience of PET scans as well as time and effort to
interpret these images. This creates a very large
burden for the physician, there by increasing fatigue
and decreased concentration which may lead to a
misdiagnosis. Moreover, the number of physicians
who can perform an interpretation of PET image is
insufficient.
258
Arisawa H., Sato T. and Hata S. (2008).
PET-CT IMAGING AND DIAGNOSIS SYSTEM FOLLOWING DOCTOR’S METHOD.
In Proceedings of the First International Conference on Health Informatics, pages 258-261
Copyright
c
SciTePress

On the other hand, in general during a medical
check up for cancer by PET diagnostic imaging, 90
percent or more of the samples are normal images.
These images lack any indication of cancer. Even
still searching for cancer cell is stressful work for the
radiologists.
Based on this information, an automated
diagnostic support system is a very effective tool for
analyzing and pinpointing potentially cancerous
areas of the human body.
For the above purpose, existing works are mostly
focusing on the specific organs such as the lung
(Takeo et al, 2005). Also most researches are
based on CT images and the recognition of area are
on the combination of filters. On the other hand, our
method are based on PET images. However, as for
several critical area such as bone and lung, 3D shape
and scale are extracted from CT slices. We
confirmed that a similar process has been executed
in the actual radiologist's diagnosing.
In this paper, design principle of the diagnosis
system is introduced in the section 2, and the
experimental results are presented and evaluated in
the section 3.
2 A SYSTEM WHICH IMITATES
DIAGNOSIS OF PHYSICIAN
2.1 Basic Principles for the System’s
Configuration
The basic principles of the automated diagnosis
system which we created are summarized by the
following two points.
In order to use this diagnosis system for mass
screenings, the fundamental function is to
‘classify’ cases into two categories:
o “The possibility of abnormality
followed by a careful examination”
o “Normal with no need for further
inspection”
Then the next step is to reduce the chance of a
misdiagnosis by preventing false-negative
results from occurring.
In order to get the trust of physicians and
satisfy the two principles above, the system
must reproduce the physician’s diagnostic
process as faithfully as possible. Our strategy
for building this system is to interview many
physicians and radiologists to have a greater
understanding as well as the feasibility of
creating a diagnostic support system. We are
establishing a replica of the physician’s
diagnostic process with an automated
computer system. To meet this end we have
developed a description language to reproduce
the process of a PET scan diagnosis through
computer algorithms.
2.2 Feature Analysis of a PET Image
A PET image, unlike CT or MRI, does not express
morphological information such as the shape of an
organ, but expresses functional values (for example
the differences in the amount of glucose
metabolized) in the undefined areas. The images are
often low resolution and very coarse. Therefore, it is
difficult to determine the specific cancerous region
within tissue with just PET scan image.
While interpreting the PET images, a physician
utilizes his/her knowledge of previous PET scan test
cases in order to make a proper diagnosis. Also, the
outline image of organs from a CT scan is very
useful to confirm the location of the accumulation of
cancer. With this in mind, we decided to create a
software package that interprets a physician’s
methodology during PET scan diagnosis and uses
the proper PET terminology to describe the
program’s actions so that it would mimic the
performance of the physician. This system is
designed so that a physician can monitor the process
of diagnosis from the local to global (whole body)
level, to evaluate diagnosis’s validity and to
recommend improvement.
2.3 Architecture of PET Automated
Diagnosis System
In order for a computer to faithfully reproduce
physician’s judgment, this based on experience and
knowledge of physician as well as a strict usage of
the grammar and language of PET scan diagnosis.
The person who translates a physician’s
methodology into a description language will be
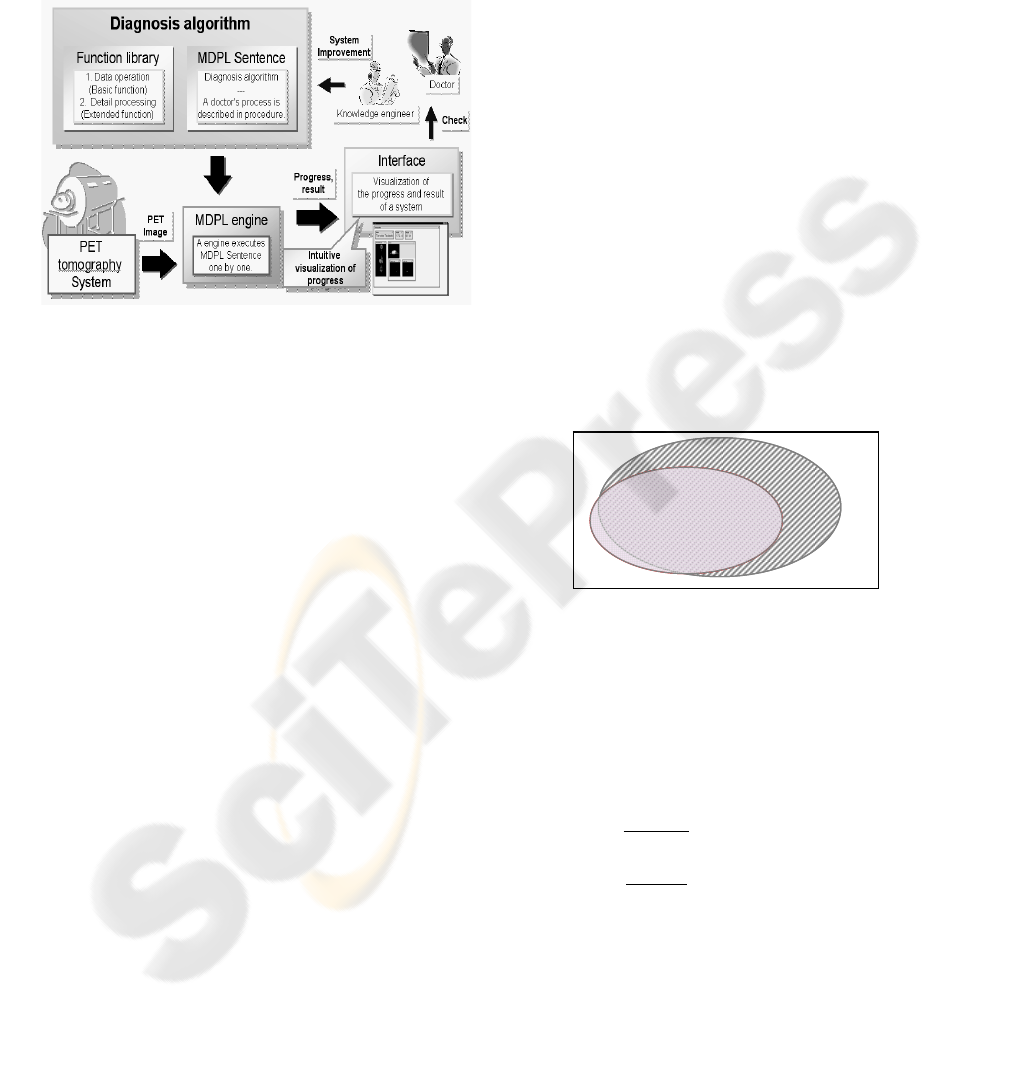
called a knowledge engineer. Figure 1 shows the
complete concept of the automated diagnosis
system.
The knowledge engineer interviews the
physician about knowledge and techniques used for
the interpretation of PET images. When the
diagnostic method is understood, the knowledge
engineer translates this information into a diagnostic
algorithm. This automated procedures preformed by
the computer must be understood and be able to be
examined by the physician directly. In order to do
PET-CT IMAGING AND DIAGNOSIS SYSTEM FOLLOWING DOCTOR’S METHOD
259
this, the system imitates the diagnosis procedure of a
physician step by step. Furthermore, image
processing functions are needed to visualize the
automated diagnosis. So we divide the diagnosis
into several parts and provide a proper description of
the diagnostic process at each step as well as for
each data-processing function that is called.
Figure 1: Architecture of PET automated diagnosis system.
And by allowing a physician to view each
portion of the diagnostic process, the physician can
examine and validate each part of the diagnosis by
checking the functions of that particular step of the
process and viewing intermediate results, without
having to understand the underlying computer
program language (Endo et al, 2004). Herewith, a
physician can understand and check each individual
diagnostic process which the system performs.
In order to express intermediate result data, we
developed the logical data structure NEW (Nested
Entity Window) (Hasegawa et al, 2005), and we
regard the diagnostic process as data manipulation to
NEW. Then we also propose programming in
language MDPL (Multimedia Data Processing
Language) (Hasegawa et al 200) in order to describe
the diagnostic process. With MDPL, we can express
a particular section of the process in NEW, which
has a complex structure.
3 AN EXPERIMENT ON THE
COMPUTER-BASED
DIAGNOSTIC METHOD
We experimented about the described diagnostic
method.
In our laboratory, the MDPL interpreter, NEW
manager, and Database System are currently being
developed as an independent project. Therefore, in
this experiment, we implemented the basic data-
processing functions required for building the
diagnostic method with suitable parameter.
Moreover, we recorded various states of NEW as it
was processed by a sequence of functions. Then we
could reproduce the flow of the structural change of
NEW at the time a particular MDPL statement is
called.
3.1 Basic Experimental Data
The data used for the experiment are as follows.
12 normal example
18 cases of cancer
Total number of accumulations which have
possibility of cancer is 22
3.2 Experimental Result
After applying the computer-based diagnostic
method to all examples, the system pointed out 110
‘abnormal’ accumulations (having possibility of
cancer). On the other hand, the professional
radiologist pointed out 22 abnormal accumulations.
Fig.2 shows the above results as a Venn diagram.
A
D
U
A: accumulations pointed out by
automatic diagnostic system
D: accumulations pointed out by
professional radiologists
U: total accumulation
D – A : false negative
A – D : false positive
| A ∩ D |
| D |
:recall
| A ∩ D |
| A |
:precision
Figure 2: Experimental result based on a diagnostic
method.
HEALTHINF 2008 - International Conference on Health Informatics
260

Original Image (axial) Original Image (coronal)
Masked Image (axial) Masked Image (coronal)
Figure 3: Result of Automated Diagnostic System (thyroid
gland cancer).
In the diagram, for example, D-A indicates a set
for ‘false negative’ accumulations. That is, each
instance of D-A indicates the accumulation that were
pointed out as abnormal one pointed by professional
radiologist but not pointed out by the automated
diagnostic system. Such instance must be kept from
occurring in the Computer Assisted Diagnosis.
In our preliminary experiment, the results are as
follows:
False negative 0 %
False positive 80.0 %
Precision ratio 20.0 %
Recall ratio 100 %
4 CONCLUSIONS
During this research, we developed and configured a
cancer automated diagnosis system and tested its
capabilities. It is able to imitate the “real” diagnosis
of a physician. The physicians can evaluate the
validity of the result by themselves. Also, through
the constant feedback and discussions with
physicians, we could acquire more information, and,
as a result, make improvements to the diagnosis
system. Currently we are working to ensure that this
system will be able to properly diagnosis and
provide a detailed description about any abnormal
spots any where in the human. We continue to
improve the system in order for the successful
utilization in the medical field.
ACKNOWLEDGEMENTS
We express our appreciation to Dr. Akiko Suzuki
who cooperated with Professor Tomio Inoue of the
Yokohama City University graduate school of
medical studies.
REFERENCES
Jiang, H., Masutoh, N., Nishimura, O., Okumura, T.,
Yamamoto, S., Iisaku, S., Matsumoto, T., Tateno, Y.,
Iinuma T., Matsumoto, M., 2000. Computer-Aided
Diagnosis System of Lung Cancer Screening by X-
Ray CT, IEICE TRANS.(D-
Ⅱ
)
,
J83-D-
Ⅱ
(1), 333-
341.
Toriwaki, J., 2000. Trends and Future Problems in
Computer Aided Diagnosis of X-ray Images, IEICE
TRANS.(D-
Ⅱ
), J83-D-
Ⅱ
(1), 3-26.
Tsai, D., Lee, Y., 2001. Fuzzy Reasoning Based
Computer-Aided Diagnosis for Automated
Discrimination of Myocardial Heart Disease from
Ultrasonic Images, IEICE TRANS.(A)
,
j84-A(12)
,
1431-1438.
Cheng, X., Akiyama, I., Wang, Y., Itoh, K., 1998. Breast
Tumor Diagnosis System Using Three Dimensional
Ultrasonic Echography,IEICE TRANS.(D-
Ⅱ
)
,
J81-
D-
Ⅱ
(1), 1402-1410.
Ukai, Y., Niki, N., Satoh, H., Watanabe, S., 2000.
Computer Assisted Diagnosis System for Coronary
Calcifications Based on Helical CT Images,IEICE
TRANS.(D-
Ⅱ
)
,
J83-D-
Ⅱ
(1), 342-350.
Murakami, K., 2003. Base and Clinical Application of
PET for Lung Cancer, Japanese Journal of Lung
Cancer, 43(7), 811-817.
Takeo H., Shimura K., Imamura T., Shimizu A., Kobatake
H., 2005, Detection System of Clustered
Microcalcifications on CR Mammogram (Biological
Engineering), IEICE transactions on information and
systems, E88-D(11), 2591-2602
Endo, T., Hashimoto, R., Arai, J., Arisawa, H., Suzuki, A.,
Inoue, T., 2004. Construction of a Medical Database
for Automatic Diagnosis System of Cancer Using PET
Images,DEWS2004 papers I-6-03 (IEICE technical
research report).
Hasegawa, T., Yaguchi, Y., Endo, T., Arai, J., Arisawa, H.,
2005. Decision Support System with the Description
of Thinking and Estimation Process of Experts ,
DEWS2005 papers 4A-i7 (IEICE technical research
report).
PET-CT IMAGING AND DIAGNOSIS SYSTEM FOLLOWING DOCTOR’S METHOD
261
