
ASYMS
©
-SERAT: A SIDE-EFFECT RISK ASSESSMENT TOOL
TO PREDICT CHEMOTHERAPY RELATED TOXICITY IN
PATIENTS WITH CANCER RECEIVING CHEMOTHERAPY
Julie Cowie, Kevin Swingler, Clare Leadbetter
Department of Computing Science and Mathematics, University of Stirling, Stirling, FK9 4LA, UK
Roma Maguire, Kathryn McCall, Nora Kearney
Cancer Care Research Centre, Department of Nursing and Midwifery, University of Stirling, Scion House
Stirling Innovation Park, Stirling, FK9 4NF, UK
Keywords: Risk modelling, side-effect prediction, cancer chemotherapy.
Abstract: Patients undergoing chemotherapy want specific information on potential toxicities of their treatment. Such
information includes what side-effects they are likely to experience, how severe these side-effects will be,
how long they will experience them for, and the best ways of managing them. As well as improving the
experiences of patients, information about potential side-effects may also be of significant benefit clinically,
as patients who are ‘at risk’ of developing certain toxicities may be identified, facilitating more targeted,
cost-effective interventions. This paper describes research that uses risk-modelling techniques for
identifying patterns in patient side-effect data to aid in predicting side-effects patients are likely to
experience. Through analysis of patient data, a patient can receive information specific to the symptoms
they are likely to experience. A user-friendly software tool ASyMS©-SERAT (Advanced Symptom
Management System-Side-Effect Risk Assessment Tool) has been developed, which presents side-effect
information to the patients both at the start of treatment and reviews and monitors predictions with each new
cycle of chemotherapy received.
1 INTRODUCTION
In this paper we discuss the development of a user-
friendly software tool ASyMS
©-SERAT (Advanced
Symptom Management System-Side-Effect Risk
Assessment Tool), designed to provide patients
undergoing chemotherapy treatment with a
personalised prediction of possible side-effects they
are likely to experience. Prediction of possible
toxicities is achieved through the use of risk
modelling techniques, which facilitate a better
understanding of how a patient’s personal
information, the chemotherapy regime they are
undertaking, and any previously experienced
symptoms (if appropriate) contribute to the
likelihood of future symptoms occurring.
Section 2 provides the reader with an overview
of the project; detailing the current state of symptom
modelling, risk modelling and how the approach can
be applied to prediction modelling. The
methodology adopted is also discussed as well as the
actual aims of our research. In Section 3 we present
the software ASyMS
©-SERAT, discuss possible
ways in which the system might be used and show
the type of prediction information which can be
provided. We conclude with Section 4, discussing
work-to-date and ways in which we hope to develop
ASyMS
©-SERAT in the future.
2 PROJECT BACKGROUND
2.1 Symptom Modelling
In the UK approximately 277,000 individuals are
diagnosed with cancer each year (CRUK, 2003) and
this figure is projected to significantly increase over
the next decade (SEHD, 2005). A majority of these
225
Cowie J., Swingler K., Leadbetter C., Maguire R., McCall K. and Kearney N. (2008).
ASYMS-SERAT: A SIDE-EFFECT RISK ASSESSMENT TOOL TO PREDICT CHEMOTHERAPY RELATED TOXICITY IN PATIENTS WITH CANCER
RECEIVING CHEMOTHERAPY.
In Proceedings of the First International Conference on Health Informatics, pages 225-230
Copyright
c
SciTePress

individuals are likely to receive chemotherapy
treatment at some stage of their illness. The toxic
effects of chemotherapy puts patients at risk of
developing a number of side-effects, some of which
can become serious and life threatening if not
detected and managed early. Approximately 9-21%
of patients receiving chemotherapy are hospitalised
due to such severe treatment related toxicity (Chen-
Hardee et al. 2006; Du, Osborne, & Goodwin
2002;Kuderer et al. 2006; Polednak 2004) and 10%
of patients die as a result of them (Kuderer, Dale,
Crawford, Cosler, & Lyman 2006).
The effective monitoring and management of
symptoms in this patient group is vital. However, it
is now recognised that symptoms in patients with
cancer are often poorly assessed and managed
(National Institute for Health, 2002). Factors such as
inadequate patient provider communication
(Cleeland et al, 1986), and poor symptom
assessment (Cleeland et al, 1994) have been cited as
being contributory factors. The recent changes to
the organisation of cancer services may also
contribute to the sub optimal management of
symptoms. With the focus of care now being in the
home and out-patient setting, patients are left to
manage the majority of side-effects on their own
without direct supervision from health care
professionals; this may leave them feeling anxious
and having lack of control over their illness and
treatment (McCaughan & Thomson, 2000).
Furthermore, patients with cancer often find the
unpredictability and diversity of potential side
effects difficult to deal with (Cohn 1982; Tierney,
Taylor, & Closs 1992).
Patient education is therefore fundamental to
effective symptom control. It is widely
acknowledged that patients with cancer want
information on how to manage the symptoms and
side effects associated with their disease and
treatment (McCaughan & Thompson 2000; Skalla,
Bakitas, Furstenberg, Ahles, & Henderson 2004).
However, they often report feeling overloaded with
the wealth of information provided and as a result
experience problems with retaining and retrieving it
(Skalla et al. 2004). As a consequence, there have
been calls for the provision of information on cancer
therapies, which is tailored to patients’ individual
characteristics and needs (Skalla et al.
2004; Dikken
& Sitzia 1998). Patients want more specific
information on potential toxicities of treatment, such
as what side-effects they are likely to experience,
their severity, and duration and how to manage them
(Skalla et al.
2004). The provision of such
information is likely to make them feel more in
control of their disease by knowing what to expect
and how to deal with problems when they occur.
Furthermore, it may prevent unnecessary worry and
anxiety over side-effects that are less likely to arise
(Skalla et al.
2004). Whilst not only having the
potential to greatly improve the experiences of
patients with cancer receiving chemotherapy, a more
accurate prediction of potential side effects of such
treatments, based on patients individual and disease
related characteristics, may also be of significant
benefit clinically. By knowing the likelihood of
potential side effects occurring, patients who are ‘at
risk’ of developing certain toxicities may be
identified, facilitating more targeted and cost
effective interventions, to those in greatest need and
who are most likely to benefit. It may also guide
clinicians in the selection of appropriate treatments
for individual patients based on their characteristics
and needs.
2.2 Risk Modelling
Within health care, there is increasing use of
predictive models to identify patients who are most
likely to experience specific disease and/or treatment
related events. Relative to cancer care, such models
have tended to focus on predictors of survival and
life threatening toxicities such a febrile neutropenia
(Chow, Harris, & Fung 2006; Donohue 2006;
Lyman et al. 2005; Sanchez et al. 2006; Vigano et al.
2000). In relation to the prediction of symptoms,
there is limited work that has been performed in this
area, particularly in relation to the area of
chemotherapy side-effects (Armer et al. 2003;
Talcott et al. 2003; Poleshuck et al. 2006).
Risk modelling provides a powerful mechanism
for identifying patterns in data and predicting what
will happen in the future. A variety of techniques
can be employed to analyse data and the results of
such analysis can be used to provide likelihood
information relating to the prevalence of similar data
occurring in the future. This information can relate
to the likelihood of specific data values occurring
together, or perhaps the frequency with which whole
records of information may occur again.
The potential for using mathematical techniques
to identify risk is reinforced by their prevalence in
the literature: Cowie et al (2006) discussed the use
of Bayesian belief networks in aiding in dementia
diagnosis, where patterns are identified in data from
patients who are potentially dementia sufferers and
such patterns used to help predict whether dementia
is present; Werner and Fogarty (2001) developed
mathematical models to allow simulation of future
events based on past medical records. Using this
technique, the occurrence of thrombosis was
predicted in sufferers of collagen disease; De Toro et
al (
2003) used neural networks to predict hospital
HEALTHINF 2008 - International Conference on Health Informatics
226

mortality of patients in intensive care more
accurately than traditional regression models;
Dybowski et al (1996) successfully applied multi-
objective optimisation to analyse electrocardiogram
(ECG) traces to provide a non-invasive technique for
diagnosing potential signs of atrial disease; García-
Pérez et al (1998) use data mining and neural
network techniques and Mani et al (1997) apply
decision-trees and rule-based approaches to
differentiate between different dementias types.
The risk modelling techniques available differ in
the way in which the data is analysed, how much
data the technique requires to make significant
predictions, and how much information is revealed
regarding the patterns that exist. In general, it is
advisable to use a variety of different methods to
ensure that as much prediction data can be obtained
as possible.
2.3 Project Aims
In order to identify patterns in side-effects
experienced by patients receiving chemotherapy,
data was analysed with a view to answering the
following key questions:
• Does the chemotherapy regime impact on the
side-effects experienced?
• Can we predict later symptoms from the pattern
of early symptoms?
• If side-effects are experienced in an early cycle
does this increase the likelihood of experiencing
the same side-effects in later cycles?
• Do some side-effects always occur together and
does the presence of some symptoms make
others less likely to occur?
• Does the severity to which a side-effect is
experienced impact on the likelihood of that
side-effect occurring again?
The principal aim of the project was to provide new
patients with a prediction of side-effects they are
likely to experience across all cycles of
chemotherapy. The secondary aim was to provide
patients with ongoing side-effect information. By
monitoring their side-effects over a period of time,
we hoped to provide up-to-date predictive
information which is revised and reviewed
(according to how their side-effects change) over the
cycle of treatments. Currently, the study focuses on
six symptoms associated with chemotherapy:
mucositis, nausea, vomiting, fatigue, diarrhoea, and
hand-foot syndrome.
2.4 Research Methodology
2.4.1 Data Collection
Thirty-three retrospective cases of patients with
breast cancer undergoing chemotherapy have been
used in the study. Risk modelling analysis was
performed on this data in an attempt to answer the
questions posed in Section 2.2. Current data
collection is also taking place from three sites across
Scotland,
which will form a prospective data set
consisting of forty patients. These patients have been
diagnosed with breast cancer and are commencing
adjuvant chemotherapy.
Data is being collected using a series of daily
patient self-reporting paper-based symptom
questionnaires collected throughout 4 cycles of
chemotherapy. The daily symptom questionnaire is
being used in addition to the clinical use of two
existing questionnaires commonly used in practice
to assess and grade chemotherapy related symptoms
– the Common Toxicity (CTC) grading system
(National Cancer Institute, 2003) and the
Chemotherapy Symptom Assessment Scale (C-SAS)
(Brown et al, 2001). This data will be used to further
assess the accuracy of the risk-modelling tool.
2.4.2 Data Analysis
The data analysis performed uses both traditional
statistical techniques and a class of more advanced,
powerful techniques collectively known as 'data
mining'. Data mining is task oriented, which means
that analysis begins with the definition of a task and
progresses through the use of data and software to
develop a system for performing the chosen task. In
this study, the task is to predict future symptoms
from a combination of patient data and current
symptoms. The pattern of symptoms experienced as
a patient progresses through a chemotherapy regime
is not random, and as such can be predicted. Data
mining tools are designed to find the structure that
allows such predictions to be made.
The data from this study was analysed in two
distinct forms. One which treats the data as a time
series on the assumption that there is a pattern in the
way symptoms evolve over time (trends or cycles,
for example) and the other being static, working on
the assumption that the patient's initial state and the
chemotherapy regime alone are sufficient to predict
when and with what severity symptoms will occur.
For the time series analysis, we used dynamic
Bayesian networks, Markov models and a
decompositional approach. For the static prediction
the principal tools used were neural networks,
cluster analysis, and Bayesian belief networks.
ASYMS©-SERAT: A SIDE-EFFECT RISK ASSESSMENT TOOL TO PREDICT CHEMOTHERAPY RELATED
TOXICITY IN PATIENTS WITH CANCER RECEIVING CHEMOTHERAPY
227
3 ASYMS©-SERAT
3.1 Introduction to ASyMS©-SERAT
The ASyMS©-SERAT tool will be incorporated into
a mobile phone based, advanced symptom
management system (ASyMS
©-C) which has been
developed to remotely monitor the side effects of
chemotherapy in patients with cancer receiving
chemotherapy (Maguire et al, 2005).
The ASyMS
©-SERAT tool employs the use of risk
modelling techniques to provide patients and
clinicians with predictions of likely side effects. The
prototype tool can be used to provide predictive
information to both new patients, and those currently
undergoing treatment. For new patients, the tool
allows patient specific data to be entered and
provides feedback as to likely side-effects (along
with severity details) that will occur. As patients
undergo treatment and side effects are monitored,
the tool can measure these against the original
prediction model. Prior to each cycle of treatment, a
patient’s predicted model can be reviewed and
revised to provide a new predictive model if felt
necessary.
The development of the tool has been split into
two phases: Phase I which concentrates on the
provision of information for new patients, and Phase
II which provides information for returning patients
part-way through their chemotherapy regime. To
date, Phase I has been completed and it is envisaged
that Phase II will be completed by February 2008.
3.2 ASyMS©-SERAT in Use
This description of ASyMS©-SERAT will focus on
Phase I of the tool as this has now been completed.
In Phase I of ASyMS
©-SERAT, the tool uses
information it has learnt from the data and combines
this with patient specific information to predict the
likely side effects a patient will experience over the
course of their treatment. The patient can receive
predictions relating to possible symptoms they are
likely to experience in their first cycle of treatment
as well as possible symptoms they are likely to
experience across all cycles of treatment.
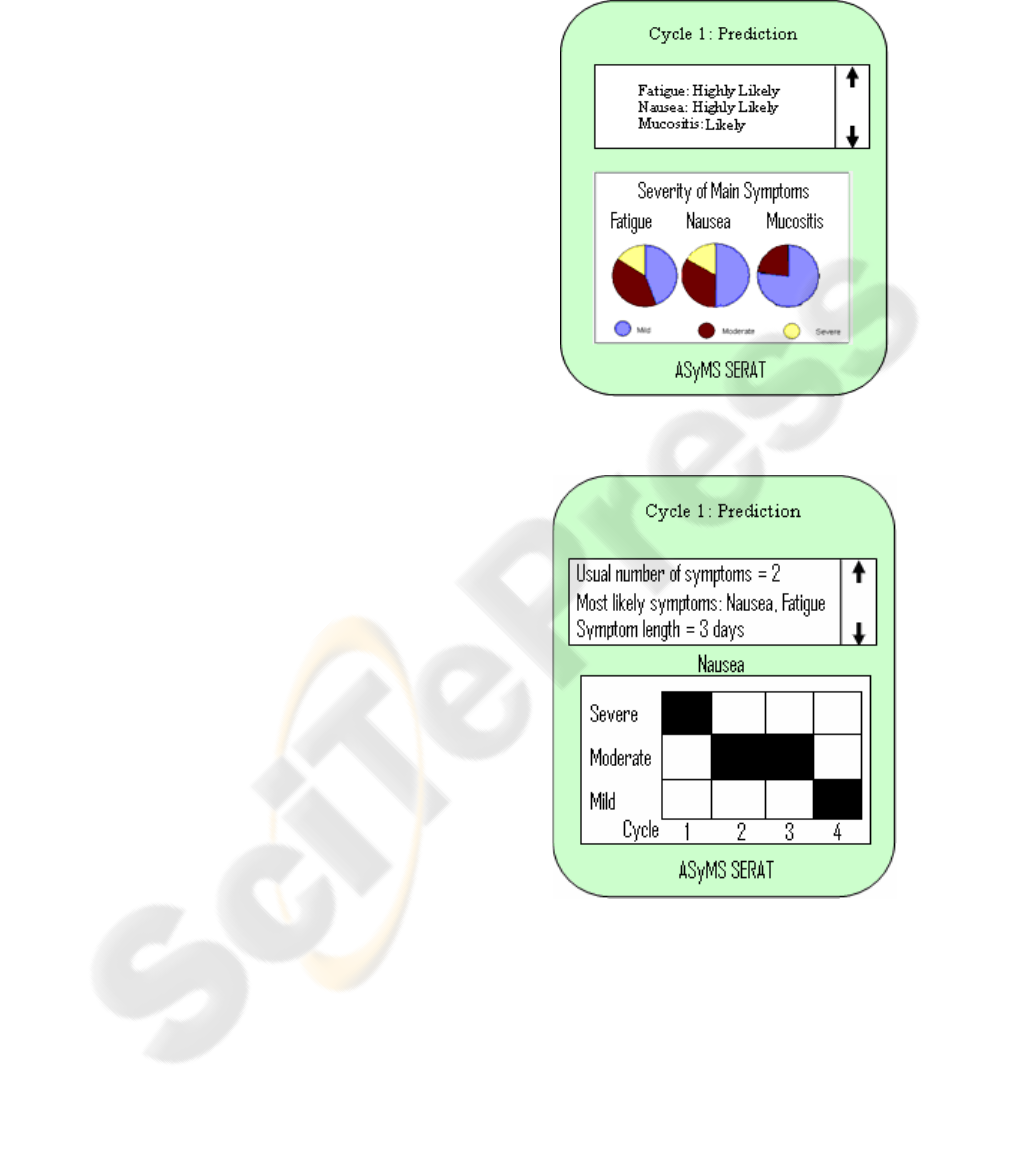
In Figure 1 we provide a sample screenshot
depicting information about side-effects a patient
may experience in their first cycle of treatment.
From the textual scrolling area at the top of the
screen, it is evident that this patient has a high
chance of experiencing both nausea and fatigue
during cycle 1, and some possibility of experiencing
mucositis. The pie charts show how severe each of
these symptoms could be. For example, about 17%
of cases of nausea will be severe, about 33% will be
moderate, and about 50% will be mild.
Figure 1: Screenshot of ASyMS©-SERAT showing likely
side-effects in cycle 1 of treatment
Figure 2: Screenshot of ASyMS©-SERAT showing
predicted severity of nausea symptoms across cycles 1-4.
The screenshot in Figure 2 provides longitudinal
information across all cycles. Such information can
be used to inform the patient about likely patterns of
symptoms over time. In the example shown, it is
evident that although the patient is experiencing
severe nausea in cycle one, this symptom will
become moderate during cycles two and three,
falling to mild by cycle four.
HEALTHINF 2008 - International Conference on Health Informatics
228

4 CONCLUSIONS AND FUTURE
WORK
Although research on the project is still in its infancy
and the ASyMS©-SERAT tool is very much a
prototype system, initial results from the risk
modelling analysis are very promising. From initial
testing it would seem that through use of ASyMS
©-
SERAT, accurate, personalised predictions of
possible side-effects can be made, providing patients
with a more informed view of their treatment, and
clinicians with the information required for
preventative measures or management of side-
effects to be applied where possible.
Once Phase II of ASyMS
©-SERAT tool is
complete, we hope to incorporate the tool in existing
ASyMS
© symptom management software. This
complete symptom prediction and management tool
will hopefully allow patients to feel more in control
of their symptoms, knowing in advance what to
expect, and how to manage the symptoms
accordingly. A larger, more comprehensive
evaluation of the ASyMS
©-SERAT tool will be
conducted as part of this work. We are currently in
the process of applying for further funding to
facilitate this next stage of the project.
ACKNOWLEDGEMENTS
We are grateful to the following organisations for
funding this project: Stirling University Research
and Enterprise (SURE) Ltd. and Fife & Forth Valley
Enterprise.
REFERENCES
Armer, J. M., Radina, M. E., Porock, D., & Culbertson, S.
D. 2003, "Predicting breast cancer-related
lymphedema using self-reported symptoms", Nursing
Research, vol. 52, no. 6, pp. 370-379.
Chen-Hardee, S., Chrischilles, E. A., Voelker, M. D.,
Brooks, J. M., Scott, S., Link, B. K., & Delgado, D.
2006, "Population-based assessment of
hospitalizations for neutropenia from chemotherapy in
older adults with non-Hodgkin's lymphoma (United
States)", Cancer Causes & Control, vol.17, no.5, pp.647-654.
Chow, E., Harris, K., & Fung, K. 2006, "Sucessful
validation of a survival prediction model in patients
with metastases of the spinal column", International
Journal of Radiation Oncology, Biology, Physics, vol.
65, no. 5, pp. 1522-1527.
Cohn, K. H. 1982, "Chemotherapy from the insiders
perspective.", The Lancet, vol. 319, pp. 1006-1009.
Cowie J., Oteniya, L., Coles, R. 2006 DIAGNOSIS OF
DEMENTIA AND ITS PATHOLOGIES USING
BAYESIAN BELIEF NETWORKS. In Proceedings
of the 8th International Conference on Enterprise
Information Systems: Artificial Intelligence and
Decision Support Systems, INSTICC Press, Paphos,
Cyprus. pp 291-295.
De Toro F, Ros E, Mota S, Ortega J. 2003 Non-invasive
Atrial Disease Diagnosis Using Decision Rules: A
Multi-objective Optimisation Approach. In: Fonseca
CM, Flemming PJ, Zitzler E, Kalyanmoy D, Thiele L,
eds. Evolutionary Multi-Criterion Optimization. Proc.
of 2nd Int. EMO Conference, Faro, Portugal. Springer:
638-647.
Dikken, C. & Sitzia, J. 1998, "Patients' experiences of
chemotherapy: side-effects associated with 5-
flurouracil and folinic acid in the treatment of
colorectal cancer", Journal of Clinical Nursing, vol. 7,
pp. 371-379.
Donohue, R. B. 2006, "Development and Implementation
of a Risk Assessment Tool for Chemotherapy-Induced
Neutropenia", Oncology Nursing Forum, vol. 33, no.
2, pp. 347-352.
Du, X. L., Osborne, C., & Goodwin, J. S. 2002,
"Population-based assessment of hospitalizations for
toxicity from chemotherapy in older women with
breast cancer", Journal of Clinical Oncology, vol. 20,
no. 24, pp. 4636-4642.
Dybowski R, Weller P, Chang R, Gant V. Prediction of
outcome in the critically ill using an artificial neural
network synthesised by a genetic algorithm. The
Lancet (vol 347): Elsevier, 1996: 1146-1150.
García-Pérez E, Violante A, Cervantes-Pérez F. 1998
Using neural networks for differential diagnosis of
Alzheimer disease and vascular dementia. Expert
Systems with Applications (vol.14). Elsevier; 219-225.
Kuderer, N. M., Dale, D. C., Crawford, J., Cosler, L. E., &
Lyman, G. H. 2006, "Mortality, morbidity, and cost
associated with febrile neutropenia in adult cancer
patients", Cancer, vol. 106, no. 10, pp. 2258-2266.
Lyman, G. H., Lyman, C. H., Agboola, O., & for the ANC
Study Group 2005, "Risk Models for Predicting
Chemotherapy-Induced Neutropenia", The Oncologist,
vol. 10, pp. 427-437.
Maguire, R., Miller, M., Sage, M., Norrie, J., McCann, L.,
Taylor, L., & Kearney, N. 2005, "Results of a UK
based pilot study of a mobile phone based advanced
symptom management system (ASyMS) in the remote
monitoring of chemotherapy related toxicity", Clinical
Effectiveness in Nursing, vol. 2005 Sep-Dec; 9, no. 3-
4, pp. 202-210
Mani S, Shankle WR, Pazzani MJ, Smyth P, Dick MB.
1997 Differential Diagnosis of Dementia: A
Knowledge Discovery and Data Mining (KDD)
Approach. In: Masys DR, ed. Journal of American
Medical Informatics Association supplement. Full
paper in extended proceedings of Proc. of AMIA.,
Hanley and Belfus : 875-880.
McCaughan, E. M. & Thompson, K. A. 2000,
"Information needs of cancer patients receiving
chemotherapy at a day-case unit in Northern Ireland",
ASYMS©-SERAT: A SIDE-EFFECT RISK ASSESSMENT TOOL TO PREDICT CHEMOTHERAPY RELATED
TOXICITY IN PATIENTS WITH CANCER RECEIVING CHEMOTHERAPY
229

Journal of Clinical Nursing, vol. 2000 Nov; 9, no.6,
pp. 851-858.
National Cancer Institute (2003) Common Toxicity
Adverse Events Criteria
Polednak, A. P. 2004, "Surveillance for hospitalizations
with infection-related diagnoses after chemotherapy
among breast cancer patients diagnosed before age
65", Chemotherapy.Vol.50(4)()(pp 157-161), 2004. no.
4, pp. 157-161.
Poleshuck, E. L., Katz, J., Andrus, C. H., Hogan, L. A.,
Jung, B. F., Kulick, D. I., & Dworkin, R. H. 2006,
"Risk factors for chronic pain following breast cancer
surgery: a prospective study", Journal of Pain, vol. 7,
no. 9, pp. 626-634.
Sanchez, C. d. M., Elustondo, S. G., Estirado, A., Sanchez,
F. V., Cooper, C. G., Romero, A. L., Otero, A., &
Olmos, L. G. 2006, "Palliative Performance Status,
Heart Rate and Respiratory Rate as Predictive Factors
of Survival Time in Terminally Ill Cancer Patients",
Journal of Pain & Symptom Management, vol. 31, no.
6, pp. 485-492.
Skalla, K. A., Bakitas, M., Furstenberg, C. T., Ahles, T., &
Henderson, J. V. 2004, "Patients' need for information
about cancer therapy", Oncology Nursing Forum, vol.
2004 Mar; 31, no. 2, pp. 313-319.
Talcott, J. A., Manola, J., Clark, J. A., Kaplan, I., Beard,
C. J., Mitchell, S. P., Chen, R. C., O'Leary, M. P.,
Kantoff, P. W., & D'Amico, A. V. 2003, "Time
Course and Predictors of Symptoms After Primary
Prostate Cancer Therapy", Journal of Clinical
Oncology, vol. 21, no. 1, pp. 3979-3986.
Tierney, A. J., Taylor, J., & Closs, S. J. 1992,
"Knowledge, expectations and experiences of patients
receiving chemotherapy for breast cancer.",
Scandanavian Journal of Caring Sciences, vol. 6, no.
2, pp. 75-80.
Vigano, A., Dorgan, M., Buckingham, J., Bruera, E., &
Suarez-Almazor, M. 2000, "Survival prediction in
terminal cancer patients: a systematic review of the
medical literature", Palliative Medicine, vol. 14, pp.
363-374.
Werner J.C & Fogarty T.C. 2001. Genetic programming
applied to Collagen disease and thrombosis. In: De
Raedt L, Siebes A, eds. Discovery challenge on
Thrombosis Data. European Conf. on Principles and
Practice of Knowledge Discovery in Databases.
Springer-Verlag, 14-20.
HEALTHINF 2008 - International Conference on Health Informatics
230
