
SELECTION OF AN ARTIFICIAL NEURAL NETWORK MODEL
TO DIAGNOSIS MOUTH-BREATHING CHILDREN
Felipe Mancini, Ivan Torres Pisa
Health Informatics Department, Federal University of São Paulol, Rua Botucatu 862, São Paulo, Brazil
Liu Chiao Yi, Shirley Shizue Nagata Pignatari
Pediatric Otorhinolaryngology Department, Federal University of São Paulol, São Paulo, Brazil
Keywords: Artificial neural networks, posture, mouth breathing, clinical decision support systems.
Abstract: A number of factors can lead to changes in body posture, basically determined by alterations in the natural
curvature of the spine. Such changes, in turn, may also result in secondary health problems. Mouth
breathing is thought to be one of these problems. Experiments with healthy nasal breathing individuals have
showed that when they are forced to breathe through their mouth only the natural shape of their spine curves
change. However the characterization of the spine curvature in mouth breathers has not been done yet and
the matter lies on the personal experience of the health professional. This study reports on the preliminary
findings of a broader research which attempts to characterize the changes in the behaviour of the spine,
caused by mouth breathing, by using artificial neural network modelling and data from 52 subjects. Four
different models – backprogation, learning vector quantization (LVQ), and self-organizing map (SOM) –
were tested for best performances in sensitivity and specificity in diagnosing mouth and nasal breathing
children. Competitive-learning-based algorithms – LVQ and SOM – presented the best performance for
current data set.
1 INTRODUCTION
Breathing is the first vital function developed at
birth becoming the main body function, and as such
should be cared for. Chronic mouth breathing is
associated with pediatric, allergy-related and
otorhinological complaints.
The narrowing of the pharynx has been reported
to be associated with forward extension of the neck
in the attempt to straighten the pharyngeal tube in
order to improve the reduced air flow through it
(Solow, 1984).
The skull, mandible, cervical portion of the
spine, and upper airways can be viewed as a system
in which the positioning of its parts are closely
related. Mouth breathing, a physiological change in
the correct respiratory process, determines postural
changes due to the altered, interrelated performance
of the muscles in each of the parts that integrates the
above mentioned system (Rocabado, 1979; Ribeiro,
2003). Studies on body posture of mouth-breathing
children have reported as characteristic features of
these individuals: forward positioned head and
shoulders, lordosis, protruded scapulas, frontal
depression of the thorax, and protruded abdomen (
Aragão, 1991; Liu, 2003). However, no studies
further characterizing the posture of mouth breathers
are currently available.
A computer-aided tool could be useful for health
professionals if it could characterize the postural
changes caused by mouth breathing. Artificial neural
networks (ANN) (Haykin, 1999) have been used
successfully in treating and analyzing biomedical
data
7
. ANN can provide a faster data analysis when
associations between factors and outcomes are not
linear or when there are a great number of factors
(high dimensionality) to be analyzed
(Lisboa, 2002).
Furthermore, ANN can lessen the influence of
confounding variables (noise) (Reggia, 1993).
The aim of this study is to report the preliminary
findings regarding the selection of an ANN model
for identifying mouth-breathing children through the
analysis of their posture.
197
Mancini F., Torres Pisa I., Chiao Yi L. and Shizue Nagata Pignatari S. (2008).
SELECTION OF AN ARTIFICIAL NEURAL NETWORK MODEL TO DIAGNOSIS MOUTH-BREATHING CHILDREN.
In Proceedings of the First International Conference on Health Informatics, pages 197-200
Copyright
c
SciTePress
2 MATERIALS AND METHODS
The data used in this study was collected at Imaging
Department and Pediatric Otorhinolaryngology
Department at Federal University of São Paulo
(UNIFESP), Brazil. Fifty two children were assessed
including 30 previously diagnosed as mouth-
breathing subjects and 22 nasal breathers. The
variables collected for analysis are shown in Table 1.
Table 1: Study variables.
Anthropometrics Diaphragm Posture
Sex
Cervical
Curvature
Age
Right side
Excursion (PD)
Lumbar
Curvature
Weight
Thoracic
Curvature
Height
Left side
Excursion (PE)
Pelvis Positioning
The imaging of diaphragm excursion was
obtained by videofluoroscopy and recorded for
analysis using Adobe Photoshop
®
(Adobe Systems
Inc.) software. Due to the limited size of the
fluoroscope screen, the imaging of the left and right
sides of the diaphragm was recorded separately. The
posture of the participating children was assessed
using photographs of the subjects’ left-side view on
which angles formed by key body features were
analyzed using a specially developed software
(Software for Posture Evaluation, SAPO) (Duarte,
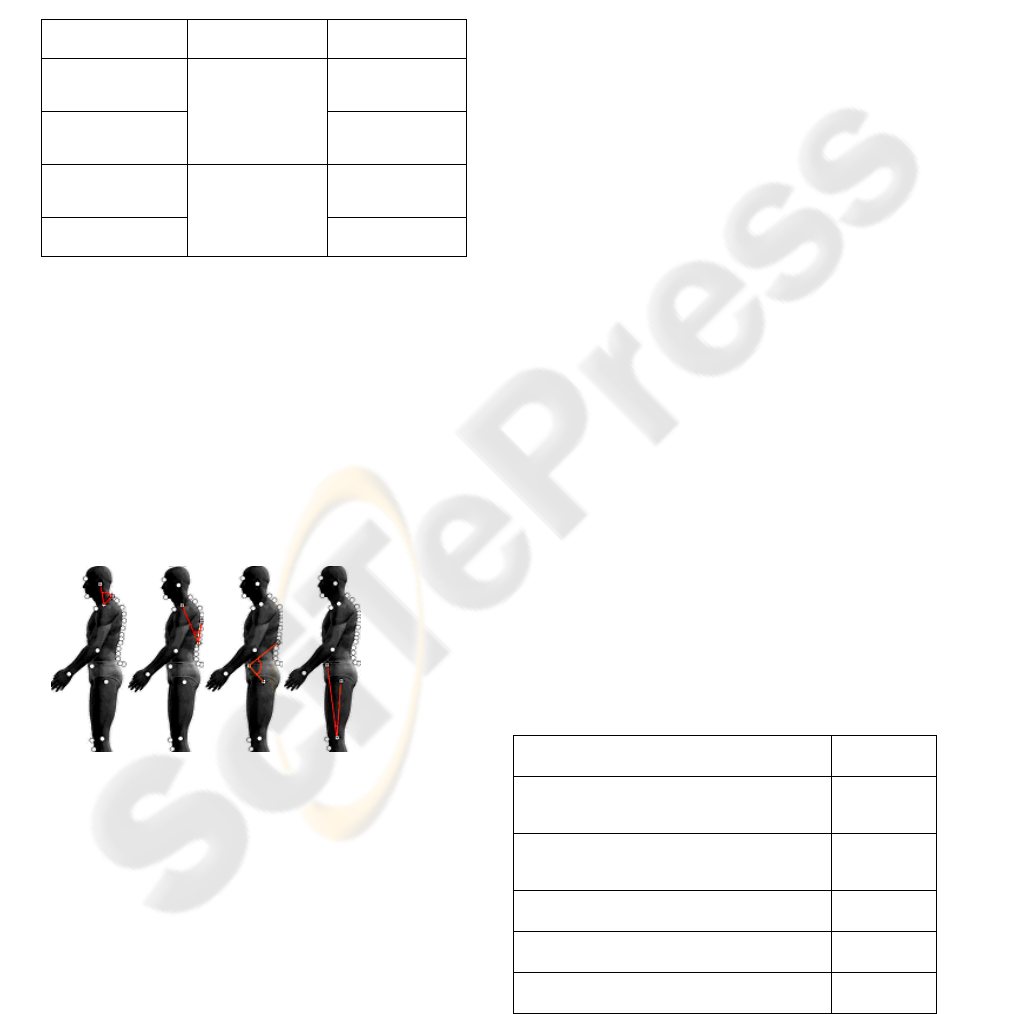
2006). Figure 1 shows these key features and the
angles they determined.
Figure 1: Representation of key points, and respective
angles they formed, used in the posture assessment: (a)
cervical curvature; (b) thoracic curvature; (c) lumbar
curvature; (d) pelvis positioning.
The data collected were used to determine the
ANN model that showed the best performance
among a number of models which included,
backpropagation (BP) (Haykin, 1999), learning
vector quantization (LVQ) (Kohonen, 1997), and
self-organizing map (SOM) (Kohonen, 1997). Such
a comparison was carried out through Matlab
®
development tool (The MathWorks Inc., Natick,
MA, USA) and implementation packages SOM
Toolbox package (Vesanto, 2000) for SOM and
LVQ models and the Neural Networks Toolbox
®
(The MathWorks Inc., Natick, MA, USA) for BP
model.
The structure of each ANN model was as
follows:
Backpropagation - Network structure: 20 nodes
in the first hidden layer, 5 nodes in the second
hidden layer and 1 node in output layer.
Training function: Levenberg-Marquardt.
Maximum number of epochs to train: 100.
Minimum performance gradient: 10
-10
;
LVQ - Network structure: 3 x 3 nodes. Vectors
prototypes initialization: linear.
Neighbourhood relationship: hexagonal.
Running length: 100. Learning rate used in
training: 0.001;
SOM - Network structure: 3 x 3 nodes. Vectors
prototypes initialization: linear.
Neighbourhood relationship: hexagonal.
Neighbourhood function: gaussian.
The performances of these ANN models were
measured by determining the rates for sensitivity and
specificity obtained with each model, when carrying
out the leave-one-out cross-validation (Burnham,
2004). Receiver Operating Characteristic (ROC)
(Metz, 1978) curve analysis was used to determine
the association ANN model-input pattern with the
best performance among those showing higher rates
of sensitivity and specificity.
Some investigation of factors potentially
associated with the shaping of spine curves – body
weight, height and excursion of the diaphragm – was
also carried out by inputting them either separately
or in combination with the data collected regarding
spine curvature (Table 2).
Table 2: Different input patterns used to determine the
influence of potential influencing factor on spine
curvature. The number between brackets indicates the
number of variables of a same subset.
Input Pattern (IP) IP Label
spine curvatures (4)
and diaphragm excursion (2)
IP 1
spine curvatures (4), diaphragm excursion
(2), weight (1) and height (1)
IP 2
spine curvatures (4) IP 3
diaphragm excursion (2) IP 4
weight (1) and height (1) IP 5
HEALTHINF 2008 - International Conference on Health Informatics
198
3 RESULTS
The sensitivity and specificity rates attained with
each of the study input patterns and each of the
study ANN model varied from 0.76 to 1 and from
0.57 to 0.99 respectively (Table 3).
The areas under the ROC curves for LVQ and
SOM inputting IP3 were 0.94 and 0.90, respectively,
for SOM inputting IP2 was 0.92 and inputting IP1
0.97.
Table 3: Specificity (sp) and sensibility (se) values
calculated through leave-one-out algorithm for different
data sets and for all ANN models analyzed in this study.
RNA
Models
SOM LVQ BP
Input
Pattern
sp se sp se sp se
PE1 0.97 0.97 0.99 0.90 0.98 0.94
PE2 0.98 0.95 0.96 0.96 0.86 0.94
PE3 0.98 0.93 0.98 0.97 0.96 0.90
PE4 0.88 0.87 0.88 0.90 0.88 0.90
PE5 0.80 0.76 0.67 0.76 0.67 0.76
4 DISCUSSION
The area under the ROC curve for IP2 (all variables
studied) inputted in SOM (0.92) indicates that this
input pattern improves the performance of SOM but
is still bellow the performance of LVQ using a much
simpler set of input variables (IP3).
However, a previous statistical test not shown in
this study (t-Student test) presented a statistically
significant association between the data collected on
the excursion of the diaphragm and the child being a
mouth breather. This association seems to reflect on
the area under the ROC curve (0.97) calculated for
SOM model when the variables associated with
spine curvature and diaphragm excursion (IP1) was
inputted.
Despite the input of the data referring to the
diaphragm excursion (IP1 and IP2) yielding a better
performance of SOM, the fluoroscopic investigation
is an additional medical examination that is not
usually performed in the clinical practice. Therefore,
if we are to deal with such limitation, LVQ model
associated with the input of variables of spine
curvature only (IP3) can presently be a good
alternative model due to its high rates of sensitivity
and specificity.
Including the variables weight and height to the
set spine curvature and diaphragm excursion (IP1) to
form IP2 resulted in lower performance of SOM
model according to ROC curve analysis. This agrees
with previous statistical analysis (Student’s t-test)
showing that the variation of weight and height
between mouth and nasal breathers was not
statistically significant.
Pesonen et al. (1996), Markeya et al. (2003), and
Ng & Chong (2006) compared the performance of
SOM and BP models in different tasks of
classification of biomedical data and found that BP
had higher rates of specificity and sensitivity. This
was not the case in the present study. In fact,
training in SOM is unsupervised, which would
support its worse performance in data classification
as compared with models using supervised training.
A potential explanation for the best performance of
SOM over BP in the present study is the limited set
of data (52 patients) for training and validation
currently available.
As previously mentioned, the present report is
part of a broader biomedical study. So far, the use of
computer-aided modelling focused the development
of a reliable diagnosis tool. This is deemed to be the
first step to develop a second and perhaps more
important tool that could indicate the severity of
changes in body posture and assist the decision
making regarding the prescription of a
physiotherapeutic treatment for such condition.
ANN modelling is a resource that could overcome
the complexity of such task.
5 CONCLUSIONS
The best rates of sensitivity and specificity were
attained for variables associated with the spine
curvature only (IP3) inputted in LVQ model. A
further comparison of performance using IP3 was
carried out between SOM and LVQ models using
their respective ROC curves which showed that the
area under the curve for LVQ model was larger
(0.94) than that for SOM (0.90).
Although supervised learning ANN models, such
as BP model, have been reported to yield better rates
of sensitivity and specificity, the present study found
that SOM and LVQ, both competitive-learning-
based algorithms, had better performance.
SELECTION OF AN ARTIFICIAL NEURAL NETWORK MODEL TO DIAGNOSIS MOUTH-BREATHING
CHILDREN
199

REFERENCES
Aragão W. Aragao´s function regulator, the
stomatognathic system. J Clin Ped Dent. 1991;
15(4):226-231.
Burnham, KP, Anderson D. Model Selection and Multi-
Model Inference. Berlim: Springer; 2004.
Duarte M. Software for Posture Evaluation (SAPO),
Brazil: University of São Paulo; 2006.
Haykin S. Neural Networks: a Comprehensive
Foundation. New Jersey: Prentice-Hall; 1999.
Kohonen T. Self-organizing Maps. Berlim: Springer-
Verlag; 1997.
Lisboa PJG. A Review of Evidence of Health Benefit from
Artificial Neural Networks in Medical Intervention.
Neural Netw. 2002; 15: 11-39.
Liu CY, Guedes ZCF, Pignatari SSN, Weckx LLM.
Alteração da postura corporal em crianças
respiradoras bucais. Fisioter Mov. 2003;16(3):29-33.
Markeya MK, Lo JY, Tourassib GD, Floyd CE, Self-
organizing map for cluster analysis of a breast cancer
database, Artif Intell Med, 2003, 27, 113–127.
Metz CE. Basic principles of ROC analysis. Seminars in
Nucl Med. 1978;8:283–98.
Ng EY & Chong C. ANN-based mapping of febrile
subjects in mass thermogram screening: facts and
myths. J Med Eng Technol. 2006; 30(5):330-7.
Pesonen E, Matti E, Juhola M. Comparasion of Different
Neural Network Algorithms in the Diagnosis of Acute
Appendicitis. Int J Biomed Comput. 1996; 40:227-233.
Reggia JA. Neural Computation in Medicine. Artif Intell
Med 1993; 5: 143-157.
Ribeiro EC, Soares LM. Avaliação espirométrica de
crianças portadoras de respiração bucal antes e após
intervenção fisioterapêutica. Fisioter Bras.
2003;4(3):163-7.
Rocabado M. Cabeza Y. Cuello – tratamiento articular.
Buenos Aires: Intermédica, 1979.
Solow B, Siersbaek-Nielsen S, Greve E. Airway adequacy,
head posture, and craniofacial morphology. Am J
Orthod. 1984;86:214-23.
Vesanto J, Himberg J, Alhoniemi E, Parhankangas J. SOM
toolbox for Matlab 5. Espoo: Helsinki University of
Technology; 2000.
HEALTHINF 2008 - International Conference on Health Informatics
200
