
MIAWARE SOFTWARE
3D Medical Image Analysis with Automated Reporting Engine
and Ontology-based Search
Bartłomiej Wilkowski
Informatics and Mathematical Modelling, Technical University of Denmark, Lyngby, Denmark
´
Oscar N. M. Pereira, Paulo Dias
IEETA-Institute of Electronics and Telematics Engineering of Aveiro, University of Aveiro, Aveiro, Portugal
Miguel Castro
Centro Hospitalar do Baixo Alentejo - Hospital Jos´e Joaquim Fernandes de Beja, Beja, Portugal
Marcin Janicki
Department of Microelectronics and Computer Science, Technical University of Ł´od´z, al. Politechniki 11, Poland
Keywords:
Computed axial tomography, Ontology, Radiological report, Image visualization.
Abstract:
This article presents MIAWARE, a software for Medical Image Analysis With Automated Reporting Engine,
which was designed and developed for doctor/radiologist assistance. It allows to analyze an image stack from
computed axial tomography scan of lungs (thorax) and, at the same time, to mark all pathologies on images
and report their characteristics. The reporting process is normalized - radiologists cannot describe pathological
changes with their own words, but can only use some terms from a specific vocabulary set provided by the soft-
ware. Consequently, a normalized radiological report is automatically generated. Furthermore, MIAWARE
software is accompanied with an intelligent search engine for medical reports, based on the relations between
parts of the lungs. A logical structure of the lungs is introduced to the search algorithm through the specially
developed ontology. As a result, a deductive report search was obtained, which may be helpful for doctors
while diagnosing patients’ cases. Finally, the MIAWARE software can be considered also as a teaching tool
for future radiologists and physicians.
1 INTRODUCTION
This article presents MIAWARE, a software, which
enables doctors and radiologists to carry out an ex-
amination of the patient’s lungs condition through the
close analysis of the computed axial tomography im-
ages and then, in parallel, to perform health state re-
porting process. Secondly, an intelligent search en-
gine for radiological reports is presented, together
with all its advantages over the ordinary searching
schemas. The screenshot of the MIAWARE’s applica-
tion graphical user interface is shown in Figure 1. MI-
AWARE was developed completely in Java program-
ming language together with some embedded native
code wrappers used.
Nowadays, it is very common that a radiologist
performs the analysis of the radiological images in its
own, favorite manner. Some of the radiologists report
all pathological changes encountered in the radiolo-
gical images speaking to a microphone and recording
their voice. Afterwards, the recorded tape is listened
out and a medical text report is produced. Another
radiologists write reports alone in the moment of per-
forming analysis.
There can be found some serious shortcomings in
such reporting schemas, which may affect the accu-
racy of the medical diagnoses. The main problem is
that reports differ in structure from radiologist to ra-
diologist. Every human has different way of think-
ing, different way of expressing things, remarks and
201
Wilkowski B., N. M. Pereira
´
O., Dias P., Castro M. and Janicki M. (2008).
MIAWARE SOFTWARE - 3D Medical Image Analysis with Automated Reporting Engine and Ontology-based Search.
In Proceedings of the First International Conference on Health Informatics, pages 201-206
Copyright
c
SciTePress
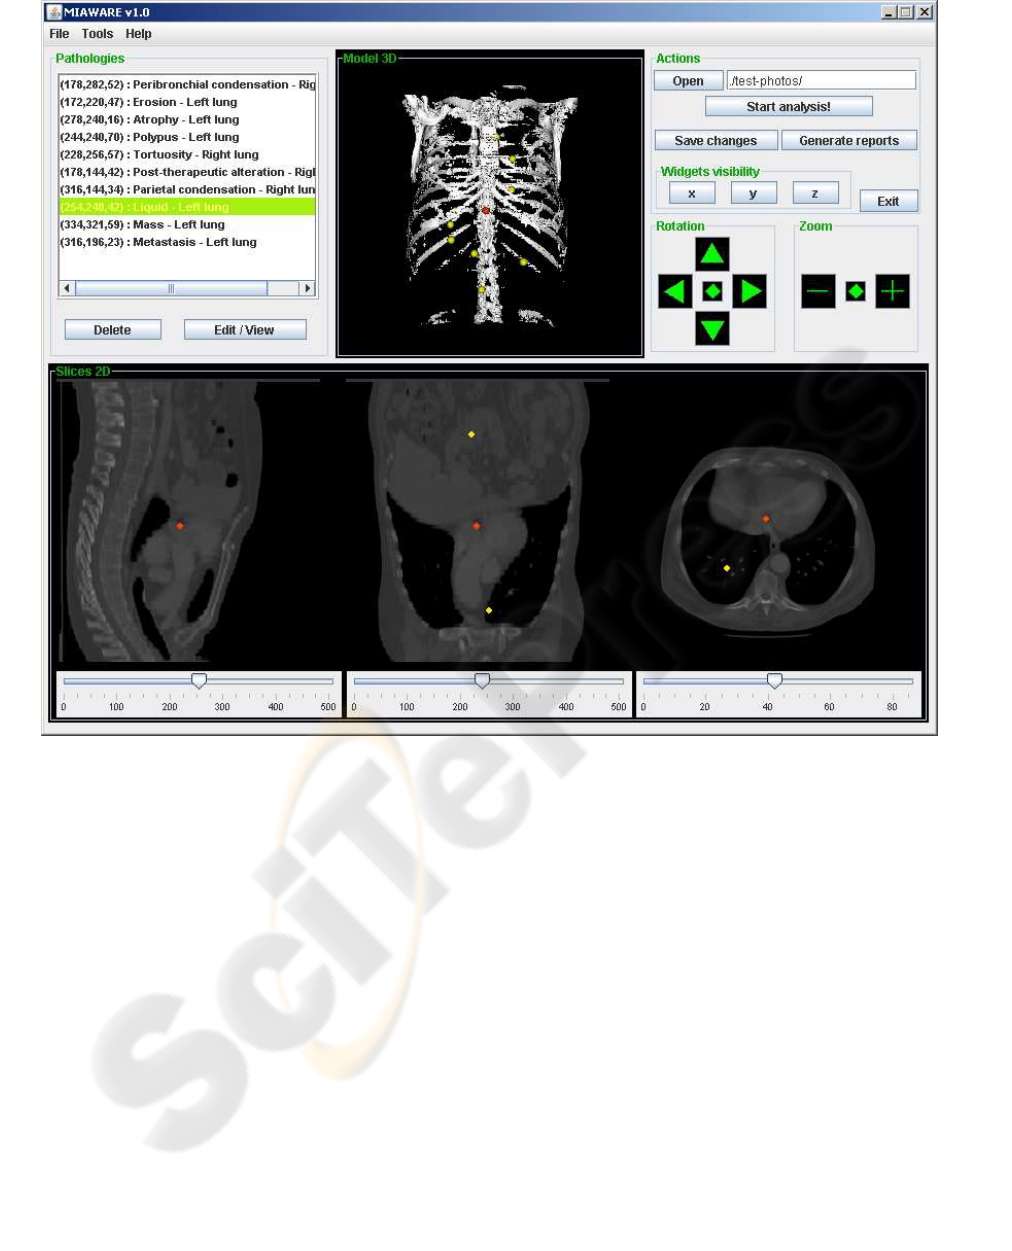
Figure 1: The graphical user interface of the MIAWARE software. The radiologist is able to cut the 3D model in order to find
pathologies on the 2D views, mark them by simple mouse click and attach necessary description. All pathologies are listed
out in the Pathologies panel. After the examination, the normalized medical report can be generated.
observations. It means that given the same medical
data, the same patient’s case to many radiologists in
order to make analysis, it can and will, almost surely,
produce many different reports with different layouts
and various observations on the patient’s health. As
a result, a doctor may interpret each of such reports
differently.
This is the reason why MIAWARE software’s
main objective is to generate medical reports in a nor-
malized way. Such reports should contain only me-
dical data, which describes in details the encountered
pathologies using a standardized layout. The radiolo-
gist does not use his words in order to report a patho-
logy, but oppositely, he fills up a provided reporting
form by choosing suitable medical terms.
Moreover, pathology reporting in MIAWARE is
performed in the moment of image analysis using
interactive graphical user interface. Radiologist can
mark the location of the pathology on the image and
associate with this point a necessary description. This
allows him to be always focused on the images. Fi-
nally, a normalized medical report over all patholo-
gical changes is generated by the software. The full
description of how a normalized reporting process is
performed with MIAWARE software is described in
details in section 3.
Normalization of the reports improves signifi-
cantly its further processing possibilities. One exam-
ple can be the developed search engine for the MIA-
WARE medical reports. An efficient search engine
for medical reports can be considered as very useful
and may help the doctor while making diagnoses.
Further sections will describe in details the archi-
tecture of the MIAWARE software and the functiona-
lity of its modules.
2 VISUALIZATION OF IMAGES
The entire visualization of CAT scan stack images
and 3D model creation is performed using the Vi-
sual Toolkit (VTK - www.vtk.org) (Schroeder et al.,
1998). VTK is made in C++ language, but it provides
suitable wrapper classes for Java. Moreover, ImageJ
(http://rsb.info.nih.gov/ij/) software classes are used
in order to obtain properties of the analyzed CAT im-
age stack.
MIAWARE graphical user interface provides a 3D
view of the radiological stack of images. This is gene-
rated using VTK wrapper classes, which create a spe-
cial pipeline. After loading image data into memory,
a contour filter is applied followed by proper mapping
of polygonal data and graphics primitives. Finally, a
3D actor is added to the special panel, which actually
is a rendering window for three-dimensional scene.
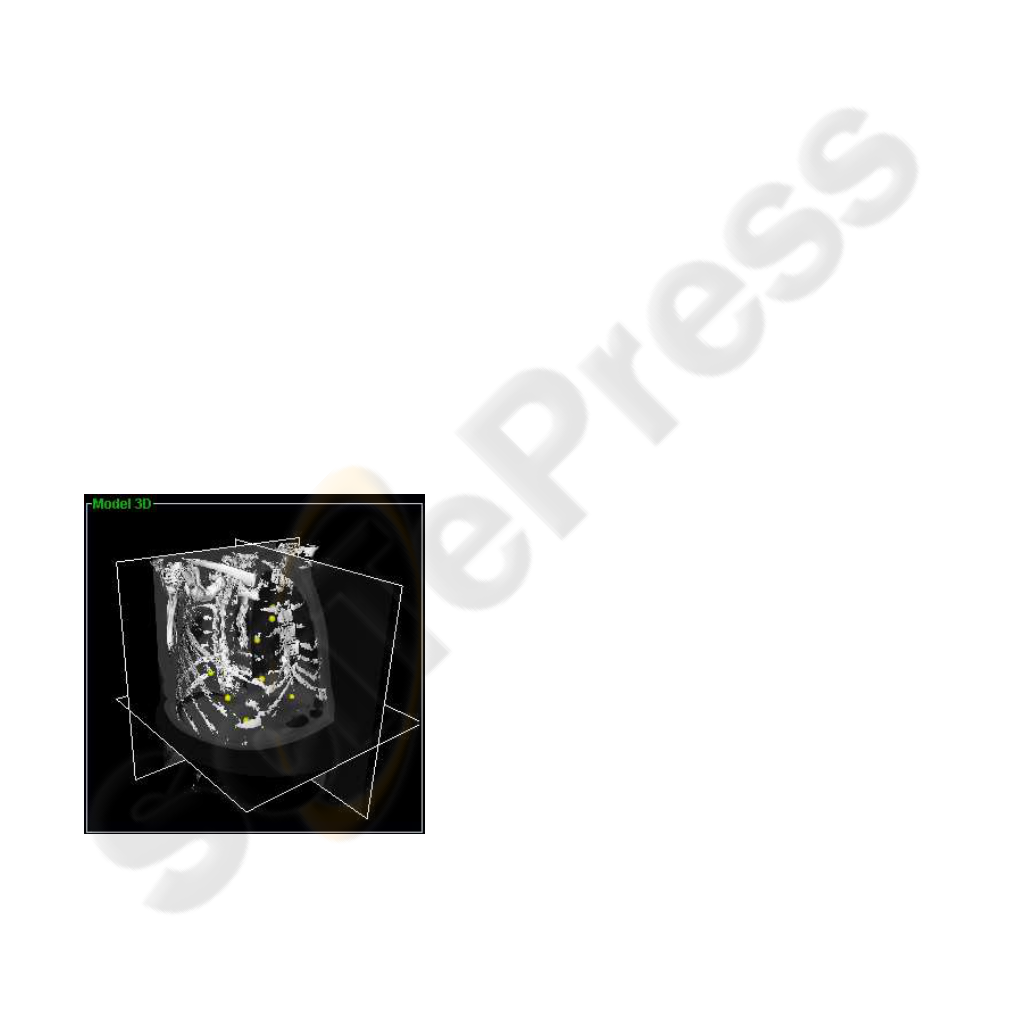
The visualization in MIAWARE consists also of
three 2D cross-sectional image views. They are gene-
rated by three widgets (interactive window objects),
present on the 3D scene, which are able to cut the
model in three plane directions and provide 2D im-
age data for the cross-sectional views (see Figure 2).
Widgets can be easily moved by the radiologist along
its respective direction axis in order to perform model
cutting. It should be mentioned, that CAT scan pro-
vides the radiologist with image stack in axial plane.
The image data for two other 2D planes and the 3D
model are obtained and rendered by the software af-
ter a proper initial stack data processing.
Figure 2: A view of the 3D model with three visible cutting
widgets.
Finally, the panels, which display cross-sectional
views of the model are enhanced with a very impor-
tant feature. Radiologist is able to mark any patho-
logy, encountered during the analysis, directly on the
2D view by a simple left mouse button click over that
location. The clicked point is automatically marked
on all three cross-sectional views (as a yellow circle)
and 3D scene (yellow sphere). Afterwards, the radi-
ologist is able to attach precise information and de-
scription of that physiological change to the marked
point. The description of how the pathology informa-
tion is defined and added to the specified location is
presented in section 3. It should be also remembered
that all the pathologies defined by the radiologist can
be saved and retrieved for further analysis of the same
CAT stack.
3 PATHOLOGY REPORTING
As it was mentioned in the introductory part of this ar-
ticle, the reports generated with MIAWARE software
are normalized. This is achieved thanks to a special
pathology reporting form implemented in this soft-
ware. According to the previous section, radiologist
is able to mark any location on the 2D image in or-
der to define and describe the encountered pathology.
Such an information is added through a combobox-
based form, which provides radiologist with medical
terms necessary for an effective name, type and pa-
thology location specification. The most innovative
here is the fact that the radiologist cannot describe
those findings with his own words, but can use only
the specific medical vocabulary provided by the appli-
cation. Consequently, MIAWARE software is able to
create normalized medical reports according to the in-
formation about all pathologies introduced earlier by
the radiologist.
Arrangement and selection of the vocabulary was
made after the consultation with doctor Miguel Cas-
tro working in hospital in Beja (Centro Hospitalar do
Baixo Alentejo - Hospital Jos´e Joaquim Fernandes de
Beja) and RadLex (A Lexicon for Uniform Indexing
and Retrieval of Radiology Information Resources)
term browser, which can be found on the Radiologi-
cal Society of North America web page (RSNA.org,
2007). RadLex term browser was created in order to
unify the radiological vocabulary used during image
analysis and reporting procedures.
The entire vocabulary is kept in the XML file to-
gether with a declaration of the vocabulary for all
comboboxes (set of medical terms), which are pre-
sented to the radiologist during the pathology defini-
tion. A vocabulary set presented in any subsequent
combobox is dependent of a previous radiologist’s
choice. For example, if radiologist has defined that
the pathology is located in the left lung, the next com-
bobox will offer him to choose all subparts (lobes) of
left lung. The example pathology definition steps in
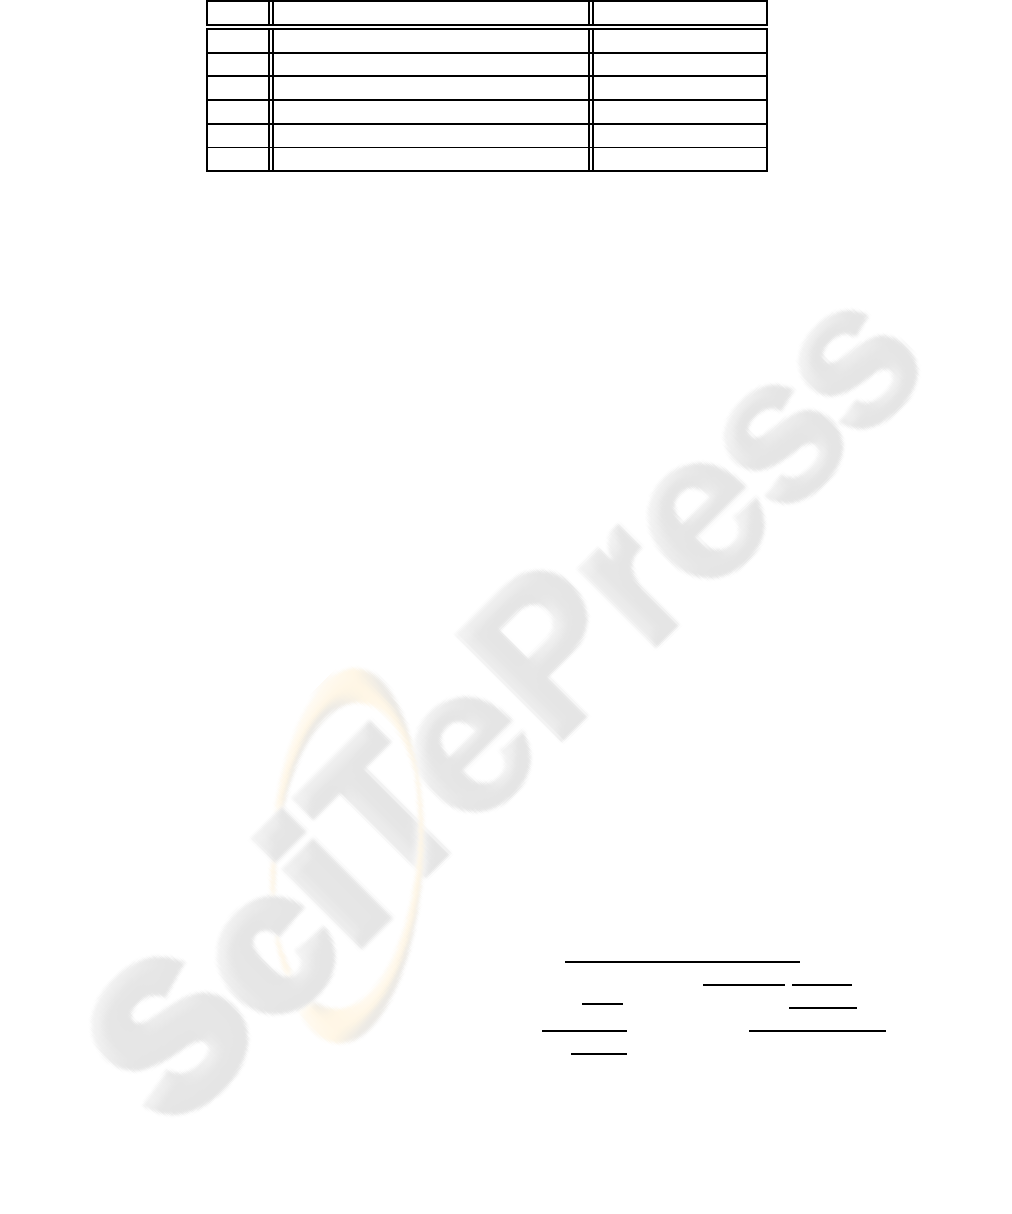
Table 1: Example pathology definition steps in MIAWARE.
Step Combobox title Selected value
1. Morphophysiological process Neoplastic process
2. Neoplastic process Mass
3. Location Left lung
4. Left lung location Upper lobe
5. Left lung upper lobe location Lingula
6. Left lung upper lobe lingula location Superior segment
MIAWARE is presented in Table 1.
When the analysis of the CAT stack is finished,
radiologist is able to generate a final medical re-
port over all the pathologies already defined. It is
done by pressing the Generate reports button. This
action produces reports in two formats: Plain Text
Format (TXT) and Rich Document Format (RDF -
www.w3c.org/RDF/), computer understandable for-
mat. The first one can be verified and analyzed later
by the doctor in order to make diagnosis. The gene-
rated text report has a well defined structure and its
layout differs significantly from the recently created
reports. The format of medical reports requires still
some discussion over its layout and the ways how it
should be created. MIAWARE text report format is
only a suggestion, which is intended for further im-
provement and development. A short fragment of the
sample MIAWARE text report is presented here:
**** MIAWARE REPORT *******
Generation date: Jun/27/2007
*****************************
Control Point no. 1 : (x,y,z) = (178,282,52)
Specifications:
Morphophysiological process: General process
General process: Peribronchial condensation
Location: Right lung
Right lung location: Lower lobe
Right lung lower lobe location:
->Lateral basal segment
******************************
Control Point no. 2 : (x,y,z) = (172,220,47)
Specifications:
Morphophysiological process: General process
General process: Post-therapeutic alteration
Location: Right lung
Right lung location: Middle lobe
Right lung middle lobe location:
->Medial segment
...
****** END OF REPORT ******
The second type of reports, in RDF format, is
created for further processing of its content (report
searching). It is described in details in section 4.
4 MEDICAL REPORT
SEARCHING
This section describes the structure of the RDF medi-
cal reports and the MIAWARE search engine together
with an ontology for lungs developed specially for
this purpose.
4.1 RDF Reports
As it was already mentioned, the RDF format for
medical reports is required for further information
processing and searching. RDF model introduces
description of resources by statements and its data
model contains of three components: resources, prop-
erties and statements (called as triples). Resources are
any datatype items, which can have any value defini-
tion (statement) through some given relation (prop-
erty). Any statement can consist of a new triple
resource-property-statement. “Just as an English sen-
tence usually comprises a subject, a verb and objects,
RDF statements consist of subjects, properties and
objects” (Gomez-Perez et al., 2004).
Table 1 represents one example of pathology def-
inition. The final medical report will usually contain
more such definitions grouped in some specific way.
The data gathered in the Table 1 can be represented
as normal, lexical group of sentences describing any
pathology found. For example:
‘A morphophysiological process was found. It
is in the form of a neoplastic process of the
type mass. It is located in the left lung, in its
upper lobe, exactly in the superior segment of
the lingula.’
Such a group of sentences can be represented as
resource-property-statement model and is used in
MIAWARE medical RDF reports. In this case, the
first underlined word is a resource and the rest is a
statement. As our statement consists of group of re-
sources it has to be analyzed further. Then the first
resource of the previous statement is a resource and
the rest group another statement. Such embedded
structure of the resource-property-statementis created
through RDF reified statements. It should be men-
tioned that the properties (which connect resources
with the statements) in the aboveexample are: in form
of, of the type, etc.
The 3RDF reports generated by MIAWARE soft-
ware keep the pathology information in the manner
presented above. It should be only mentioned that the
role of properties in our reports play titles of the sub-
sequent comboboxes. These names are taken from
the XML file used by pathology definition form, de-
scribed in section 3.
4.2 Ontology-based Report Searching
The radiological examinations are carried out quite
often in such places as hospitals, private and pub-
lic surgeries or any other medical institutions. As
a result, it produces a great amount of medical re-
ports in relatively short time. Such reports should be
kept and gathered together for future usage as refer-
ences to previously encountered and defined patholo-
gies or diseases. Manual searching of great amount
of documents is time consuming. As a result, an in-
telligent search engine of medical reports can signif-
icantly speed-up the disease recognition process, as,
considering given criteria, it would immediately re-
sult in sets of references to the archive reports with
similar pathological symptoms in other patients, the
resultant diagnoses and applied treatments.
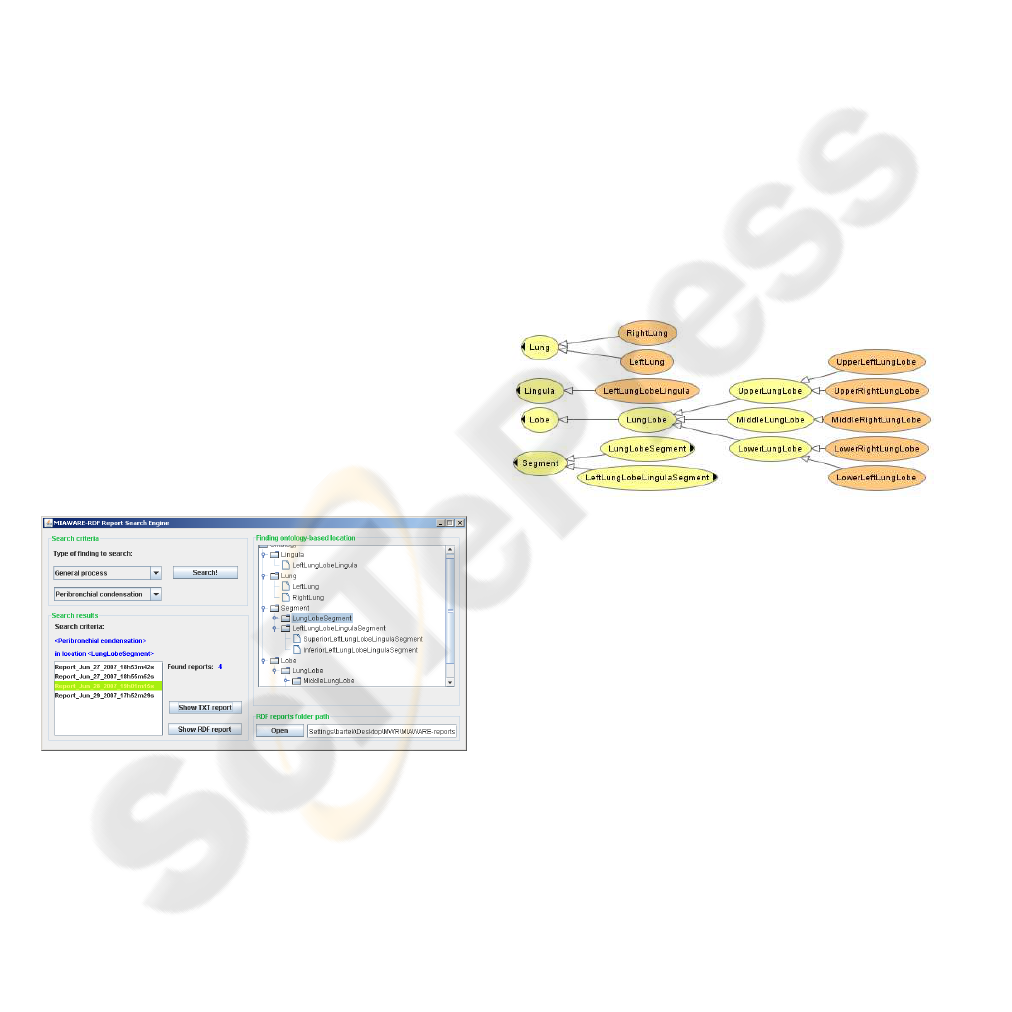
Figure 3: The graphical user interface of the MIAWARE
intelligent search engine. The sets of RDF medical reports
generated by MIAWARE software can be filtered out ac-
cording to the given criteria: position in lungs and patho-
logy type. The searching process is performed on a logical
basis (not in a lexical way, as ordinary search engines).
The search engine for medical reports developed
together with MIAWARE software (Figure 3) is able
to find all reports where exist some specified patho-
logy defined in a lung part (specified as a search crite-
ria) or any of its subparts. This adds some intelligence
to the searching process, what is explained on the sim-
ple example. Let’s suppose that a doctor wants to find
all reports with a definition of a tumour (first search
criterion), which had been found in left lung. Let’s
have a report with two pathologies defined:
• Polypus in Right lung
• Tumour in Lung lingula
An ordinary lexical search will respond that this re-
port does not match search criteria as the first pa-
thology is not a tumour and the second pathology,
which is a tumour, is not located in left lung. Oppo-
sitely, the MIAWARE search engine will accept this
report as matching the given criteria, because it can
deduce that Lung lingula is a subpart of the left lung.
Such a logical deduction is performed by our search
engine thanks to the lungs ontology, which defines
and provides the part-whole relations between the el-
ements of the lungs. This ontology was developed
using Jena (http://jena.sourceforge.net/) and Prot´eg´e
(http://protege.stanford.edu/) software. Sample visu-
alization of the taxonomy of the classes taken from
our lungs ontology is presented in Figure 4.
Figure 4: Lungs ontology - hierarchy of classes (created
with OWLViz (Drummond, 2007)). Such a taxonomy of
classes, related to each other through the specific proper-
ties defined in an ontology, allow the search engine to make
intelligent (logical) decisions.
Our ontology was developed based on the follow-
ing article references: (Mejino Jr et al., 2003) (Don-
nelly et al., 2005) (Guarino and Welty, 2000) (Guar-
ino and Welty, 2004) (Guarino et al., 2000) (Guarino
and Welty, 2002) (Michael et al., 2001) (Knublauch,
2004) and book positions: (Gomez-Perez et al., 2004)
(Horridge, 2004). Moreover, the information about
anatomical structure of the lungs was taken from
Anatomy and Physiology book (Seeley et al., 2005).
The ontology is made in Web Ontology Webpage -
OWL (www.w3c.org/2004/OWL/) format.
The search algorithm takes as the criteria the name
of the pathology and its location in the lungs. Next,
it deduces from the ontology all the subparts of the
given lung location and performs comparison of ev-
ery single pathology description taken from any medi-
cal report (in RDF format) with the search criteria. If

there is at least one such a pathology definition which
agrees with criteria, it displays respective report as a
result. Consequently, the doctor can view and read
such a report very easily. We suppose that such fil-
tering of radiological reports may improve doctor’s
diagnosis and speed-up his decisions.
5 CONCLUSIONS
The presented software is only a first prototype and
needs many improvements to be useful in a real con-
text. One of the reason for this is the fact that the vo-
cabulary used during pathology reporting is not suffi-
cient and requires significant expansion and redefini-
tion. However, this software can be considered as a
strong fundament for future development in order to
achieve a fully operational version.
The ideas presented herein are considered as a po-
tential improvement for image-based medicine and
radiological analysis course. MIAWARE software fa-
cilitates radiologists with simultaneous analysis of the
CAT stack images and pathology reporting without
looking away from the monitor. Consequently, the
radiologist can be concentrated all the time on the ex-
amined images. Moreover,pathologiescan be marked
on the images and possess the necessary characteris-
tics of respective pathology.
Furthermore, the radiological reports generated
with MIAWARE software are always normalized,
keeping identical structure and layout independently
on the person who performs the analysis. Such a nor-
malization, may help the doctors in better understand-
ing of the reports and it makes room for further report
processing and searching.
The intelligent search engine allows rapid medi-
cal reports filtering according to the pathologies de-
fined in there. Providing MIAWARE search engine
with the knowledge about the parts relationship in the
lungs, it is able to deduce internal elements of the
specified lung part and to perform report searching
of the pathologies not only in the determined lung lo-
cation, but also in its subparts. This can actually be
described as a logical searching of pathologies in the
medical reports.
All the features presented by MIAWARE software
can lead to the assumption that their implementation
into real life may result in more efficient medical di-
agnosis and faster disease recognition process. More-
over, MIAWARE can be used for investigation and
teaching of normalized reporting processes, patholo-
gies and findings classification, statistical processing,
etc. Thanks to that, the future radiologist could get
their degree through intensivepractice with real cases.
Finally, the reports generated by the students using
MIAWARE software could be evaluated in an auto-
matic manner.
ACKNOWLEDGEMENTS
This work is supported by Lundbeckfonden through
the program www.cimbi.org.
REFERENCES
Donnelly, M., Bittner, T., and Rosse, C. (2005). A for-
mal theory for spatial representation and reasoning
in biomedical ontologies. Artificial Intelligence in
Medicine, 36:1–27.
Drummond, N. (2007). Owlviz - ontology visualization tool
webpage.
Gomez-Perez, A., Corcho, O., and Fernandez-Lopez,
M. (2004). Ontological Engineering : with ex-
amples from the areas of Knowledge Management,
e-Commerce and the Semantic Web. First Edition
(Advanced Information and Knowledge Processing).
Springer.
Guarino, N. and Welty, C. A. (2000). A formal ontology
of properties. Lecture Notes in Computer Science,
1937:97–112.
Guarino, N. and Welty, C. A. (2002). Evaluating ontolog-
ical decisions with ONTOCLEAN. Communications
of the ACM, 45:61–65.
Guarino, N. and Welty, C. A. (2004). An overview of onto-
clean. Handbook on ontologies, pages 151–172.
Guarino, N., Welty, C. A., and Partridge, C. (2000). To-
wards a methodology for ontology based model en-
gineering. IWME-2000 - International Workshop on
Model Engineering.
Horridge, M. (2004). A Practical Guide To Building OWL
Ontologies With The Protege-OWL Plugin. University
of Manchester, 1 edition.
Knublauch, O. H. (2004). Weaving the biomedical semantic
web with the protege owl plugin.
Mejino Jr, J. L., Agoncillo, A. V., Rickard, K. L., and
Rosse, C. (2003). Representing complexity in part-
whole relationships within the foundational model of
anatomy. American Medical Informatics Association
Annual Symposium, pages 450–454.
Michael, J., Mejino Jr, J. L., and Rosse, C. (2001). The
role of definitions in biomedical concept representa-
tion. American Medical Informatics Association Fall
Symposium, pages 463–467.
RSNA.org (2007). Rsna - radlex term browser webpage.
Schroeder, W., Martin, K., and Lorensen, B. (1998). The
Visualization Toolkit- An Object Oriented Approach
to 3D Graphics. 2nd ed. Prentice Hall.
Seeley, R. R., Stephens, T. D., and Tate, P. (2005). Anatomy
and Physiology. McGraw-Hill Higher Education.
