
SELF-ORGANIZING MAPS FOR CLASSIFICATION OF THE
RIO DE JANEIRO STATE CITIES BASED ON ELECTRICAL
ENERGY CONSUMPTION
Luiz Biondi Neto, Pedro Henrique Gouvêa Coelho
Faculty of Engineering (FEN), State University of Rio de Janeiro (UERJ), Rio de Janeiro, RJ, 20550-900, Brazil
João Carlos Soares de Mello, Lidia Angulo Meza
Fluminense Federal University (UFF)
Keywords: Self-Organizing Maps, Classification and Energy Management.
Abstract: The purpose of the present work is to classify the 31 cities of Rio de Janeiro State in Brazil based on their
energy consumption. The point is to search new criteria to cluster the users in order to establish, in a more
homogeneous way, indices of energy quality. Moreover, it aims to bring about a framework from which it
will be possible to determine the relative efficiency among the cities of all Brazilian states. Traditionally this
classification task is carried out using a statistical technique known as K-means, in which only five variables
are considered: the size of the main network in Kilometres, the offered power, the number of users, the
average monthly consumption and the covered area. This paper uses the Kohonen Self Organizing Maps
technique applied to 21 variables, including the residential, industrial, public and rural consumptions in
order to seek a better classification.
1 INTRODUCTION
The National Electrical Power Agency, ANEEL,
seeks to establish favorable conditions in such a way
that the Brazilian electrical energy market evolves in
harmony among the agents, for the benefit of the
society. ANEEL is the government energy
regulation agency responsible for guaranteeing
electrical energy quality, determined by a specific
index, and by establishing goals for each group of
energy users. Currently this quality index is checked
by two parameters: equivalent outage duration per
consumption unit that indicates the average number
of hours in which the user has no electric energy for
a period, usually a month, and the outage equivalent
frequency per consumption unity indicating how
many times, on average, there was an outage in the
unity (residential, commerce, industry etc).
(Tanure and Carvalho, 2000) uses the K-means
technique that requires, a priori, the desired number
K of clusters.
The statistical method K_Means, evaluates
initially classes by uniformly distributing them in
space and afterwards clustering class by class in an
iterative process using the minimum distance
technique (Tou and Gonzalez, 1974). In that way,
the more clustered the database is the better will be
the classification quality. So, the database will be
considered set up when the user defined number of
iterations is reached or when a previous established
change of class criterion is achieved (Anderberg,
1973).
Energy companies suggested new criteria for
clustering energy users in the advent of the ANEEL
agency creation in 2000. (Queiroz and Borba, 2001)
suggest a variable classification including a group
involving electrical network characteristics and
another one corresponding to variables strongly
related to energy consumption. Correlated
information on that matter can be found in
(Sperandio, Coelho and Queiroz, 2003) and (Ramos,
2000).
This work presents a new approach to cluster the
Rio de Janeiro (Brazil) state cities, using Kohonen
447
Biondi Neto L., Henrique Gouvêa Coelho P., Carlos Soares de Mello J. and Angulo Meza L. (2007).
SELF-ORGANIZING MAPS FOR CLASSIFICATION OF THE RIO DE JANEIRO STATE CITIES BASED ON ELECTRICAL ENERGY CONSUMPTION.
In Proceedings of the Ninth International Conference on Enterprise Information Systems - AIDSS, pages 447-450
DOI: 10.5220/0002392504470450
Copyright
c
SciTePress
map unsupervised algorithms (Kohonen, 2001)
where the previous specification of the number of
clusters is not required.
Unlike the Hebbian neural networks, in Kohonen
competitive and unsupervised learning neural
networks, only one output neuron remains active and
each neuron represents a model in the data state
space. In that case, no mapping or data input
classification is known before the training (Haykin,
1999). Clusters are developed in the training period
by means of similarity criteria indicating similar
features pattern clusters.
Each input neuron receives identical sets of input
information that compete each other in order to be
the winning neuron. In other words, each neuron
focus in a different area of the input space and its
output are used to generate the input space structure
(Haykin, 1999).
The software used in this work was Matlab 7.0
including the toolbox SOM (s
elf-organizing maps)
(Kohonen, Hynninen, Kangas, Laaksonen, 1996)
developed by Helsinki University of Technology.
2 PROBLEM DESCRIPTION AND
MODELLING
The problem is to classify the cities of Rio de
Janeiro state (Brazil) in groups of cities with similar
profiles as far as electrical energy demands are
concerned. There is no previous knowledge of such
classification nor there are no restrictions regarding
the number of desired clusters.
The database used in this application comprises
91 cities of the Rio de Janeiro state. The cities are
not listed by name but will identified by numbers
from 1 to 91
For each city there is a set of 21 variables
involving:
Monthly consumption;
Residential consumption;
Industrial consumption;
Commercial consumption;
Rural consumption;
Public illumination consumption;
Public services consumption;
Public power consumption;
Self consumption;
Overall or total consumption.
The data were treated statistically in the beginning
so as to avoid missing values, outliers and strongly
correlated values. In the end, it was possible to
achieve a data set represented by a matrix 91X21
that is not shown in this paper for the sake of space
optimization and readability.
The matrix is then set to be the input of the
competitive SOM yielding 21 inputs regarding the
variables corresponding to the 91 investigated cities.
3 RESULTS
Thirty SOM networks having grids of different
dimensions were tested in order to check the
clustering achieved by the Kohonen maps. A
hexagonal topology was used and a learning rate
varied from 0.01 to 0.1 with unity neighbourhood.
This paper presents the results of networks with
[6X6] grids, enabling up to 36 clusters and [3X3]
grids enabling up to 9 clusters.
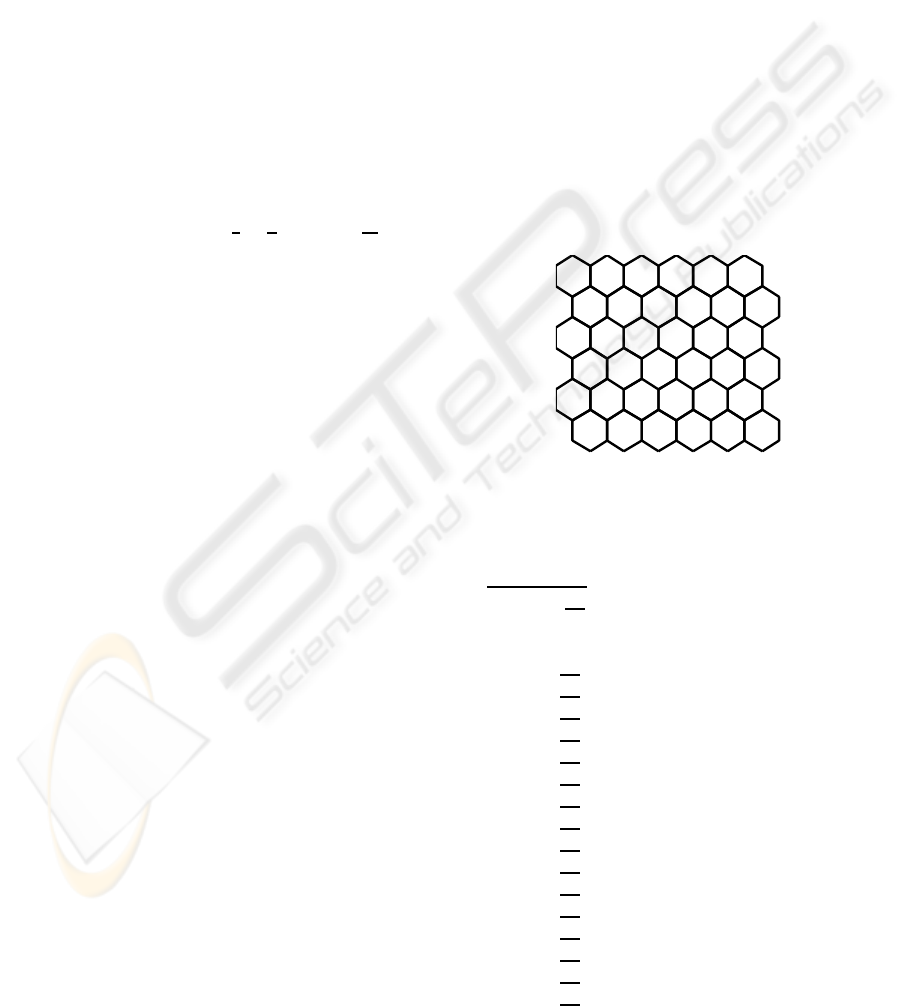
Figure 1 shows a configuration for a [6X6] grid.
[6 x 6]
Figure 1: [6 X 6] Grid.
The results are the following:
Grid [6 x 6]
( 27 clusters were found )
Cluster #01
(26 cities): 02-04-14-17-18-21-22-
24-26-31-36-38-45-55-57-59-61-64-65-68-75-
78-82-83-86-89
Cluster #02
(07 cities): 20-28-32-43-44-53-70
Cluster #03
(04 cities): 05-77-80-88
Cluster #04
(03 cities): 03-39-46
Cluster #05
(01 cities): 48
Cluster #06
(01 cities): 60
Cluster #07
(05 cities): 10-19-23-76-79
Cluster #08
(06 cities): 35-52-63-66-81-90
Cluster #09
(02 cities): 33-41
Cluster #11
(03 cities): 09-15-74
Cluster #13
(06 cities): 06-11-42-71-73-84
Cluster #14
(02 cities): 50-51
Cluster #15
(01 cities): 30
Cluster #16
(04 cities): 01-12-29-85
Cluster #17
(01 cities): 54
Cluster #18
(01 cities): 49
Cluster #19
(03 cities): 13-40-69
ICEIS 2007 - International Conference on Enterprise Information Systems
448
Cluster #20
(01 cities): 87
Cluster #21
(03 cities): 07-37-62
Cluster #23
(02 cities): 25-72
Cluster #24
(01 cities): 47
Cluster #25
(03 cities): 27-34-58
Cluster #26
(01 cities): 56
Cluster #28
(01 cities: 08
Cluster #32
(01 cities): 16
Cluster #34
(01 cities): 91
Cluster #36
(01 cities): 67
In this case although cluster 01 comprises 26
cities, 12 clusters were found having only one city
and 03 clusters having 02 cities, suggesting
improvements.
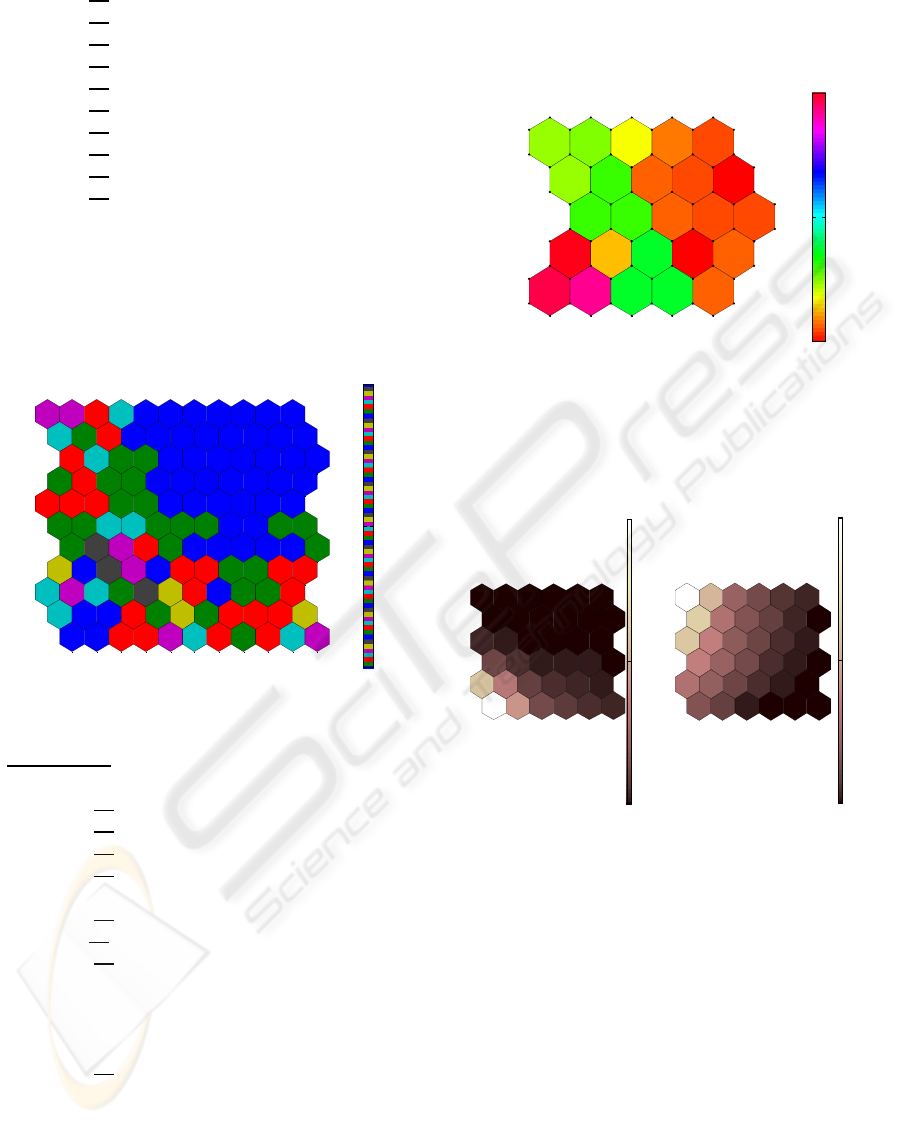
The U-matrix, represented in Fig. 2, shows
Euclidian distances by means of a colour coding.
Grid [3 x 3]
(08 clusters were found)
Cluster #01
(06 cities): 09-16-29-37-48-62
Cluster #02
(05 cities): 08-15-54-60-74
Cluster #03
(01 cities): 91
Cluster #04
(10 cities): 01-03-07-12-30-39-46-
56-85-87
Cluster #05
(04 cities): 25-47-49-72
Cluster #06
(01 city): 67
Cluster #07
(55 cities): 02-04-05-06-10-11-13-
14-17-18-19-20-21-22-23-24-26-28-31-32-35-
36-38-42-43-44-45-50-51-52-53-55-57-59-61-
63-64-65-66-68-69-70-71-73-75-76-78-79-81-
82-83-84-86-89-90
Cluster #08
(09 cities): 27-33-34-40-41-58-77-
80-88
In [3 x 3] grid , Clusters #01, #02, #07, #13 e #14
of grid [6 x 6] are almost joined establishing cluster
07. The clusters #03, #09 and #25 of cluster [6 x 6],
also joined yielding cluster #08 of grid [3 x 3]. The
same occurs with clusters #04, #16 e #20 of grid [6
x 6], yielding cluster #04 of grid [3 x 3].
However there are still 2 clusters with only one
city. Figure 3 shows the U-matrix for a [3 x 3] grid.
Figure 4 depicts a comparison between residential and
rural consumption.
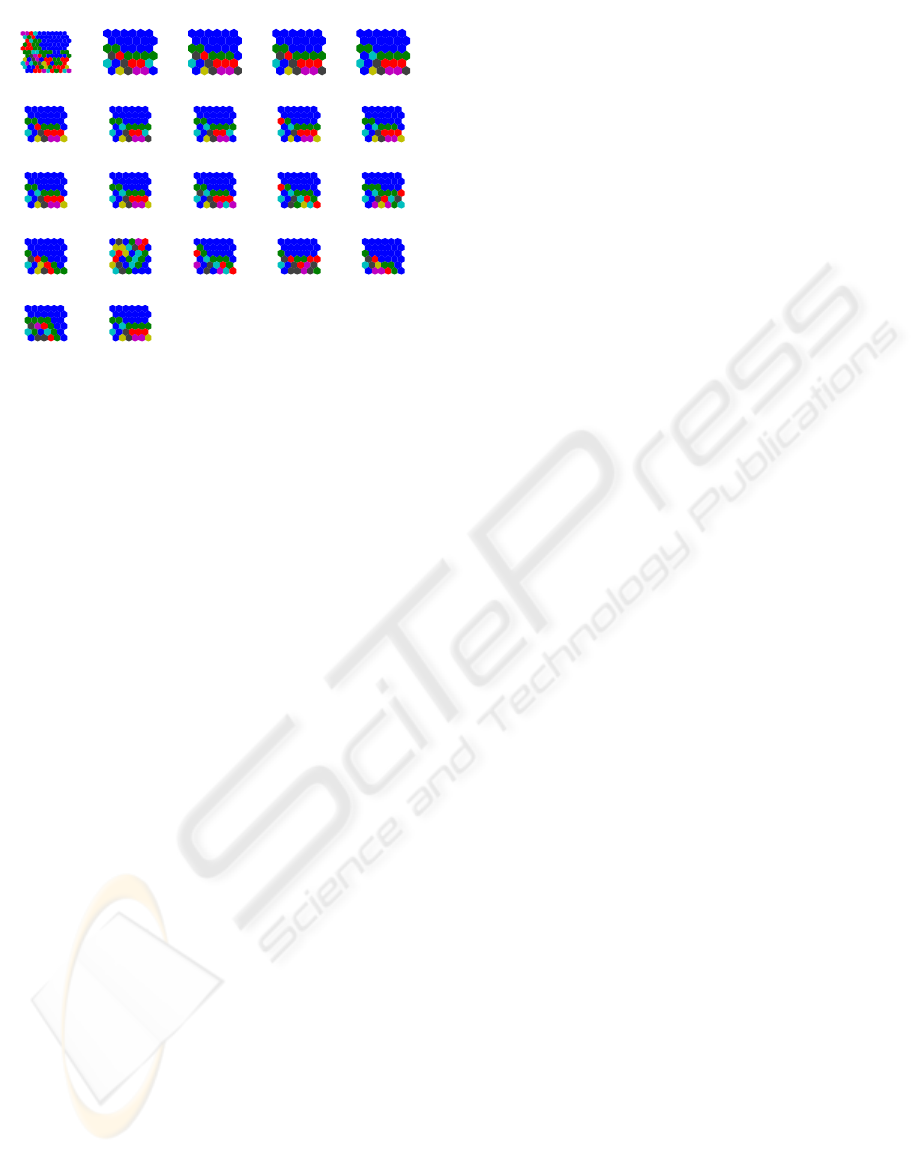
Finally Fig. 5 shows all variables involved in the
investigated case and allows an overview of the
clustering problem.
4 CONCLUSIONS
The Kohonen neural nets constitute a very efficient
method for clustering. The results were shown by
means of graphs which indicate easily the changes in
the groups occurring during the clustering formation.
Clustering is done within a large amount of data,
characterized by several variables in which many of
0.202
9.66
19.1
U-mat rix
Figure 2: U-Matrix for a [6X6] Grid.
0.181
1.72
3.25
U-matri x
Figure 3: U-Matrix for a [3X3] Grid.
44300
2.01e+006
3.98e+006
Resi denti al
d
619
7930
15200
Rural
Figure 4: Residential and Rural Consumption Compa-
rison.
SELF-ORGANIZING MAPS FOR CLASSIFICATION OF THE RIO DE JANEIRO STATE CITIES BASED ON
ELECTRICAL ENERGY CONSUMPTION
449
them show similarities. The results are presented in
2D maps.
The trouble in clustering the cities of Rio de
Janeiro (67) and Volta Redonda (91) was due to the
fact that both showed energy consumption above
average, making them different from the others. As a
matter of fact, Rio de Janeiro shows large energy
consumption in all variables except rural
consumption. Volta Redonda also shows this
characteristic in less volume but significantly in the
industrial energy consumption due to its steel
industry.
Although the results given by the Kohonen neural
nets showed a great deal of homogeneity in the
clustering formation, it is expected a classification
improvement if more variables are inserted such as
the city area, number of inhabitants and some
economical variable e. g. per capita income.
REFERENCES
Tanure, J.E,P.S., Carvalho, E.B., 2000. Regulation by
performance comparison for establishing goals for
continuity in energy dispensing. In National Workshop
on Electrical Energy Distribution, Foz de Iguaçu,
Brazil, 2000, in Portuguese.
Tou, J. T., 1974. Pattern recognition principles. Addison-
Wesley Publishing Company. Massachusetts, 2
nd
edition.
Anderberg, M.R. 1973. Cluster analysis for applications.
Academic Press.
Queiroz, H. L., Borba, C. M., 2001. Methodology for set
evaluation by means of quality technical indices. In
Electrical Energy Distribution Systems, Puerto
Iguaçu, Argentina, in Portuguese.
Sperandio, M., Coelho, J., Queiroz, H. L. , 2003.
Identification of clusters of energy consumption users
using self-organizing maps. In Proceedings of the V
SBQEE, Aracaju - Brazil, in Portuguese.
Ramos, A. J. P., 2000. Control and assessment of
electrical energy quality. In Technical Report 2 –
Monitoring and Instrumentation Protocol, in
Portuguese.
Kohonen, T., 2001. Self-organizing maps. 3rd ed.
Springer-Verlag, Berlin.
Haykin, S. , 2001. Neural networks: a comprehensive
foundation. Prentice Hall, 2nd ed., Upper Saddle
River: New Jersey.
Kohonen, T., Hynninen, J., Kangas J., Laaksonen J., 1996.
SOM_PAK: The self-organizing map program
package, Technical Report A31. In Technical Report
A31, Helsinki University of Technology, 1996,
available in http://www.cis.hut.fi/nnrc/nnrc-
programs.html.
Willshaw, W. D. J., Buneman, O. P., Longuet-Higgins, H.
C., 1969. Non-holographic associative memory. In
Nantre, London, voI.222, pp.960-962.
Willshaw, D. J., von der Malsburg ,C., 1976. How
patterned neural connections can be set up by self-
organization. In Proceedings of the Royal Society of
London Series B. voI.194, pp.431-445.
Dryden, I.. L. , Mardia, K.V., 1998. Statistical shape
analysis. John Wiley: Chichester.
Michie, D., Spiegelhalter D. J., Taylor, C. C., 1994.
Machine learning, neural and statistical classification.
Ellis Horwood, pp. 35-36.
Akkus, A., Guvernir H. A., 1996. K-Nearest neighbour
classification on feature projections. In Proceedings of
ICML’96 Lorenza Saitta (ed.). Proceedings of ICML
1996, Bari, Italy.
Mitra, P., Murthy, C.A., Pal , S.K., 2002. Unsupervised
feature election using feature similarity. In IEEE
Transactions on Pattern Analysis and Machine
Intelligence, vol. 24, no. 3.
Bishop, C. M., 1995. Neural networks for pattern
recognition. New York, Oxford University Press.
U-mat rix JAN FEB MAR APR
MAY JUN JUL AUG SEP
OCT NOV DEC RESIDENTIAL INDUSTRIAL
COMMERCIAL RURAL P. ILLUMINATION P. SERVICES P. POWER
S. CONSUMPTION TOTAL
Figure 5: Overview of the Clustering Problem.
ICEIS 2007 - International Conference on Enterprise Information Systems
450
