
USING FUZZY DATACUBES IN THE STUDY OF TRADING
STRATEGIES
M. Delgado Calvo-Flores, J. F. Nu
˜
nez Negrillo
Department of Computer Science and Artificial Intelligent, University of Granada
E. Gibaja Galindo
Department of Informatics and Numeric Analysis, University of Cordoba
C. Molina Fern
´
andez
1
Department of Computer Science, University of Jaen
Keywords:
Fuzzy OLAP, imprecision, exploratory analysis.
Abstract:
A fuzzy multidimensional model can be used for exploratory analysis, modelling complex concepts that are
very difficult to use in crisp ones. Some problems, as the edge problem, can be reduced using this approach.
To hide the complexity of the fuzzy logic in this situation is important. In this paper we present an application
of a fuzzy multidimensional model, that uses two layer representation to hide the complexity to the user, in
the study of trading strategies.
1 INTRODUCTION
OLAP systems are exploratory analysis tools that are
designed to work with a high amont of data in an ef-
ficiently way. Some statistical software include this
kind of tools (e.g. SPSS has an analysis functionality
based on a simple model of DataCubes).
Some concepts are not well modelled using crisp
models (e.g. near the average value, a young com-
pany, etc.). Fuzzy logic has been widely used to
model concepts in a more natural way to user. Us-
ing a fuzzy multidimensional model allows to apply
OLAP using fuzzy concepts and to get more intu-
itive results. Nowadays, the use of data from different
sources and the use of semi-structured (e.g. XML)
and non-structured (e.g. plain text) sources is normal.
Now the systems need to manage imprecision in the
data and more flexible structures to represent the anal-
ysis domains. The fuzzy logic can help us to model
this kind of imprecision. Some times we need to cat-
egorize continues values to reduce the complexity of
the analysis. If we do it by dividing the range using
crisp intervals the result can present the edge problem:
two values very near belong to different intervals. If
we relax the edge of the intervals we can reduce this
1
Corresponding author. Phone: +34 953 212 883.
problem. These relaxed intervals can be modelled if
we use a fuzzy multidimensional model.
In this paper we propose to use a fuzzy multidi-
mensional model to analyze data from the behavior of
trading strategies and avoid the problems mentioned.
The paper is organized as follow: next section is ded-
icated to present the main concepts of the fuzzy mul-
tidimensional model used and the OLAP system that
implements it; section 3 presents the DataCube built
and (Section 4) some examples of analysis over it.
The main conclusions are collected in last section.
2 FUZZY MULTIDIMENSIONAL
MODEL
In this section we briefly introduce the fuzzy multidi-
mensional model. A more detailed description can be
found in (Molina et al., 2006; Delgado et al., 2004).
Here we only present the main concepts needed to un-
derstand the model implemented.
2.1 Fuzzy Multidimensional Structure
Definition 1 A dimension is a tuple d = (l,≤
d
,l
⊥
,l
⊤
)
where l = l
i
,i = 1,...,n so that each l
i
is a set of values
164
Delgado Calvo-Flores M., F. Nuñez Negrillo J., Gibaja Galindo E. and Molina Fernández1 C. (2007).
USING FUZZY DATACUBES IN THE STUDY OF TRADING STRATEGIES.
In Proceedings of the Ninth International Conference on Enterprise Information Systems - DISI, pages 164-169
DOI: 10.5220/0002386001640169
Copyright
c
SciTePress

l
i
= {c
i1
,...,c
in
} and l
i
∩l
j
=
/
0 if i6= j, and ≤
d
is a
partial order relation between the elements of l so that
l
i
≤
d
l
k
if ∀c
ij
∈ l
i
⇒ ∃c
kp
∈ l
k
/c
ij
⊆ c
kp
. l
⊥
and l
⊤
are two elements of l so that ∀l
i
∈ l l
⊥
≤
d
l
i
≤
d
l
⊤
.
We denote level to each element l
i
. To identify
the level l of the dimension d we will use d.l. The
two special levels l
⊥
and l
⊤
will be called base level
and top level respectively. The partial order relation
in a dimension is what gives the hierarchical relation
between levels.
Definition 2 For each pair of levels l
i
and l
j
such that
l
j
∈ H
i
, we have the relation µ
ij
: l
i
× l
j
→ [0,1] and
we call this the kinship relation.
If we use only the values 0 and 1 and we only al-
low an element to be included with degree 1 by an
unique element of its parent levels, this relation rep-
resents a crisp hierarchy. If we relax these conditions
and we allow to use values in the interval [0,1] with-
out any other limitation, we have a fuzzy hierarchical
relation.
Definition 3 We say that any pair (h,α) is a fact
when h is an m-tuple on the attributes domain we want
to analyze, and α ∈ [0, 1].
The value α controls the influence of the fact in
the analysis. The imprecision of the data is managed
by assigning an α value representing this imprecision.
Now we can define the structure of a fuzzy DataCube.
Definition 4 A DataCube is a tuple C =
(D,l
b
,F,A,H) such that D = (d
1
,...,d
n
) is a set
of dimensions, l
b
= (l
1b
,...,l
nb
) is a set of levels
such that l
ib
belongs to d
i
, F = R ∪
/
0 where R is
the set of facts and
/
0 is a special symbol, H is an
object of type history, A is an application defined as
A : l
1b
× ... × l
nb
→ F, giving the relation between the
dimensions and the facts defined.
For a more detailed explication of the structure
and the operations over then, see (Molina et al., 2006;
Delgado et al., 2004).
2.2 User View
Over the structure presented, we defined a new layer.
Its main objective is to hide the complexity of the
model and provide the user with a more understand-
able result. Using fuzzy summary operators, we de-
fine the user view. As an example of this type of op-
erator, we can use the one proposed in (Blanco et al.,
2003). This operator proposes the use of the fuzzy
number that best fits, in the sense of fuzziness, the
fuzzy set or fuzzy bag. We can use more simple oper-
ators as the weighted average.
Figure 1: Graphical way to represent fuzzy numbers.
To give an intuitive way to interpret the results is
important, as shown by Codd et al. in the 11th OLAP
product evaluation rule ((Codd, 1993)). We propose
two methods to represent fuzzy numbers in a graphi-
cal way as an user view. Both approaches are shown
in Figure 1. In Figure 1.a the approach followed is
to use a color gradient to represent the membership
grade of the values: a clearer color means a low mem-
bership degree, and an intense color means a high
membership. The other approach (Figure 1.b) con-
sists on changing the width of a bar to represent the
membership: a low membership degree is represented
by a thicker bar than the one for a high degree.
2.3 F-Cube Factory System
In this section we comment the main characteristics of
F-Cube Factory, the system that implements the fuzzy
model proposed, in addition to others models, see
(Delgado et al., 2005) for more details. The system is
built using server/client architecture. The server im-
plements the main functionality over the DataCubes
(definition, management, queries, aggregation opera-
tors, user views operators, API for DataCube access,
etc.). The client we have developed is web based and
is thought to be light enough to be used in a personal
computer and to give an intuitive access to server
functionality (hiding the complexity of using a DML
or DDL to the user).
The DataCube defined in next section and the ex-
amples queries over it (Section 4) have been built us-
ing this system.
3 TRADING STRATEGIES
DATACUBE
In this section we present the structure of the Dat-
aCube built using the fuzzy multidimensional model
presented. The DataCube built is shown in Figure 2.
3.1 Dimensions
We have defined 13 dimensions. In all of them we
have used the minimum and maximum operator as
USING FUZZY DATACUBES IN THE STUDY OF TRADING STRATEGIES
165

t-norm and t-conorm when calculating the extended
kinship relation. In next sections we present the struc-
ture of each one.
Strategy: We consider 107 different strategies
and we classify them according to two characteristics:
Style, been the possible values day, base and anti;
and Frequency, according to if the strategy considers
a short or medium period in its normal application.
Profit: This annualized performance takes into
account commissions, slippages, and management
expenses. The values are in the interval [-50,70].
Over these values, we have defined three categories
considering if the value is bad, normal or good. There
is no standard to define the edge between the labels,
and most of the times experts use imprecise expres-
sions to define then. So, we have used fuzzy con-
cepts in the dimension to manage the relationships be-
tween the concrete values and the quality. The fuzzy
intervals are represented in Figure 3. Under these
circumstances, the structure of the dimension built
is Profit = ({Values, Quality,All},≤
Profit
,Values,All),
where ≤
Profit
is the relation that defines the hierarchi-
cal relations as follows: Values ≤
Profit
Values, Val-
ues ≤
Profit
Quality, Values ≤
Profit
All, Quality ≤
Profit
Quality, Quality ≤
Profit
All, All ≤
Profit
All.
Sharpe ratio: The sharpe ratio is a measure of
risk-adjusted performance of an investment asset, or
a trading strategy. This variable is used to character-
ize how well the return of an asset compensates the
investor for the risk taken. When two assets are com-
pared, the one with the highest sharpe ratio provides
a greater return for the same risk. Investors are often
advised to pick investments with high sharpe ratios.
This value is often used to rank the performance of
portfolio or mutual fund managers. On this variable,
the range of values is [-5,5].
We have defined three categories to classify ac-
cording to the quality as in the previous dimension.
We have considered three labels depending on the val-
ues can be considered bad, normal or good to select
the trading strategy. As in other dimensions, the mem-
bership of each value to a category is not well defined,
so we consider fuzzy intervals to build the kinship re-
lations of the values (Figure 7).
The structure of the dimension is analogous
to previous one: Sharpe Ratio = ({Values,
Quality,All},≤
SR
,Values,All).
Loss series (Drawdown): This is the greatest loss
sequence, or rather, the greatest drop between the
peak of accumulated profit and the lowest point. Mea-
surement begins when the fall starts and ends when a
new maximum is reached. The values of the examples
are in the range [0,100] and, as can be deduced from
the explanation, high values are the bad ones and the
low ones are translated into a good performance of the
strategy. The edges between good and normal, as well
as between bad and normal, are not defined in a crisp
manner. If we consider them as crisp ones, two values
very near con be considered as belonging to differ-
ent categories. The fuzzy intervals used are shown in
Figure 4. Drawdown dimension is defined as follows:
Drawdown = ({Values, Quality, All},≤
LS
,Values,All).
Potential: This is a measure of the performance
in relation to the maximum loss series, and the val-
ues belong to the interval [-2,6]. The structure of
the dimension is as follows: Potential = ({Values,
Quality,All},≤
Potencial
,Values,All), where the kinship
relations between the values of the level Values and
Quality are represented in Figure 8.
Consistency: In our particular case, this variable
refers to the number of negative results over time. It
presents values in [-4,4]. The values below 0 and near
to this value are not good because it means a large
number of negative results. Values near the upper
edge represent a good performance of the strategy.
To characterize this behavior we define three cate-
gories: the bad values, the good ones and an interval
between both than represents a normal situation. Fig-
ure 5 presents the imprecise intervals proposed. The
structure of the dimension is Consistency = ({Values,
Quality,All},≤
Consistency
,Values,All).
Reliability: This variable represents the percent-
age of winning trades considering all the trades. As it
is a percentage, the values are in the interval [0,100],
being the greatest ones the good performance for a
strategy. If the value is under the 50%, the strategy
performs badly. The values in the middle are consid-
ered as normal situation (Figure 9). The structure of
the dimension is analogous to previous ones.
E01 and E04: These variables are the one-year
and four-year stars following the Standard & Poors’
method. By dividing the strategy’s average relative
performance by the volatility of its relative perfor-
mance, we are measuring not only its ability to out-
perform its peer but also to do so in a consistent way;
the higher the ratio, the greater the strategy’s ability
to outperform its peers consistently. The number of
stars depends on the relative position of the strategy
according to the others considered. If a a strategy has
1 or 2 stars, it is considered a bad one; if it presents 4
or 5, it is considered a good one, and in the case of 3
stars, the strategy presents a normal behavior. In this
case, the kinship relations between the values and its
quality is crisp.
The structure of the dimensions are as follows:
E01 = ({Values, Quality,All},≤
E01
,Values,All), and
E04 = ({Values, Quality,All},≤
E04
,Values,All).
Risk: The risk combines the probability of a nega-
ICEIS 2007 - International Conference on Enterprise Information Systems
166
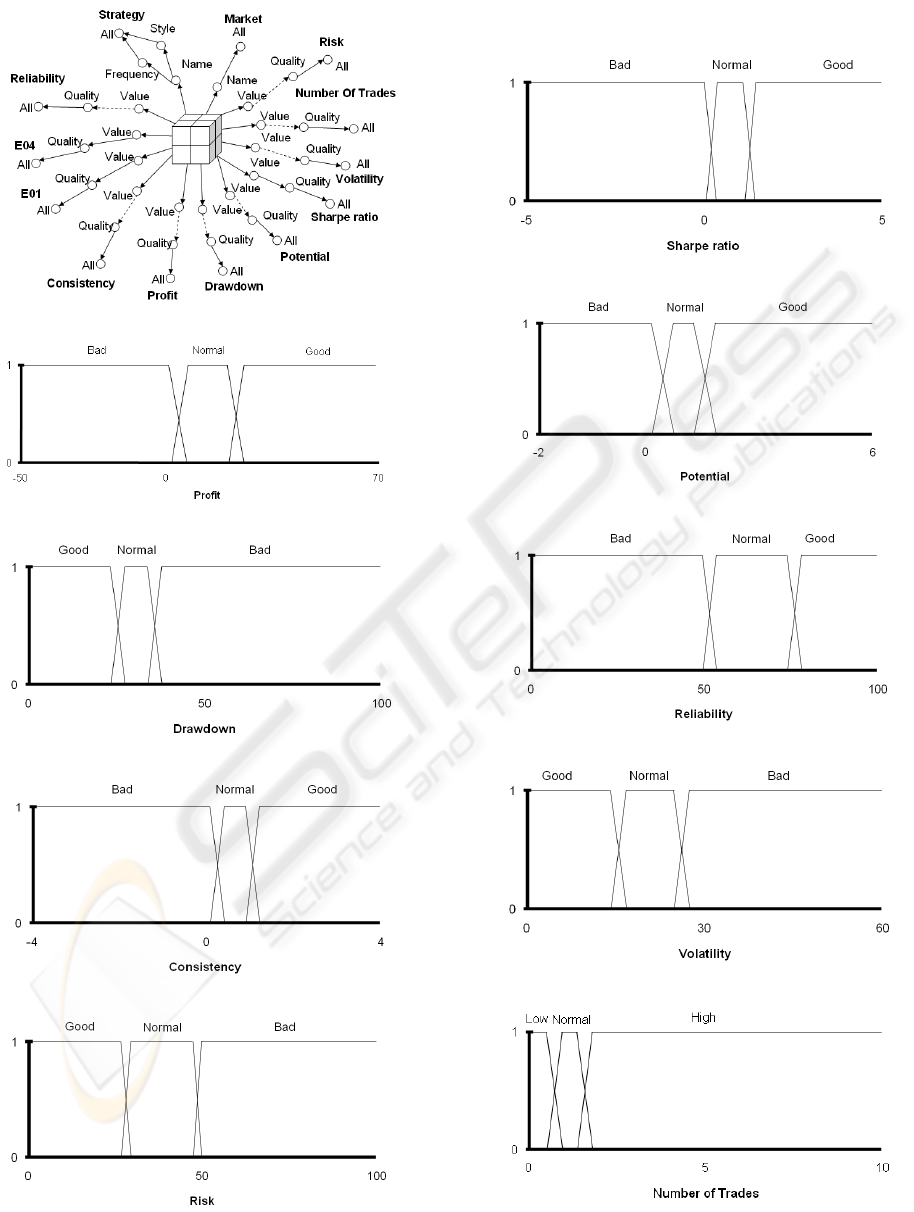
Figure 2: DataCube used in the analysis.
Figure 3: µ
Quality,Values
for Profit dimension.
Figure 4: µ
Quality,Values
for Drawdown dimension.
Figure 5: µ
Quality,Values
for Consistency dimension.
Figure 6: µ
Quality,Values
for Risk dimension.
Figure 7: µ
Quality,Values
for Sharpe ratio dimension.
Figure 8: µ
Quality,Values
for Potential dimension.
Figure 9: µ
Quality,Values
for Reliability dimension.
Figure 10: µ
Quality,Values
for Volatility dimension.
Figure 11: µ
Range,Values
for Number of trades dimension.
USING FUZZY DATACUBES IN THE STUDY OF TRADING STRATEGIES
167

tive event occurring with how much damage this event
would case. It is measured in the interval [0,100], and
the high values represents high risk. Figure 6 shows
the classification of the values in bad, normal or good
ones. The structure of the dimension is equal to the
previous ones presented.
Volatility: Volatility is the standard deviation of
the change in the value of a financial instrument with
a specific time horizon. It is frequently used to quan-
tify the risk of the instrument during this time period.
Volatility is expressed in annualised terms. The val-
ues are in the interval [0,60] and we have divided it
into three different categories according to the mean-
ing of the values: good, bad and normal values. Fig-
ure 10 shows the kinship relations between the Values
and the Quality.
The structure of the dimension
is as follows: Volatility = ({Values,
Quality,All},≤
Volatility
,Values,All).
Number of Trades (Activity): This variable
models the number of trades per day. The values are
in the range [0,10]. We divide the interval in three cat-
egories: low, normal or high. The two extremes are
bad behavior and the center can be considered as nor-
mal, so we have a hierarchy with three levels and one
fuzzy relation between the base level (Values) and the
Range level. In this later case, the kinship relations
are presented in Figure 11 and the structure of the di-
mension is as follows: NumberOfTrades = ({Values,
Range, Quality, All},≤
NoT
,Values,All).
Market: The strategies can be used on different
markets and may present different behavior depend-
ing on it. We have considered the strategies in the fol-
lowing markets: CAC-40, DAX-50, Euronext, Ibex-
35 Nasdaq, Russell, name as CAC, DAX, EUR, IBX,
NDQ, USA, and RUS. No hierarchy has been define
over the markets, only to consider all the values to-
gether: Market = ({Name, All},≤
Market
,Name,All).
3.2 Measures
On this DataCube we have only considered one mea-
sure: the number of times the same coordinates (same
value in all the base levels of the dimensions) appear
in the data set.
3.3 DataCube
Finally, the structure of the DataCube is C
Trading
=
({Strategy, Profit, Sharpe Ratio, Drawdown, Poten-
tial, Consistency, E01, E04, Risk, Volatility, Number
of trades, Market }, {Name, Values, Values, Values,
Values, Values, Values, Values, Values, Values, Val-
ues, Name, },Number
/
0,Ω,A), where A is the rela-
Figure 12: Profit according to the risk.
tion that associates each fact with the corresponding
values of the base level of the dimensions. The Dat-
aCube has been filled with 3109 facts. In next section
we present some example queries over the structure
and brief comments of the results.
4 QUERIES
In this section we present two queries solved over
the DataCube built to show the advantages of using
a fuzzy model.
Query 1: We first want to know if there is a rela-
tion between the profit and the risk. The graph shown
in Figure 12 represents in the coordinate axis the cat-
egories for the profit values and each one of the sub-
categories is the value for risk variable. The values
in Y axis are the number of times each combination
of values appears. According to the graph, it shows
a relationship between the values of both variables:
when the profit is good most of the times the risk is
good too; the same as normal and bad categories. As
we have defined the categories it means that for high
profits the risk is low, and when the profits are low
the risk is high, so there are an inverse relationship
between both variables.
Speaking about the imprecision, when the profit
has good values the imprecision appears in good and
normal values, but very low for bad category, being
the highest one for normal values of profit. This cir-
cumstance is due to values in the middle of both cat-
egories but nearer to the good one. In the case of
normal profit we have most of the values in the nor-
mal risk subcategory with a higher imprecision than
in the others. Under this circumstance, we can say
that the values are around a normal risk. If we con-
sider a crisp model the values would belong to one of
the categories and we can not know the distribution
of the values inside the categories, so we do not have
this information for the analysis.
Query 2: The second query is intended to know
ICEIS 2007 - International Conference on Enterprise Information Systems
168
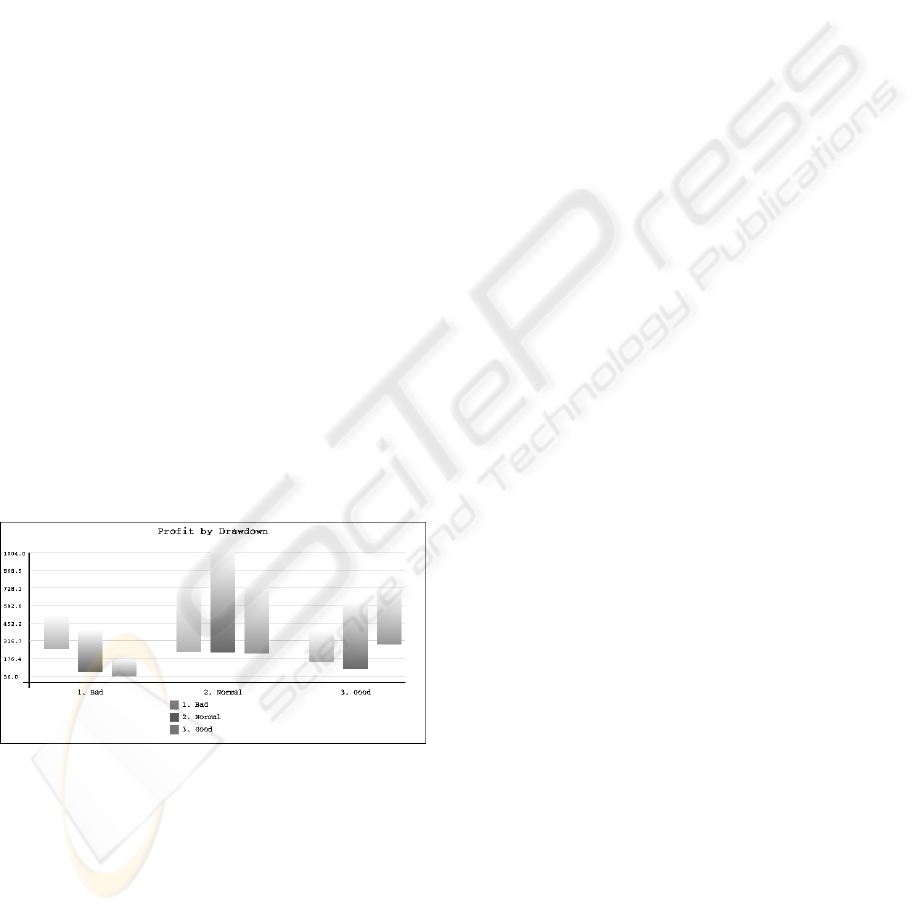
the relationship between the variables profit and
drawdown. Figure 13 shows a graphic representation
of the facts of the resulting DataCube. In the graph the
coordinate axis represents the categories for the vari-
able profit and each one of the subcategories shows
the number of times the strategies have this value ac-
cording to the quality in the variable drawdown. This
second query only present a significative relationship
between the variables when the profit is bad, due to
the higher the value of drawdown (bad values) the
higher is the number of the cases where the value of
profit is bad. When the profit belongs to category nor-
mal then all three categories in drawdown have values
very similar but with different imprecision. When the
profit is good it seems that values are distributed near
the extreme subcategories (bad and good).
When considering the imprecision, the more sig-
nificance cases are for normal and good categories
in profit. When the values belong to normal, all
three subcategories for drawdown have high impre-
cision. This circumstance shows that the values are
distributed in the three categories, having an impor-
tant number of cases with values between two cate-
gories. When the drawdown belongs to normal the
imprecision is higher due to it considers values that
are between this category and the other two, mean-
while the other, the imprecision is the result of the
values between the own category and normal). When
the profit is good the imprecision is centered in the
normal drawdown due to the values are distributed
mainly in the bad and good categories but with val-
ues near the normal one.
Figure 13: Profit according to the drawdown.
As a result of the analysis of this query we get that
drawdown does not provide good information about
the expected profit.
5 CONCLUSIONS
In this paper we have presented a fuzzy multidimen-
sional model as an exploratory analysis tool for study-
ing trading strategies. OLAP tools are suitable for
this kind of analysis and are able to work with a high
amont of data given an intuitive access for the user.
Using an OLAP system that implements a fuzzy mul-
tidimensional model allows to model some concepts
in a way closer to user perspective (e.g. values near
the average, etc.). In this situation to have an intuitive
way to show the results, that hides the complexity of
fuzzy logic, is very important.
We have model an economic problem using a
fuzzy multidimensional model that has enabled us to
use fuzzy concepts, to obtain analysis nearer to user,
and relax the edges of intervals, to reduce the edge
problem. Using the user views the model hides the
complexity of the model and gives graphic interpre-
tation for the queries. We have obtained coherent re-
sults for the queries and have shown that, in some situ-
ation, using fuzzy hierarchies is more informative for
the user, getting results that can not be obtained using
a crisp model, as the distribution of the values around
the edges of the categories.
REFERENCES
Blanco, I., S
´
anchez, D., Serrano, J. M., and Vila, M. A.
(2003). A new proposal of aggregation functions: The
linguistic summary. Lecture Notes in Computer Sci-
ence, 2715:127–134.
Codd, E. (1993). Providing OLAP (On-line Analytical Pro-
cessing) to user-analysts: An IT mandate. Technical
report, E.F. Codd and Associates.
Delgado, M., Molina, C., Rodr
´
ıguez-Ariza, L., S
´
anchez, D.,
J.M., and Vila, M. (2005). F-CubeFactory: A fuzzy
OLAP system for supporting imprecision. In IFSA
2005 World Congress: Fuzzy Logic, Soft Comput-
ing and Computational Intelligence, volume 1, pages
635–640, Beijing (China).
Delgado, M., Molina, C., S
´
anchez, D., Vila, M. A., and
Rodriguez-Ariza, L. (2004). A linguistic hierarchy for
datacube dimensiones modelling. In Current Ussues
in Data and Knowledge Engineering, pages 167–176,
Varsovia.
Molina, C., S
´
anchez, D., Vila, M. A., and Rodr
´
ıguez-Ariza,
L. (2006). A new fuzzy multidimensional model.
IEEE Transaction on Fuzzy Systems, 14(6):897–912.
USING FUZZY DATACUBES IN THE STUDY OF TRADING STRATEGIES
169
