
A NEW LIP-READING APPROCH FOR HUMAN COMPUTER
INTERACTION
Salah Werda, Walid Mahdi
MIRACL: Multimedia Information systems and Advanced Computing Laboratory
Higher Institute of Computer Science and Multimedia, Sfax, Tunisia
Abdelmajid Ben Hamadou
MIRACL: Multimedia Information systems and Advanced Computing Laboratory
Higher Institute of Computer Science and Multimedia, Sfax, Tunisia
Keywords: Human-Machine interaction, Visual information, Lip-reading system, Spatial-temporal tracking.
Abstract: Today, Human-Machine interaction represents a certain potential for autonomy especially of dependant
people. Automatic Lip-reading system is one of the different assistive technologies for hearing impaired or
elderly people. The need for an automatic lip-reading system is ever increasing. Extraction and reliable
analysis of facial movements make up an important part in many multimedia systems such as
videoconference, low communication systems, lip-reading systems. We can imagine, for example, a
dependent person ordering a machine with an easy lip movement or by a simple visemes (visual phoneme)
pronunciation. We present in this paper a new approach for lip localization and feature extraction in a
speaker’s face. The extracted visual information is then classified in order to recognize the uttered viseme.
We have developed our Automatic Lip Feature Extraction prototype (ALiFE). ALiFE prototype is evaluated
with a multiple speakers under natural conditions. Experiments include a group of French visemes by
different speakers. Results revealed that our system recognizes 92.50 % of French visemes.
1 INTRODUCTION
The disadvantages and the social exclusion faced by
dependant people are considerably increasing
because of their physical and cognitive situations,
the lack of supports, and of accessible environments.
Communication technologies have not always been
attentive to the needs of people who are deaf or
severely hard of hearing. A case in point is the
Human-Computer interaction based on automatic
speech recognition (ASR), which for almost a
century inadvertently excluded most of this
population from its use. Today, many works in the
literature, from the oldest (Petajan et al., 1988) and
(McGuruck et Mcdonald, 1976) until the most recent
ones (Daubias, 2002) and (Goecke, 2004) have
proved that movements of the mouth can be used as
one of the speech recognition channels. Recognizing
the content of speech based on observing the
speaker’s lip movements is called ‘lip-reading’. It
requires converting the mouth movements to a
reliable mathematical index for possible visual
recognition. It is around this thematic that our
ALiFE (Automatic Lip Feature Extraction)
prototype appears. ALiFE allows visemes
recognition from a video locution sequence, and
then these visemes can correspond to any machine
commands. More precisely, ALiFE prototype
implements our approach which is composed of
three steps: At first, it proceeds by localizing lips
and some Point Of Interest (POI). The second step
consists on tracking these POI throughout the speech
sequence and extracting of precise and pertinent
visual features from the speaker’s lip region. At the
end, the extracted features are used for visemes
(visual phoneme) classification and recognition. Our
ALiFE approach presented in this paper covers the
totality of the visual speech recognition steps shown
in figure1. In section (2) we present an overview on
labial segmentation methods proposed in the
literature. Section (3) details out our lip localization
and lip tracking methods. In section (4), we present
the different features which will be used for the
27
Werda S., Mahdi W. and Ben Hamadou A. (2007).
A NEW LIP-READING APPROCH FOR HUMAN COMPUTER INTERACTION.
In Proceedings of the Ninth International Conference on Enterprise Information Systems - HCI, pages 27-36
DOI: 10.5220/0002382800270036
Copyright
c
SciTePress
recognition. In section (5), we evaluate our ALiFE
prototype for the visual recognition of French
visemes. Rates of French visemes recognition as
well as a matrix of confusion between these visemes
will be shown.
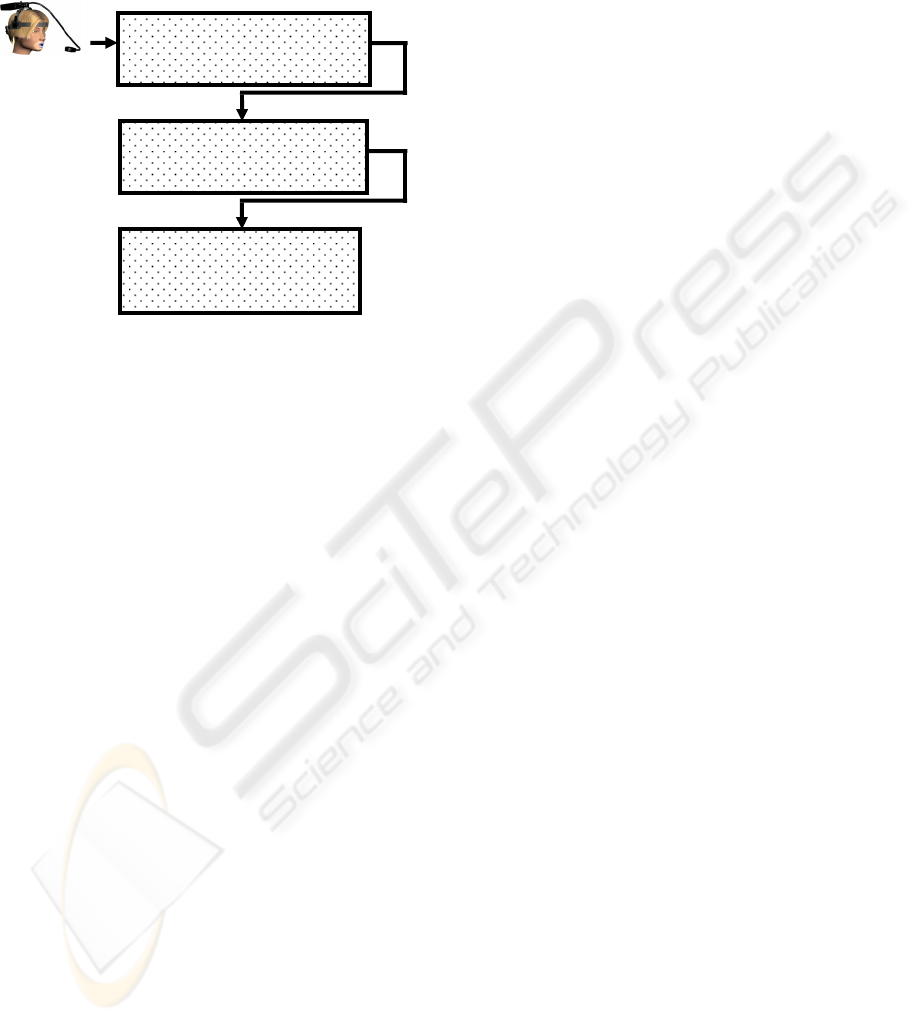
Figure 1: Overview of the complete ALiFE System for
visual speech recognition.
2 LABIAL SEGMENTATION
METHODS: AN OVERVIEW
Several research works stressed their objectives in
the research on automatic and semi-automatic
methods for the extraction of visual indices,
necessary to recognize visual speech (lip-reading)
(Petajan et al., 1988), (Meier et al., 1996) and
(Potamianos, 1998). Two types of approaches have
been used for lip-reading depending on the
descriptors they use for the recognition of the
viseme:
- The low-level approach (Image-based approaches)
(Matthews et al., 1996) and (Meier et al., 1996), use
directly the mouth region. This approach supposes
that the lip pixels have a different colour feature
compared to the ones of skin pixels. Theoretically,
the segmentation can therefore be done while
identifying and separating the lips and skin classes.
In practice, methods of this type allow rapid
locations of the interest zones and make some very
simple measures of it (width and height of the lips,
for example). However, they do not permit to carry
out a precise detection of the lip edges.
- The high level approach (Model-based approaches)
(Prasad et al., 1993), (Rao and Mersereau, 1995),
(Delmas, 2000) and (Daubias, 2002), which is
directed by physical distance extraction, uses a
model. For example, we can mention the active
contour, which were widely used in lip
segmentation. These approaches also exploit the
pixel information of the image, but they integrate
regularity constraints. The big deformability of these
techniques allows them to be easily adapted to a
variety of forms. This property is very interesting
when it is a matter of segmenting objects whose
form cannot be predicted in advance (sanguine
vessels, clouds...), but it appears more as a handicap
when the object structure is already known (mouth,
face, hand...). In the following sections, we will
present a new hybrid approach of lip feature
extraction. Our approach applies in the first stage the
active contour method to automatically localize the
lip feature points in the speaker’s face. In the second
stage, we propose a spatial-temporal tracking
method of these points based on the Freeman coding
directions and on voting techniques. This POI
tracking will carry out visual information describing
the lip movements among the locution video
sequence. Finally, this visual information will be
used to recognize the uttered viseme.
3 LIP POI LOCALIZATION AND
TRACKING
In this phase, we start with the localization of the
external contours of the lips on the first image of the
video sequence. Then, we identify on these contours
a set of POI that will be followed throughout the
video locution sequence. Thus, there are two
problems: (1) the lip and POI localization, and (2)
POI tracking in video sequence. The details of our
approach are presented in the following sections.
3.1 Lip and POI Localization
Our approach for lip POI localization is to proceed
first by detecting a lip contour and secondly by using
this contour to identify a set of POI. One of the most
efficient solutions to detect lip contour in the lip
region, is the active contour techniques, commonly
named “Snakes” (Eveno, 2003), and (Eveno, 2004).
This technique appeared in the mid 80’s under the
conjoined works of Kass, Witkin and Terzopoulos in
physical constraint model and picture treatment
(Delmas, 2000). This method meets a lot of
successes thanks to its capacity to mix the two
classic stages of detection of contours (extraction
and chaining). On the other hand, snake method
imposes a prior knowledge of the mouth position.
This constraint guarantees a good convergence of
the final result of the snake. Infact, we proceed in
the first step of our lip POI localization by detecting
the mouth corners. These corners will indicate the
Lip and POI Localization
and Tracking
Speech unit recognition
and Computer command
execution
POI Visual-features
Extraction
ICEIS 2007 - International Conference on Enterprise Information Systems
28
position of the snake initialization. The second step
will localize the external contours of the lips on the
first image of the video sequence. Finally we
identify on these contours the different POI which
we will follow throughout the video locution
sequence.
In the following sub-sections we detail in the
first step our mouth corners localization technique,
in order to assure a good initialization of the snake.
Secondly we specify the lip contour extraction
method based on active contour approach. Finally
POI will be localized on the final extracted contour.
3.1.1 Initialization Stage: Mouth Corners
Localization
Mouth is the part of the lips visible on the human
face. Various works have been made to extract facial
regions and facial organs using colour information
as clues especially for the localization of mouth
knowing that colour of lips is different to skin
colour. Among the colour systems used to localize
the mouth position we quote the HSV colour system
and the rg chromaticity diagram (Miyawaki et al.,
1989). These colour systems are relatively widely
used to separate the skin and the mouth map colour.
Yasuyuki Nakata and Moritoshi Ando in (Nakata et
al., 2004) represent the colour distribution for each
facial organ based on the relationship between RGB
values normalized for brightness values in order to
address changes in lighting. We have exploited this
idea in our mouth localization approach and we
apply a morphological operation to detect the
position of the mouth gravity centre. The details of
our approach are presented in the following sections.
As mentioned above, our approaches begin by
representing the image in (R
n
G
n
B
n
) color system,
defined by the following equation (1):
.
Y
B
*255B ,
Y
G
*255G ,
Y
R
*255R
nnn
===
(1)
With Y the intensity value.
After reducing the lighting effect by this color
system conversion we apply a binary threshold
based on the R
n
value, knowing that the R
n
is the
most dominant component in lip region. The results
of binarization are showing in figure (3a). After the
binarization step, we apply on the image an oilify
filter. This filter makes the image look like an oil
painting and it works by replacing the pixel at (x,y)
with the value that occurs most often in its region.
This region is named structuring element (SE).
Precisely, we proceed in this step by eliminating the
false positive skin pixels which have a dominant R
n
value. Thus, we use in this phase a diamond-shaped
(SE) (Figure 2). The aims goal is to maintain on the
final result, only lip pixels. The width (w) and the
height (h) of the SE are set according to the focal
camera distance. In our experiments, we have fixed
these measures (w) and (h) respectively to 30 and 10
pixels.
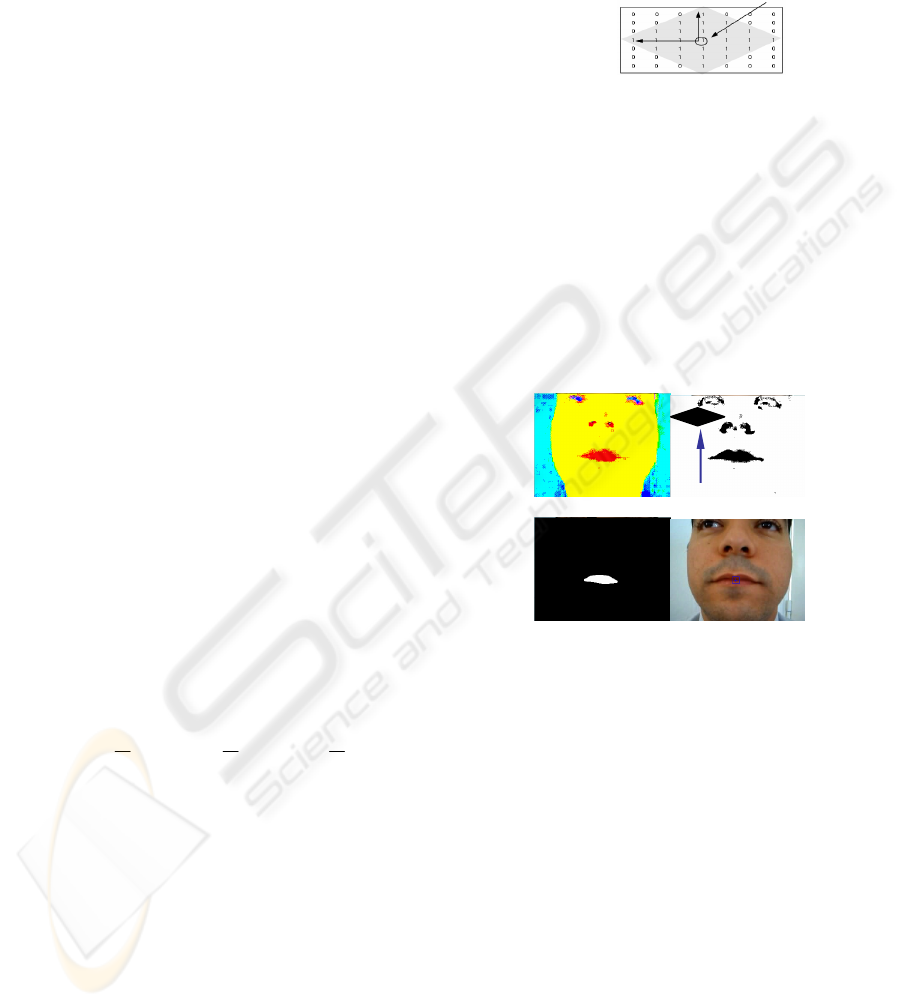
Figure 2: diamond-shaped structuring element (SE).
Finally, we calculate the gravity center of the lip
pixels; it represents the mouth center (Figure 3). We
remark on this first mouth localisation step that the
final result is very sensitive to the noise which can
be caused by the red component dominance in some
skin pixels other than lip pixels. Thus, the centre of
the mouth which has been detected is not rather
precise, so, it will be considered in this second step
of our mouth corner localization process as the
effective centre of the Mouth Region (MR) and not
as the centre of the mouth (Figure 4).
(a) (b)
(c) (d)
Figure 3: First step mouth localization : (a) original image
after the conversion in R
n
G
n
B
n
system (b) after the
binarization step (c) Image after the oilify filter.
Knowing that the corners and the interior of
mouth constitute the darkest zone in MR, we use in
this step the saturation component from the original
image in order to localize the mouth corners.
Precisely, we proceed by the projection of the pixel
saturation values from the MR on the vertical axis.
This projection allows the detection of the darkest
axis (D
K
A
x
) in the mouth region (Figure 4).
In figure 5a we remark that the mouth corners
are not on the detected D
K
A
x
, it is very normal
according to the physiognomy of lips. So, we
proceed by scanning different pixels along the D
K
A
x
to localize local maxima saturation values. Extremas
of these detected local maxima pixels will be
defined as the left and the right corners of the mouth.
Figure 5 shows results of our corners localization
method. Finally, the detected corners will be the
SE
Ori
g
in
SE:
w
h
A NEW LIP-READING APPROACH FOR HUMAN COMPUTER INTERACTION
29
basis of the snake initialization (Figure 5c). The
definition of our active contour process will be
detailed in the next section.
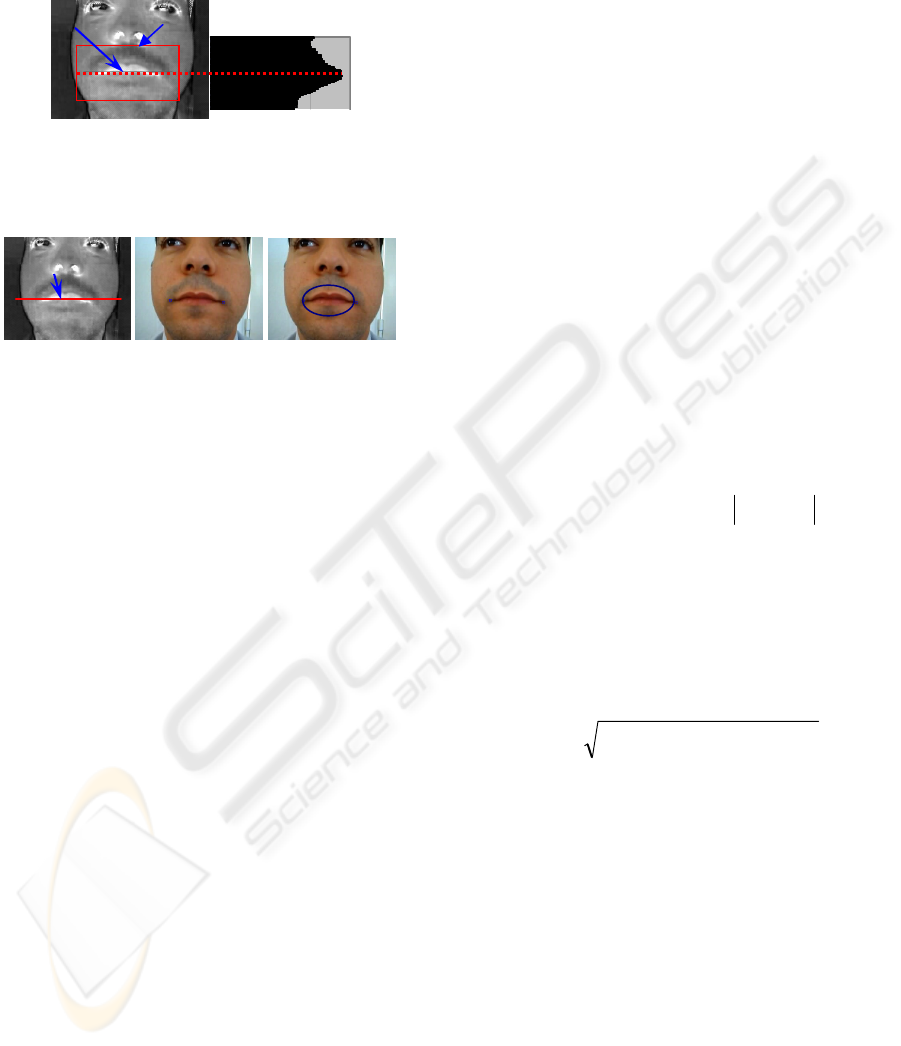
Figure 4: Second step mouth corners localization:
projection of the saturation values in the mouth region
(MR) and the localization of the Darkest Axis D
K
A
x
.
(a) (b)
(c)
Figure 5: (a) Scanning different pixels behind the axis (b)
projection of local maxima and detection of the right and
the left corner (c) initialization of the snake.
3.1.2 POI Localization based on the Active
Contour Method
The active contours (or snakes) are deformable
curves evolving in order to minimize functional
energy, which are associated to them (Delmas,
2000). They move within the image of an initial
position toward a final configuration that depends on
the influence of the various terms of energy. The
snake’s energy consists of an internal energy named
regularization or smoothing energy and an external
energy of data adequacy. The snake detection or
active contour based method consists of placing
around a detected shape an initial line of contour.
This line deforms itself progressively according to
the action of several strengths that push it toward the
shape. The implied strengths are derived from the
three following energies associated to the snake:
• An exclusive energy imposed by the shape, called
internal energy: E
int
.
• A potential energy imposed by the image: E
ext
. It
is this energy that attracts the snake line toward the
real contours present in the image.
• An E
cont
energy that expresses some
supplementary constraints that can be imposed by
the user.
The initialization of our snake is based on the mouth
corners detected in section (3.1.1). Figure 5 shows
the initialization of the active contour by an ellipse.
The core of our contribution is that active contour
technique is applied just on the first frame of the
video sequence and the addition of the E
cont
based
on the snake evolution direction. In what follows,
we present how we will adapt these terms of
energies to our problem.
The three above energies can be defined as
follows. We consider that our snake is composed of
(n) Vi points with (i≤n), and that “s” is the parameter
of spatial evolution in the contours image, for
example the curvilinear abscissa.
• The internal Energy: E
int
is going to depend only
on the shape of the snake. It is a regularity
constraint curve. We calculate it according to
Equation 2.
(2)
Where a and b are respectively the weights of the
first and second derivative V '' and V'.
We will adjust a and b to find a flexible contour
(that will be able to wedge on the corners and the
sharp angles: the corners and the Cupidon-bow) and
a very regular contour that will follow the contour
without clinging to a “false alarm”.
• A potential energy imposed by the image: E
ext
attracts the snake line toward the real contours
present in the image. This energy is based on the
gradient of the image (Equation 3).
2
ext
)y,x(IE ∇−= (3)
• The constraint energy: E
cont
is often defined by the
user, according to the specificities of the problem.
One of the cores of our contribution is the
definition of E
cont
. For us, E
cont
aims at pushing the
evolution of the snake toward the gravity centre G
(x
g
,y
g
) of the active contour. It represents the
Euclidian distance between G and V
i
computed as
follows:
))y-(y)x-((x E
2
gs
2
gscont
+=
(4)
With (x
s
,y
s
) and (x
g
,y
g
) the respective Cartesian
coordinates of snake’s points (s) and gravity
center of
the snake (G).
The principal goal of this energy is to ensure the
evolution of the snake in the image zones having
weak gradient values. We calculate the total
energy
in one point V
i
of snake (Ei
tot
). Therefore the total
energy of the snake E
tot
can be computed by the
following equation:
In our implementation our snake is composed of
two ellipse halves. So we define for the snake
D
K
A
|)(s)'V'|(b(s)* |(s)V'|(a(s)* E
int
+
=
(5)
)
i
(V
cont
E
)
i
(V
ext
E )
1i
V ,
i
V ,
1-i
(V
int
E
n1i
)
tot
(Ei
n 1i
)
1i
V ,
i
V ,
1-i
(V
to
t
E
∗
+∗
+
+
∗
∑
→=
=
∑
→ =
=
+
λ
β
α
D
K
A
x
MR
ICEIS 2007 - International Conference on Enterprise Information Systems
30
progression two E
tot
, one for the upper and one for
the lower part of the snake. The main idea of this
constraint is to allow a more reasonable weights
affectation to different terms of energy. For
example, knowing that the upper lip has a strong
gradient value, and it isn’t the case for the lower lip,
the weight (λ =λ
1
) of the E
cont
with the lower part of
the snake will be higher compared to that (λ=λ
2
) of
the upper part of the snake. This constraint
guarantees a good convergence of the final snake,
especially in regions having weak gradient values.
After the definition of active contour energies,
the snake is going to evolve progressively in order to
minimize its total energy E
tot
. In order to maintain
the initial form of our snake we interpolate the snake
points (in every iteration) to two ellipse halves, one
for the upper lip and one for the lower lip. The snake
progression will be stopped, when E
tot
reaches its
minimal value or until attending a fixed number of
iterations. For our experimentation, we have used
the first method (Figure 6). Once the external
contours of the lips are extracted, we proceed to the
detection and the initialization of the different POI.
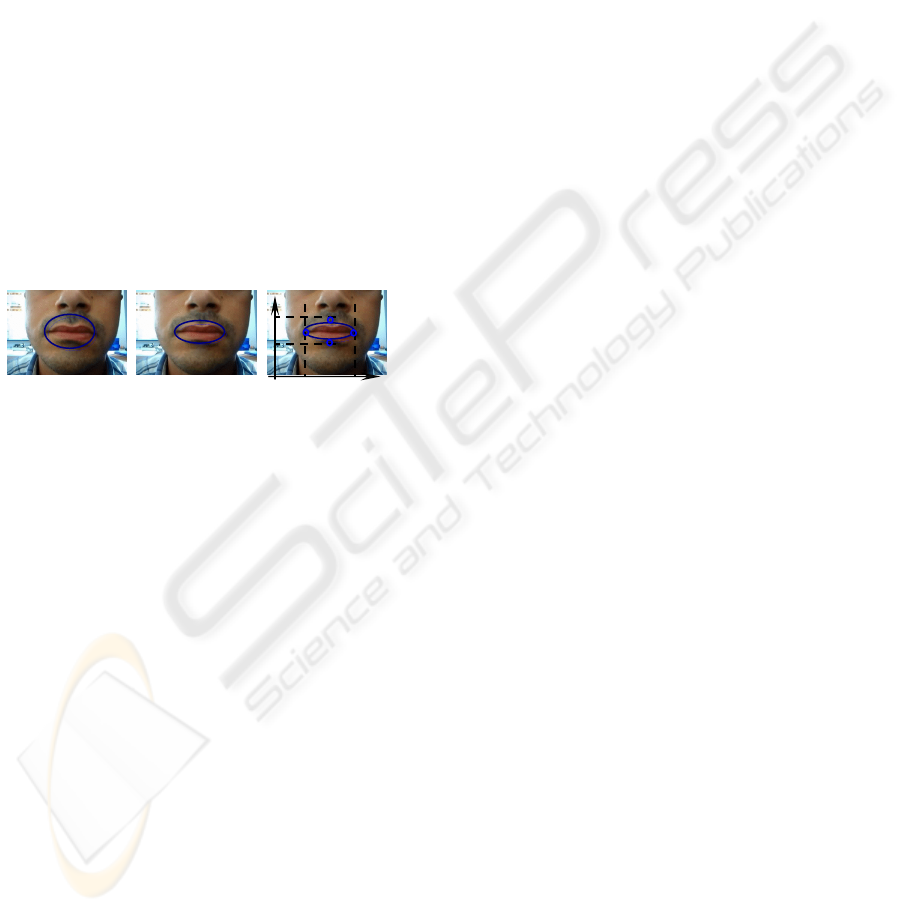
Figure 6: (a),(b) Snake evolution according to the energy
minimisation principle (The snake progression will be
stopped when the E
tot
reaches the minimum value) , and
(c) the projection of the final contour on horizontal and
vertical axis (H and V).
Here we intend to employ a technique of
projection (horizontal and vertical) of the various
points of the snake, to detect different POI. More
precisely, the maximum projection on the horizontal
axis indicates the position of two corners of the lips
and the maximum’s projection on the vertical axis
indicates the position of the lower lip and the
Cupidon bow. Figure 6c show this localization
process.
3.2 Lip Tracking
The problem of POI tracking (in our context each
POI is defined by a block of size w*w pixels) is to
detect these POI on the successive images of the
video sequence. This problem is to look for the
block (j) on the image (i) which has the maximum of
similarity with the block (j) detected on the image (i-
1) knowing that i is the number of image in the
video sequence and j is the number of block which
defines the different POI. Several algorithms and
measurements of similarity were presented in the
literature to deal with the problem of pattern
tracking. However, we notice that there are some
difficulties to adapt these algorithms to our problems
for the reason that the movements of the lips are
very complex (Werda et al., 2005). Our approach of
POI tracking is an alternative of the Template
Matching technique exploiting the spatial-temporal
indices of the video. The principle of this approach
consists in seeking in a gray level image I
i
(x, y) the
most similar block to the block pattern forming a
point of interest (POI) defined in section 3.2. Our
algorithm of tracking is based on two principle
steps: in the first step POI tracking is done in the
different directions of the Freeman coding to
localize the candidate points describing the potential
POI movements. In the second steps a vote
technique will be used to identify among all the
candidate points, the one that corresponds better to
the origin POI. The details of our spatial-temporal
voting approach of POI tracking are presented in
(Werda et al., 2005).
4 LIP FEATURE EXTRACTION
AND CLASSIFICATION
In this section we present the different visual
descriptors which we use for the characterization of
the labial movements. These visual descriptors will
be the entries and the only information on which the
recognition phase will depend. As a result the choice
of the syllabic descriptors must be relevant and must
accurately describe the movement of French viseme.
4.1 Lip Features Extraction
In this section we describe our hybrid features. We
can classify these descriptors in two categories: the
low-level feature using directly the image of the
mouth region and high level feature which is
directed by physical distance extraction. The
extraction of these descriptors will be based on the
tracking of the four points already presented in
section 3.
4.1.2 High Level Features
In this section we detail the intelligibility of the
different high level features.
- Vertical Distance (Upper lip / lower lip: DV’):
The variation of the vertical distance from the upper
and lower lip gives a clear idea on the opening
degree of the mouth during the syllabic sequence.
This measure is very significant for the recognition
of the syllables containing the vowels which open
the mouth for example /ba/.
(a) (b) (c)
A NEW LIP-READING APPROACH FOR HUMAN COMPUTER INTERACTION
31
n
yxI
S
n
i
ii
∑
=
×=
1
dark
),(
α
- Vertical Distance (Corner axis / lower lip: DV’’):
The variation of the second vertical distance
between the lower lip and the horizontal axis
(formed by the left and right corners of the lip), is a
very important parameter especially for the
recognition of labial-dental visemes. Precisely, one
of the labial-dental visemes characteristic is that the
lower lip is in contact with the incisive tooth (like
/fa/) so this feature (DV’’) perfectly describe the
position of the lower lip.
- Horizontal Distance (DH): The variation of the
Horizontal distance between the right and the left lip
corners describes the stretching intensity of the lips
during the locution sequence. This measure is very
significant for the recognition of the visemes
containing vowels which stretch the mouth for
example /bi/.
- Opening Degree (OD): In addition to the variation
of the vertical and horizontal distances that give a
clear idea on the opening level of the mouth during
the syllabic sequence we calculate the angle (γ). This
measure (γ) characterizes the (OD) of the mouth
according to the position of the lower and the upper
lip and the right or the left corners. This variation is
very high with vowels which open the mouth.
4.1.2 Low Level Features
The extraction of the low level parameters makes it
possible to take into account many characteristics
such as the appearance of the tooth or a particular
mouth area. These extractions are not robust to the
luminance variation because it is based directly on
the gray levels. In fact to resolve this problem we
apply in the feature extraction stage adaptive
thresholds, the detail of both features (Dark Area
and Teeth Area) will be given in the following
sections.
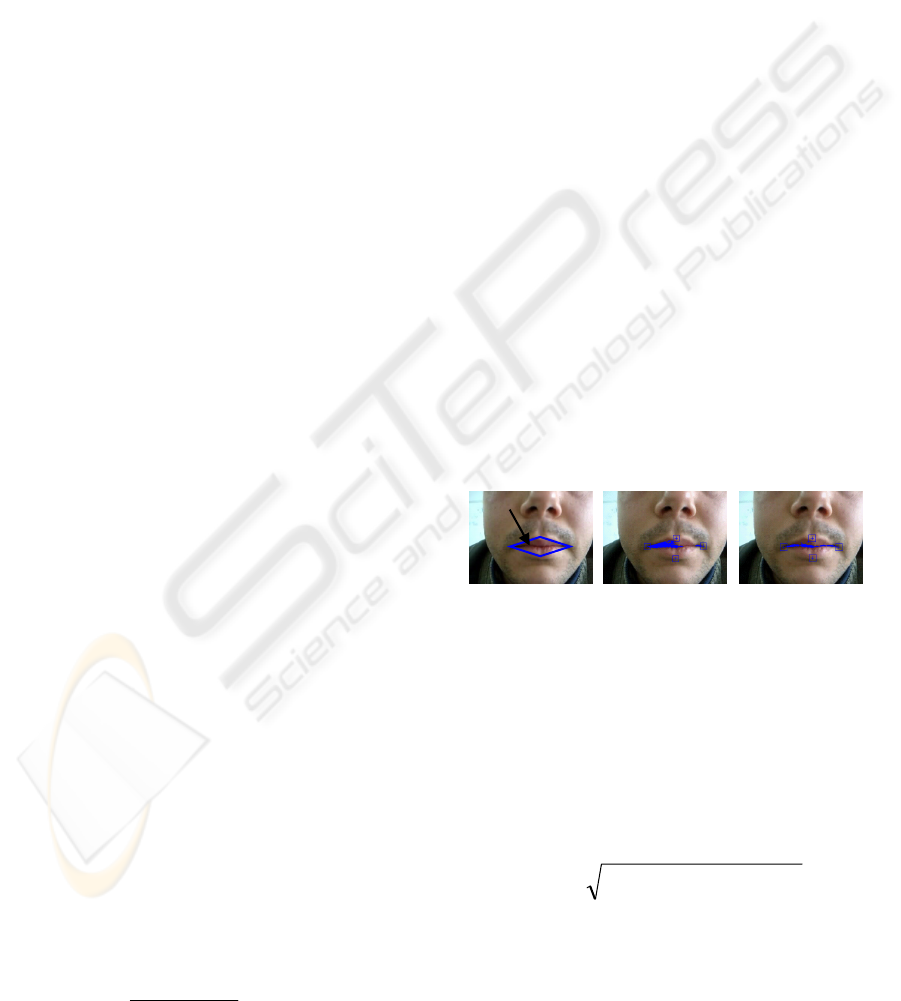
- Dark Area (DA): In spite of its irregular
appearance, the dark surface is a relevant descriptor
of the labial movement’s characterization. To extract
the dark pixels which are inside the mouth, we will
try to find these pixels in the region of interest (ROI)
described by a polygonal form (Figure 7a). This
region is formed by the four POI defined in section
3. The main problem is to separate between the dark
and non-dark pixels. Here is a question of finding a
method which can operate at various conditions of
elocution sequence acquisition, different
configurations and colours of the vermilion (which
is not regular for all speakers). With this intention
we propose an extraction of dark areas method with
an adaptive threshold.
(6)
With n the number of pixel within the ROI.
The threshold (S
dark
) will be calculated according to
the equation 6. α is a threshold fixed at 0.3 according
to experimental results' that we carried out on our
audio visual corpus.
The discrimination between the dark and non-dark
pixels is done according to the following equation:
(7)
In the application of this dark area detection we
remark that we have some false DA detection
(Figure 7b). Generally, knowing the physiognomy of
the head we think that it is very natural that this
problem occurs when we have no-frontal lighting.
This light condition will generate an important
shadow effect in some regions within the ROI. This
shadow will affect the efficiency of our adaptive
threshold (S
dark
), since the (S
dark
) is calculated on the
whole ROI. To resolve this problem, we apply a
spatial adaptive threshold (SAT
dark
). Precisely, the
idea consists to dividing the ROI to a three sub-
regions. The detection of dark pixels is made in such
a way that we calculate for every sub-region an
(SAT
dark
). This improvement largely reduces the
shadow effect in the image. The result of our dark
area detection approach is shown in figure 7.
Finally, we will obtain, for each image of the
locution sequence, the number of dark pixels inside
the ROI (Figure 7c).
(a) (b) (c)
Figure 7: Result of the dark area detection with (SAT
dark
)
improvement. (a) Original image, (b) Dark area detection
with (S
dark
), (c) Dark area detection with (SAT
dark
).
Infact, the number of dark pixels is not so
discriminating between the various configurations of
each visemes. The spatial position of these pixels
inside the ROI is more interesting and more relevant.
To develop this criterion (spatial position) we
proceed by a weighing of the dark pixels on their
position compared to the ROI midpoint.
(8)
With Xc and Yc Cartesian coordinates of the ROI gravity
centre.
The values of the dark area feature (V [DA]) will be
calculated according to the equation 8. With such
()()
2
c
2
c
Y-YX-X[DA] V +=
⎪
⎩
⎪
⎨
⎧
−
≤
pixeldarknon
else
pixeldarkSyxI
dark
),(if
ROI
ICEIS 2007 - International Conference on Enterprise Information Systems
32
approach, we exploit the density of the spatial
position of the dark pixels inside the ROI.
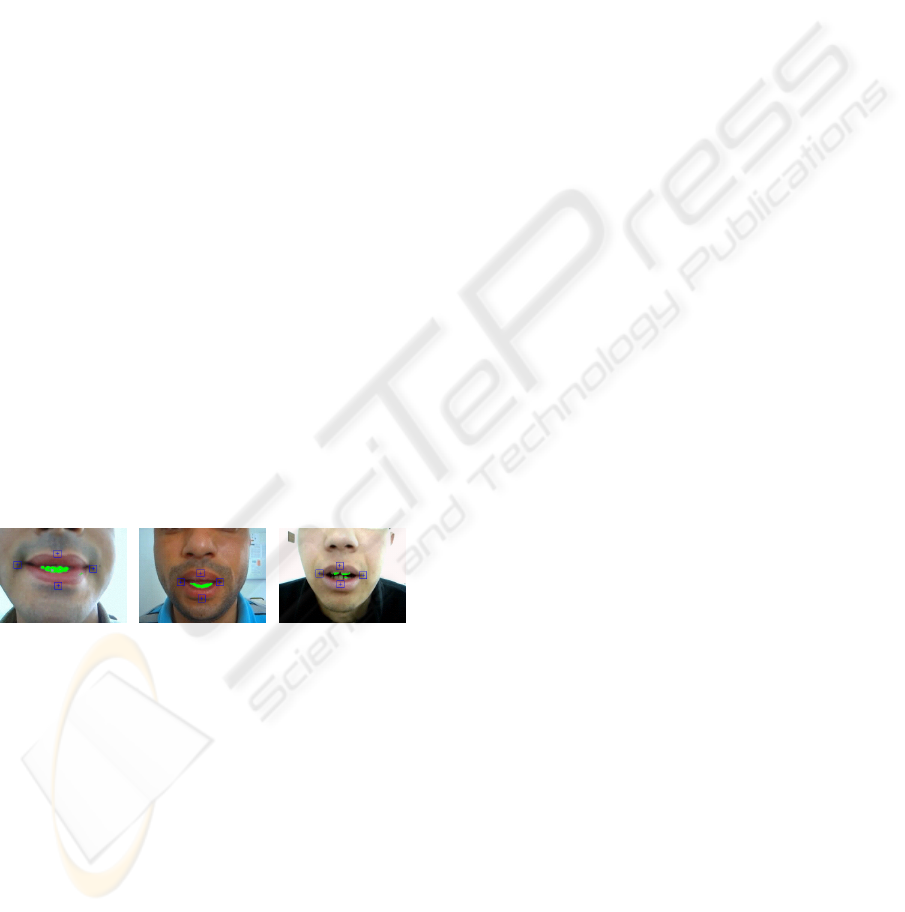
- Teeth Area (TA): The descriptor “Teeth Area”
characterizes the visibility of tooth during the
locution sequence. For example, the inter-dental
phonemes /T/ and /D/ can be satisfactorily produced
by either protruding the tongue through the teeth, or
placing the tongue behind the teeth of the upper jaw.
This descriptor is also very essential mainly in the
case of no round vowels (/i/, /e/, /ε/) where the lip
corner forms more stretched lips, making the
visibility scale of teeth very important. In this
section we present our method of tooth area
extraction. The main problem is to detect tooth
pixels present in the (ROI). However, teeth can be
distinguished from other parts of the face by their
characteristic low saturation. Saturation measures
the white quantity in a colour. Then, the more the
saturation is low (near to 0) the more the colour is
white or pastel. On the other hand higher saturation
values (near to 1) indicate that the colour is pure.
Therefore, Zhang in (Zhang et al., 2002) detects
teeth by forming a bounding box around the inner
mouth area and testing pixels for white tooth color:
S<S
0
, where S
0
is fixed to 0.35, and S is between 0
and 1. However, the visibility of the teeth was
detected by a color search within the ROI. In our
teeth area extraction process, we exploit in addition
to Zhang method, the intensity of pixel. Precisely,
we detect teeth by finding pixels which have both
high intensity values (I(x,y) > Average of intensity
within the inner lip contour area) and low saturation
values. Figure 8 shows the result of teeth detection
with various speakers under natural lighting conditions.
Figure 8: Result of the teeth area detection with various
speakers under different lighting conditions.
4.2 Lip Features Classification and
French Visemes Recognition
The robustness of speech recognition system largely
depends on the relevance of the descriptors and the
training stage. In addition, a great number of data is
necessary to ensure an effective training of the
system. The experiments which we carry out on test
data, different from the training data, make it
possible to characterize the performances of the
ALiFE system. That is why the development of
recognition systems imposes the use of a
considerable size of data. In the literature, the audio-
visual or visual corpuses available for speech
recognition are much weaker (Goecke, 2004).
Indeed, the constitution of such corpus posed
material and storage problems. Concerning our
problematic, the viseme recognition, using an
existing corpus becomes increasingly difficult
because, on the one hand we focus on strictly visual
data and on the other hand the nature of the speech
unit to recognize. Thus we were obliged to build our
own audio-visual corpus. ALiFE prototype is
evaluated with multiple speakers under natural
conditions. We have created a specific audio-visual
(AV) corpus constituted by different French
visemes. Our AV corpus is composed of speakers, of
various ages and sexes. The capture is done with one
CCD camera; the resolution is 0.35 Mega of pixels
and with 25 frames/s (fps). This cadence is wide
enough to capture the major important lip
movement.
4.2.1 Training Stage
Our recognition system ALiFE, is based on the k-
Nearest Neighbours (K-NN) analysis. For many
years, the K-NN method has been known as one of
the best probability density function (pdf) estimator
(Karayiannis and Randolph-Gips, 2003). This
method is an approximation to the optimal Bayes
classifier. The k-nearest neighbour algorithm is an
example of a class of learning techniques called
instance-based methods. As its name implies, the k-
nearest neighbour algorithm searches the training
examples to find those that are “closest” to a new
example to be analyzed. It then uses these to
determine the appropriate output for the new
instance (Bishop, 1995).
In k-nearest-neighbours, the learning step is
trivial: we simply store the dataset in the system’s
memory. For example, if we take the viseme class
/ba/, we must create six Features (described at
section 4.1) Vectors (FV) for different sample of this
viseme class. On the other hand, we note that the
viseme sequence duration is not necessarily unvaried
for all speakers. Moreover, speaker does not have
the same mouth size. So, we apply on the Viseme
Feature vectors (FV) extracted from the tracking
stage a spatial-temporal normalization (Werda et al.,
2006). This process provides a normalized FV
i
and
assures an efficient stored data. The result is a
matrix X, it contains a set of (n) data
records
{
}
nj
xxxx ,...,,,
21
r
.
j
x
r
, is composed from
the different FV
i
vector. The matrix X will be the
basis of the recognition stage.
4.2.2 Recognition Stage
As mentioned before, given a query point, K-NN
makes predictions based on the outcome of the k
A NEW LIP-READING APPROACH FOR HUMAN COMPUTER INTERACTION
33
neighbors closest to that point. Therefore, to make
predictions with K-NN, we need to define a metric
for measuring the distance between the query point
(
y
r
) and cases from the examples sample. One of the
most popular choices to measure this distance is
known as Euclidean (Equation 9).
(9)
(d) is the distance between the query point (
y
r
) and
one sample (
j
x
r
) of memorized dataset (one column
of matrix X). This distance is assigned between all
examples in a dataset. Then, a distance matrix (D) is
constructed between all possible pairings of points
(
j
x
r
, y). Each data point within the data set has a
class label in the set, C= {c
1
... c
m
} with (m) the
number of viseme class. The data points', k-closest
neighbours (k being the number of neighbours) are
then found by analyzing the distance matrix (D). The
k-closest data points are then analyzed to determine
which class label is the most common among the set.
The most common class label is then assigned to the
data point being analyzed. Since K-NN predictions
are based on the intuitive assumption that objects
close in distance are potentially similar, it makes
good sense to discriminate between the k nearest
neighbours when making predictions, i.e., let the
closest points among the k nearest neighbours have
more say in affecting the outcome of the query
point. This can be achieved by introducing a set of
weights (W
ki
), one for each nearest neighbour (i ∈
[1...k]), defined by the relative closeness of each
neighbour with respect to the query point. (W
ki
) is
calculated according to the equation 10:
(10)
The choice of k is essential in building the K-NN
model. In fact, k can be regarded as one of the most
important factors of the model that can strongly
influence the quality of predictions. One appropriate
way to look at the number of nearest neighbour’s k
is to think of it as a smoothing parameter. For any
given problem, a small value of k will lead to a large
variance in predictions. Alternatively, setting k to a
large value may lead to a large model bias. Thus, k
should be set to a value large enough to minimize
the probability of misclassification and small enough
(with respect to the number of cases in the example
sample) so that the k nearest points are close enough
to the query point. K-NN can provide an estimate of
k using an algorithm known as cross-validation
(Bishop, 1995).
The general idea of this method is to divide the data
sample into a number of v folds (disjointed sub-
samples). For a fixed value of k, we apply the K-NN
model to make predictions on the vth segment (i.e.,
use the v-1 segments as the examples) and evaluate
the accuracy (the percentage of correctly classified
cases). The above steps are then repeated for various
k and the value achieving the highest classification
accuracy is then selected as the optimal value for k.
However, the K-nearest neighbour classifier,
relying on a distance function (d), is sensitive to
noise and irrelevant features (different features
composing the different
j
x
r
vectors), because such
features have the same influence on the
classification as do good and highly predictive
features. A solution to this is to pre-process the data
to weight features so that irrelevant and
unpredictable features have a lower weight. Then we
introduce an intra-class weight (
fj
w
), one for each
feature (f) with each viseme class. To determine
these weights (
fj
w
), we calculate for every feature
(f) its standard deviation (σ
fj
) in the viseme class (j).
(σ
fj
) measures the variability of the feature data in a
viseme class. So, all the more as the standard
deviation value (σ
fj
) is greater, the feature (f) is
unpredictable for the viseme class (j). We calculate
the (σ
fj
) according to Equation 11.
(11)
Where (n) the number of vector sample of the
viseme class (j). Then, we calculate the weight
(
fj
w
) of the feature (f) in the viseme class (j)
according to the equation 12.
(12)
Where (F) is the number of the feature. It is clear
that the weights (
fj
w
) defined in this manner above
will satisfy:
(13)
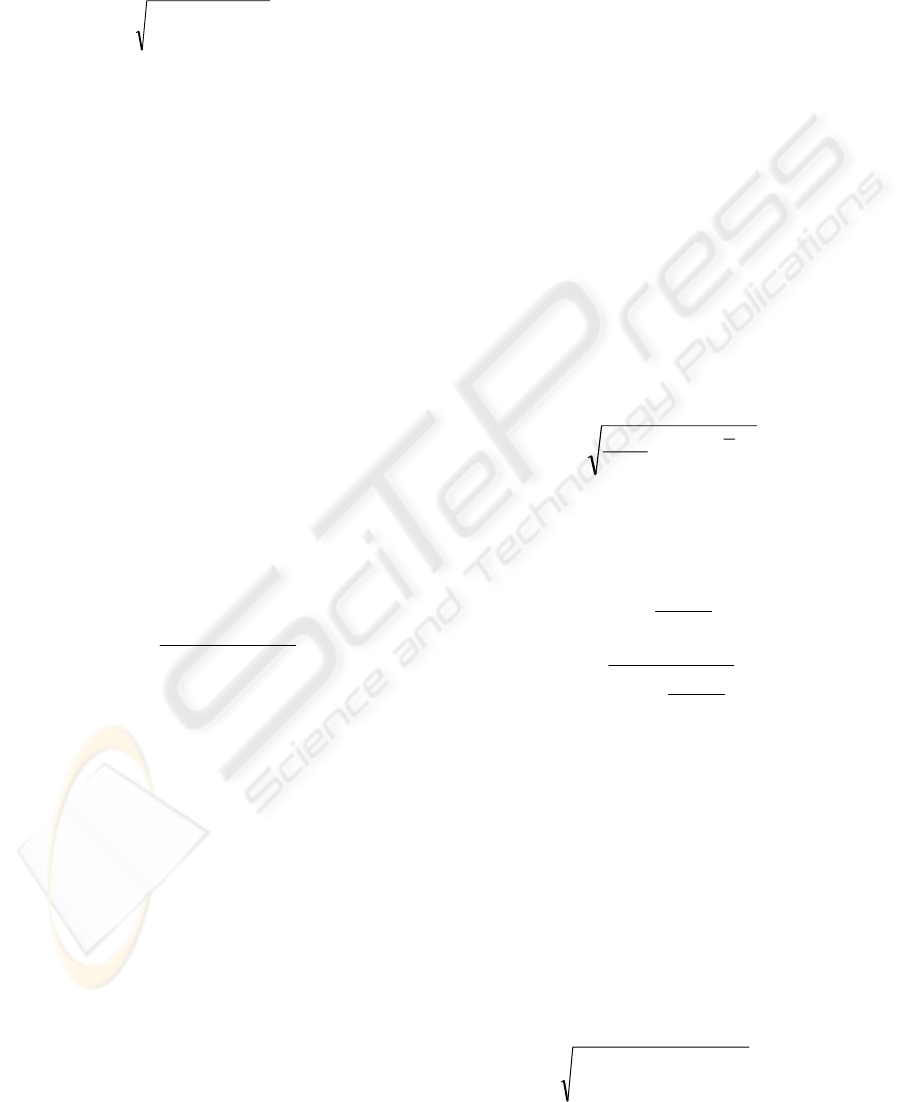
Figure 9 shows the result of the weighted features
with each viseme calculated from one speaker
samples data. Thus, for the classification of the
query point we calculate the distance with the cases
from the examples sample using each respective
weight. So, we introduce the weight (
fj
w
) as
showing in the equation 14:
(14)
∑∑
−=
==
F
f
n
i
fifi
yxd
11
2
)(
∑
−
−
=
=
k
i
i
i
i
yx
yx
yxW
1
i
i
ki
)),(Dexp(
)),(Dexp(
),(
rr
r
r
rr
∑
−
−
=
=
n
i
ifj
xx
n
1
2
)(
1
1
rr
σ
∑
∑
−
∑
−
=
=
=
=
F
f
F
f
fj
fj
F
f
fj
fj
fj
w
1
1
1
)1(
)1(
σ
σ
σ
σ
1
1
=
∑
=
F
f
fj
w
∑∑
−=
==
F
f
n
i
fififj
yxwd
11
2
)(*
ICEIS 2007 - International Conference on Enterprise Information Systems
34
0,00%
5,00%
10,00%
15,00%
20,00%
25,00%
DH DV' DA DV" TA OD
/i/
/o/
/ba/
/fi/
/cha/
/la/
/ta/
/so/
Figure 9: Result of the weighted features with each viseme
in our AV corpus.
The figure 10 present the influence of the (
fj
w
)
introduce on the recognition rate with various values
of k.
60,00%
65,00%
70 ,0 0 %
75,0 0 %
80,00%
85,00%
90,00%
95,00%
100,00%
1345678 9101112131415
k
unw eighted features
w eigthed features
Figure 10: Influence of the (
fj
w
) introduce on the
recognition rate with various value of k.
5 EXPERIMENTAL RESULTS
In this section we present the experimentation results
for the evaluation of our ALiFE system for the
visual speech recognition. We perform our visual
speech recognition system using our own
audiovisual database. The database includes ten test
subjects (three females, seven males) speaking
isolated visemes repeated ten times. In our
experiment, we use the data set for ten French
visemes. We conducted tests for only speaker
dependent using the six visual features described in
section 4. The recognition rate of each viseme as
well as a matrix of confusion between these visemes
will be shown. The test was set up by using a leave-
one-out procedure, i.e., for each person, five
repetitions were used for training and five for
testing. This was repeated ten times for each speaker
in our database. The recognition rate was averaged
over the ten tests and again over all ten speakers.
The experimental results are presented in Table 1. In
these results we notice that we reach a good
performance with K=8 and the weighted features
method. But, we also remark that the recognition
rate varies considerably for different words (like
viseme /ba/ , 60%) .
Table 1: Recognition rate of French visemes.
Input
Recognition Rate
/i/
100 %
/o/
100 %
/ba/
60 %
/fi/
100 %
/cha/
100 %
/la/
100 %
/ta/
100 %
/so/
80%
Recognition Rate
92.50 %
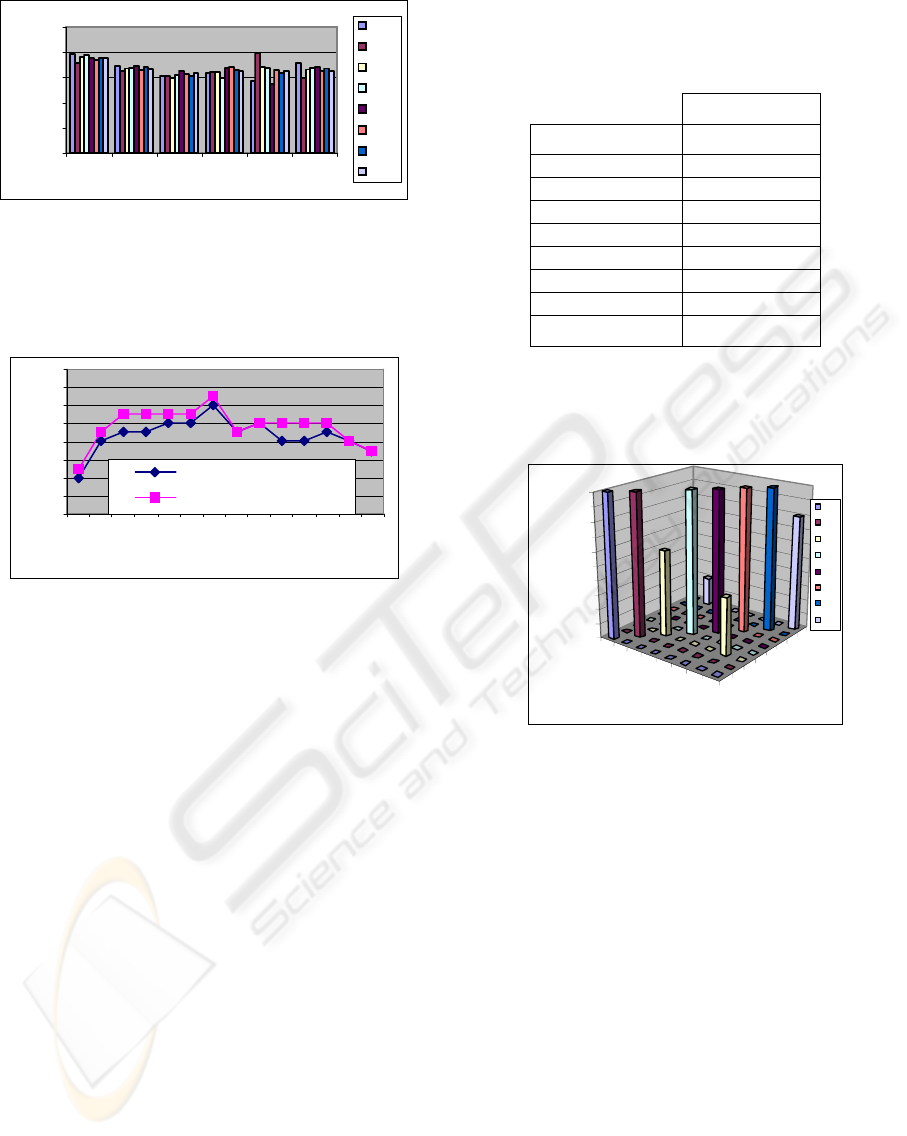
It can also be seen from figure 14 that the poor
recognition rate for viseme /ba/ (60%) is due to the
big confusion with viseme /ta/. So, we should think
in future work to resolve this viseme confusion.
i
o
ba
fi
cha
la
ta
si
i
o
ba
fi
cha
la
ta
si
0%
10 %
20%
30%
40%
50 %
60%
70 %
80%
90%
10 0 %
Confusion Rate
Out put
Input
V
iseme Confusion
Matrix
i
o
ba
fi
ch
a
la
ta
si
Figure 11: Experimental results of viseme confusion
matrix (k=8 + weighted features).
6 CONCLUSION AND FUTURE
WORK
Many works in the literature, from the oldest
(Petajan et al., 1988) until the most recent ones
(Goecke, 2004), proved the efficiency of the visual
speech-recognition system, particularly in noisy
audio conditions. Our research tasks relate to the use
of visual information for the automatic speech
recognition. The final objective is to develop a
simple human machine interaction system based on
lip-reading. This system allows depending people to
order his machine with easy lip movement or by
simple viseme pronunciation. The major difficulty of
the lip-reading system is the extraction of the visual
speech descriptors. In fact, to ensure this task it is
necessary to carry out an automatic tracking of the
A NEW LIP-READING APPROACH FOR HUMAN COMPUTER INTERACTION
35

labial gestures. The lip tracking constitutes in itself
an important difficulty. This complexity consists in
the capacity to treat the immense variability of the
lip movement for the same speaker and the various
lip configurations between different speakers.
In this paper, we have presented our ALiFE
system of visual speech recognition. ALiFE is a
system for the extraction of visual speech features
and their modeling for visual speech recognition.
The system includes three principle parts: lip
localization and tracking, lip feature extraction, and
the classification and recognition of the viseme. This
system has been tested with success on our audio-
visual corpus, for the tracking of characteristic
points on lip contours and for the recognition of the
viseme.
However, more work should be carried out to
improve the efficacy of our lip-reading system. As a
perspective of this work, we propose to add other
consistent features to resolve the confusion between
some visemes. We also propose to enhance the
recognition stage by the adequate definition of the
feature coefficients for each viseme. Finally, we plan
to enlarge the content of our audio-visual corpus to
cover other French language visemes and why not to
test our system performance with other languages.
REFERENCES
Petajan, E. D., Bischoff, B., Bodoff, D., and Brooke, N.
M., “An improved automatic lipreading system to
enhance speech recognition,” CHI 88, pp. 19-25,
1988.
Philippe Daubias, Modèles a posteriori de la forme et de
l’apparence des lèvres pour la reconnaissance
automatique de la parole audiovisuelle. Thèse à
l’Université de Maine France 05-12-2002.
Roland Goecke, A Stereo Vision Lip Tracking Algorithm
and Subsequent Statistical Analyses of the Audio-
Video Correlation in Australian English. Thesis
Research School of Information Sciences and
Engineering. The Australian National University
Canberra, Australia, January 2004.
McGurck et John Mcdonald. Hearing lips and seeing
voice. Nature, 264 : 746-748, Decb 1976.
Iain Matthews, J. Andrew Bangham, and Stephen J. Cox.
Audiovisual speech recognition using multiscale
nonlinear image decomposition. Proc . 4th ICSLP,
volume1, page 38-41, Philadelphia, PA, USA, Octob
1996.
Uwe Meier, Rainer Stiefelhagen, Jie Yang et Alex Waibe.
Towards unrestricted lip reading. Proc 2nd
International conference on multimodal Interfaces
(ICMI), Hong-kong, Jan 1999.
Prasad, K., Stork, D., and Wolff, G., “Preprocessing video
images for neural learning of lipreading,” Technical
Report CRC-TR-9326, Ricoh California Research
Center, September 1993.
Rao, R., and Mersereau, R., “On merging hidden Markov
models with deformable templates,” ICIP 95,
Washington D.C., 1995.
Patrice Delmas, Extraction des contours des lèvres d’un
visage parlant par contours actif (Application à la
communication multimodale). Thèse à l’Institut
National de polytechnique de Grenoble, 12-04-2000.
Gerasimos Potamianos, Hans Peter Graft et eric Gosatto.
An Image transform approach For HM based
automatic lipreading. Proc, ICIP, Volume III, pages
173-177, Chicago, IL, USA Octb 1998.
Iain Matthews, J. Andrew Bangham, and Stephen J. Cox.
A comparaison of active shape models and scale
decomposition based features for visual speech
recognition. LNCS, 1407 514-528, 1998.
N.Eveno, “Segmentation des lèvres par un modèle
déformable analytique”, Thèse de doctorat de l’INPG,
Grenoble, Novembre 2003.
N. Eveno, A. Caplier, and P-Y Coulon, “Accurate and
Quasi-Automatic Lip Tracking”, IEEE Transaction on
circuits and video technology, Mai 2004.
Miyawaki T, Ishihashi I, Kishino F. Region separation in
color images using color information. Tech Rep IEICE
1989;IE89-50.
Nakata Y, Ando M. Lipreading Method Using Color
Extraction Method and Eigenspace Technique
Systems and Computers in Japan, Vol. 35, No. 3, 2004
X. Zhang, Russell M. Mersereau, M. Clements and C.
Charles Broun. Visual Speech feature extractionfor
improved speech recognition. In Proc. ICASSP,
Volume II, pages 1993-1996, Orlondo,FL, USA, May
13-17 2002.
S. Werda, W. Mahdi and A. Benhamadou, “A Spatial-
Temporal technique of Viseme Extraction:
Application in Speech Recognition “, SITIS 05, IEEE,
S. Werda, W. Mahdi, M. Tmar and A. Benhamadou,
“ALiFE: Automatic Lip Feature Extraction: A New
Approach for Speech Recognition Application “, the
2nd IEEE International Conference on Information &
Communication Technologies: from Theory to
Applications - ICTTA’06 - Damascus, Syria. 2006.
S. Werda, W. Mahdi, and A. Benhamadou,
“LipLocalization and Viseme Classification for Visual
Speech Recognition”, International Journal of
Computing & Information Sciences. Vol.4, No.1,
October 2006.
N. B. Karayiannis and M. M.Randolph-Gips. Non-
euclidean c-means clustering algorithms. Intelligent
Data Analysis-An International Journal, 7(5):405–425,
2003.
C.M Bishop, Neural Networks for Pattern Recognition,
Oxford: Oxford University Press, 1995.
ICEIS 2007 - International Conference on Enterprise Information Systems
36
