
A FRAMEWORK FOR QUALITY EVALUATION
IN DATA INTEGRATION SYSTEMS
J. Akoka
1a
, L. Berti-Équille
2
, O. Boucelma
3
, M. Bouzeghoub
4
, I. Comyn-Wattiau
1ab
, M. Cosquer
6
V. Goasdoué-Thion
5
, Z. Kedad
4
, S. Nugier
5
, V. Peralta
4
and S. Sisaid-Cherfi
1a
1a
CNAM-CEDRIC et
1b
ESSEC,Paris, France
2
IRISA, Université de Rennes 1
3
LSIS, Aix-Marseille Université, France
4
PRISM, Université de Versailles Saint-Quentin, France
5
EDF- R&D, Clamart, France
6
Institut Curie, Paris, France
Keywords: Data Quality, Quality Meta-model, Data Integration Systems.
Abstract: Ensuring and maximizing the quality and integrity of information is a crucial process for today enterprise
information systems (EIS). It requires a clear understanding of the interdependencies between the
dimensions characterizing quality of data (QoD), quality of conceptual data model (QoM) of the database,
keystone of the EIS, and quality of data management and integration processes (QoP). The improvement of
one quality dimension (such as data accuracy or model expressiveness) may have negative consequences on
other quality dimensions (e.g., freshness or completeness of data). In this paper we briefly present a
framework, called QUADRIS, relevant for adopting a quality improvement strategy on one or many
dimensions of QoD or QoM with considering the collateral effects on the other interdependent quality
dimensions. We also present the scenarios of our ongoing validations on a CRM EIS.
1 INTRODUCTION
More and more systems need to integrate data
coming from multiple and heterogeneous data
sources and provide the users with a uniform access
to data. These systems, called data integration
systems (DIS) can be of several kinds, such as
mediation systems or data warehousing systems.
Mediation systems offer a uniform access to
multiple data sources; user queries are split and
directed towards various data sources through
wrappers, and the results returned by the sources are
combined by a mediator and sent to the users. Data
warehousing systems aim at providing integrated
information for decision-making; they materialize
the information extracted, transformed, and cleaned
from several data sources, possibly web-based
sources in a data webhousing context.
Ensuring the quality of data is an important
problem which conditions the success of most
existing information systems in enterprises. If
ignored, data quality may have a considerably
negative impact on the success of the enterprise. In
the case of DISs, the problem is particularly difficult
due to the integration of data coming from multiple
sources that have various schemata, various levels of
quality and trust, and autonomous evolution and
administration. Maintaining traceability, freshness,
non-duplication and consistency of very large data
volumes for integration and decision-making
purposes is thus one of the major scientific and
technological challenges today.
In this short paper, we claim that data quality in
enterprise information system (EIS) cannot be
restricted to one-shot approaches addressing
separately simpler or more abstract versions of the
problems when data is incomplete, inaccurate,
inconsistent, imprecise, uncertain, duplicated or
staled. Quality is multidimensional and has to be
addressed at three levels of the EIS design: the
quality of the conceptual data model (QoM), the
quality of stored data (QoD), and the quality of
processes on data (QoP). We propose a framework,
called QUADRIS that studies the interdependencies
between the various dimensions of quality at each
level of the EIS design and also between the levels.
170
Akoka J., Berti-Équille L., Boucelma O., Bouzeghoub M., Comyn-Wattiau I., Cosquer M., Goasdoué-Thion V., Kedad Z., Nugier S., Peralta V. and
Sisaid-Cherfi S. (2007).
A FRAMEWORK FOR QUALITY EVALUATION IN DATA INTEGRATION SYSTEMS.
In Proceedings of the Ninth International Conference on Enterprise Information Systems - ISAS, pages 170-175
DOI: 10.5220/0002378301700175
Copyright
c
SciTePress

The framework is developed within a project of the
same name, grouping four academic research teams
and two industrial users. The project is supported by
the French National Agency for Research.
The rest of the paper is organized as follows:
Section 2 gives an illustrative example of an EIS for
customer relationship management showing the
issue of quality in this application context. Section 3
presents the QUADRIS framework with the
definition of quality dimensions and metrics we
consider. Section 4 presents QUADRIS’ proofs of
concept, based on the assumptions that are currently
under validation on realistic and operational data
sets in one of three application domains we consider:
CRM data from the French Electrical Company
EDF, medical data from Institut Curie, and
geographical flooding data from Cemagref.
2 ILLUSTRATIVE EXAMPLE IN
A CRM APPLICATION
Customer Relationship Management (CRM) is a
process used to learn more about customers' needs
and behaviors in order to develop stronger
relationships with them and to identify, acquire,
foster and retain loyal and profitable customers.
From a functional point-of-view, Figure 1 depicts a
generic and simplified architecture of the EIS for a
CRM application that integrates data coming from 3
sources (S1, S2, S3) with their respective data model
(M1, M2, M3), by means of 6 integration processes
(e.g., ETL, cleaning) working on input/output
information flows (f1, …, f13), and the CRM
database CRM_DB. Since engineering and
integration processes and human expert can
introduce errors, quality control (QC) procedures
which can prevent and detect errors on data models,
on processes or on data become important
components of the global system. Consequently QC
policies over data models, databases, data flows and
processes operating on data (e.g., QC[M1], QC[f5],
QC[CRM_DB], etc.) may be designed at each level
for evaluating and improving the quality of the data
models (QoM), the quality of processes (QoP), and
the quality of data (QoD). In the last case, they can
be used to detect and correct data quality problems
of completeness (i.e., missing values), freshness,
uniqueness (i.e., presence of duplicates), and
valuation errors (e.g., misspellings, outliers,
inconsistencies, contradictions, constraints
violations, etc.).
Figure 1: Data integration in the CRM database of the
back-office EIS.
Each QC policy for QoD may combine several
techniques (such as ETL, exploratory data mining,
data sampling and tracking, etc.) for error detection
and correction. For CRM data integration, several
pieces of information (with potential overlaps or
conflicts) that describe the customer may come from
various sources through different paths (and
processes). Setting up systematically QCs for each
data flow, data model or process of the global
system is unaffordable and impossible in practice. It
is thus necessary to determine quality hot-spots and
vulnerabilities in the system (i.e., data flows,
processes or models that generate and propagate data
quality problems) in order to: i) choose the ``best''
path (less likely exposed to data quality problems)
and ii) target preventive or corrective actions
depending on the costs they generate at the different
levels, from the first steps of EIS design and
engineering (i.e., at the data model level), to the
management and integration of data (at the data and
process levels) (Peralta 2006).
3 QUADRIS FRAMEWORK
Before introducing our vision of quality in the
QUADRIS project, we clarify the terminology used
in the rest of the paper. Our quality approach is
based on a meta-model (Vassiliadis+ 2000), whose
main concepts are represented in the schema of
Figure 2 and defined hereafter. We argue that the
quality of an information system may be defined
according to several views, for instance the
specification, usage and implementation views
(Sisaïd+2002). The specification view is related to
the specification aspects and measures the quality of
the models. The implementation view refers to the
implementation aspects both for data and processes.
The usage view defines the user perceived quality of
the final system.
A FRAMEWORK FOR QUALITY EVALUATION IN DATA INTEGRATION SYSTEMS
171
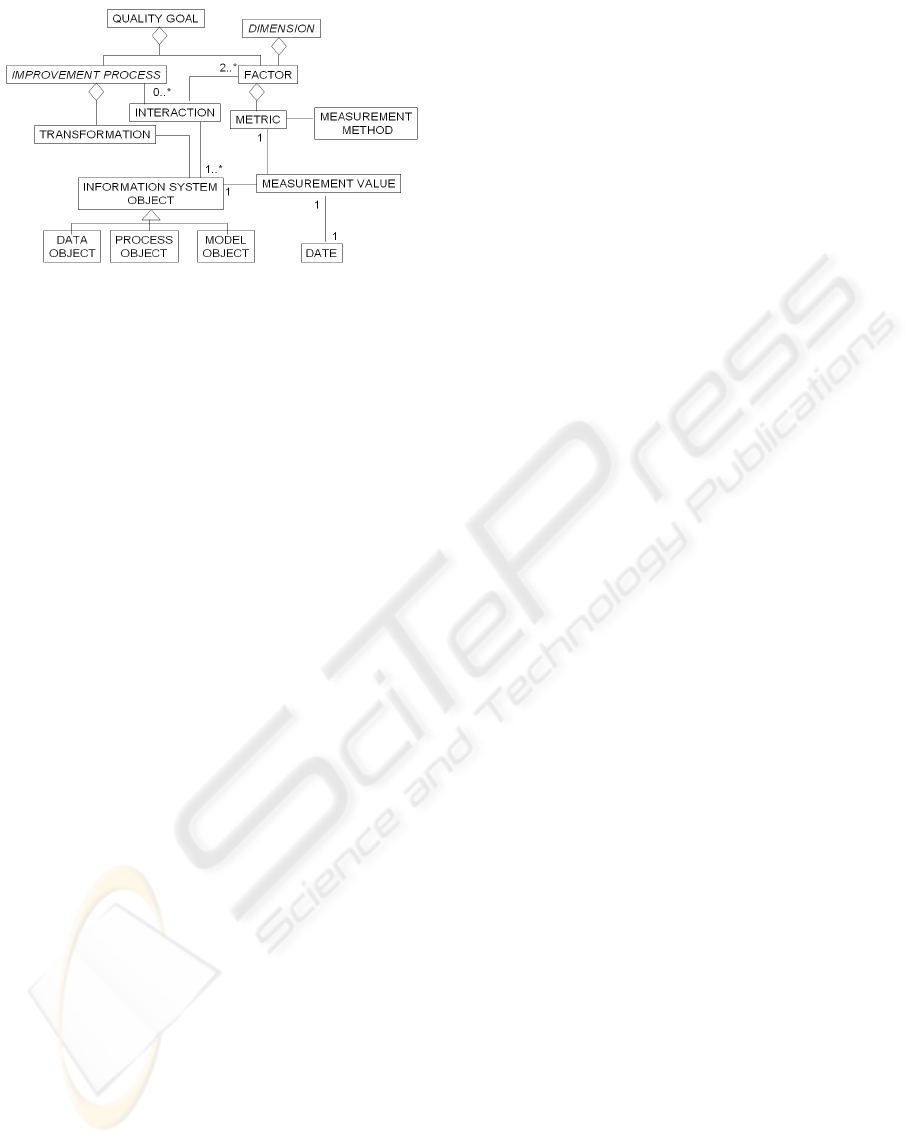
Figure 2: Meta-model for evaluating and improving
quality.
A quality of an information system is measured
through a set of quality dimensions (Vassiliadis
2000). A quality dimension describes a quality
characteristic the information system has to meet.
Some of these dimensions are detailed below
(freshness, completeness, etc.). Each quality
dimension could be measured applying either a
formal or an informal measurement method. A
formal measurement method could be a metric or an
expression. An informal measurement method could
be a range of scores or a qualitative opinion assigned
by a user or a designer. Our measurement of quality
is motivated by the need to propose corrective rules
aiming to improve the IS quality value. These rules
could be restructuring rules applied on the IS
models, corrective actions applied on data or
redefinition actions applied on processes (Peralta
2006). The quality measurement on the information
system (data, models and processes) enables the
designer to compute a set of IS quality indicators
that are used by the transformation rules
(Sisaïd+2006).
3.1 Quality of Data
Quality of data (QoD) is a multidimensional,
complex, morphing and goal-oriented concept
(Dasu+ 2003). This notion includes the following
dimensions:
Data Completeness concerns the degree to which all
data relevant to an application domain has been
recorded in an information system (Gertz+2004). It
expresses that every fact of the real world is
represented in the information system
(Bobrowski+1998). Two different aspects of
completeness can be considered: (i) Coverage
(Naumann+2003) describes whether all required
entities for an entity class are included; (ii) Density
(Naumann+2003) describes whether all data values
are present (not null) for required attributes.
Data Uniqueness states that two or more values do
not conflict each other (Mecella+2002).
Data Consistency expresses the degree to which a
set of data satisfies a set of integrity constraints
(Redman 1996). Data is said consistent if it satisfies
these constraints. The most common constraints
checks for null values, key uniqueness and
functional dependencies.
Data Freshness introduces the idea of how old is the
data: Is it fresh enough with respect to the user
expectations? Has a given data source the more
recent data? Is the extracted data stale? When was
data produced? There are two main freshness
definitions in the literature: (i) Currency
(Segev+1990) describes how stale is data with
respect to the sources. It captures the gap between
the extraction of data from the sources and its
delivery to the users. For example, given an account
balance, it may be important to know when it was
obtained from the bank data source. (ii) Timeliness
(Wang+1996) describes how old is data (since its
creation/update at the sources). It captures the gap
between data creation/update and data delivery. For
example, given a top-ten CD list, it may be
important to know when the list was created, no
matter when it was extracted from sources. Data
freshness evaluation has extensively been studied in
(Bouzeghoub & Peralta 2004).
Data Accuracy is concerned with the correctness
and precision with which real world data of interest
to an application domain is represented in an
information system (Gertz+2004) (Peralta 2006). It
introduces the idea of how precise, valid and error-
free is data: Is data in correspondence with real
world? Is data error-free? Are data errors tolerable?
Is data precise enough with respect to the user
expectations? Is its level of detail adequate for the
task on hand? There are three main accuracy
definitions in the literature: (i) Semantic correctness
(Wang+1996) describes how well data represent
states of the real-world. It captures the gap (or the
semantic distance) between data represented in the
system and real-world data. For example, the
recorded address “45, av. des États-Unis” is actually
the address of Mike? (ii) Syntactic correctness
(Naumann+1999) expresses the degree to which data
is free of syntactic errors such as misspellings and
format discordances. It captures the gap (or syntactic
distance) between data representation in the system
and expected data representation. For example, the
address “45, av. des États-Unis” is valid and well-
written? (iii) Precision (Redman 1996) concerns the
ICEIS 2007 - International Conference on Enterprise Information Systems
172

level of detail of data representation. It captures the
gap between the level of detail of data in the system
and its expected level of detail. For example, the
amount “$2008” is a more precise representation of
the salary of John that “$2000”.
3.2 Quality of Data Model
This section proposes some quality dimensions for
data model quality measurement:
Completeness. A conceptual schema is complete
when it represents all relevant features of the
application domain (Batini et al., 1992). More
specifically, the completeness can be measured by
the degree of coverage of users’ requirements by the
conceptual schema. Completeness is a very
important criterion as it is crucial for the success of
the future system. In other words, the degree of
disparity, between user requirements and their
interpretation by the designer as expressed in the
conceptual schema, measures the gap between the
user's and the designer’s perception of the same
reality.
Understandability. Understandability is defined as
the ease with which the user can interpret the
schema. This criterion is very important for the
validation phase and consequently influences
directly the measure of completeness. The
understandability of a conceptual schema relies on
how much modeling features are made explicit.
Non-explicit names, a high level of aggregation of
the modeling features, and the complexity of the
defined integrity constraints are factors that decrease
the schema understanding.
Minimality. A schema is said to be minimal when
every aspect of the requirements appears only once
(Batini et al., 1992). In other words, non-minimality
is due to a lack of factorization. A bad choice of
entities and generalization hierarchies may lead to
the replication of relationships in which several
entities are involved playing the same role.
Expressiveness. A schema is said to be expressive
when it represents users’ requirements in a natural
way. We distinguish between concept and schema
expressiveness. Concept expressiveness measures
whether the concepts are expressive enough to
capture the main aspects of the reality. For example,
an inheritance link is more expressive than a
relationship in the EER model. Indeed, an
inheritance link from entity-type E1 to entity-type
E2 expresses the fact that: i) there exists a
relationship between E1 and E2, ii) the set of E2
occurrences is included in the set of E1 occurrences,
iii) E2 shares all properties of E1, iv) E2 participates
to all relationship-types to which E1 participates.
Thus we propose to associate weights with the
different concepts involved. Schema expressiveness
measures the expressiveness of the schema as a
whole. It is clear that the greater the number of
concepts used is the higher the expressiveness of the
conceptual schema is.
4 EXPRESSING
INTERDEPENDENCIES OF
QUALITY DIMENSIONS
As reported in several recent studies, data quality
problems cost hundreds of billions of dollars a year
to the companies. Combined approaches should
explore databases both at the extensional and
intentional levels, quickly detect data quality
problems (such as duplicates, contradictions,
inconsistencies, stale or incomplete data), correct,
evaluate, improve and ensure information quality of
the enterprise information systems. For ensuring and
maximizing the quality and integrity of information,
a clear understanding of the interdependencies
between the measurable dimensions characterizing
quality of data, quality of data model, and quality of
data management processes are needed, since the
improvement of one dimension may not have as a
consequence the improvement of the other QoD
dimensions. Thus, adopting a quality improvement
strategy for one or many dimensions of QoD, QoM,
or QoP should take into account both its total cost
and the collateral effects on the other interdependent
QoD dimensions. The next subsections present our
study in the QUADRIS framework related to this
problem.
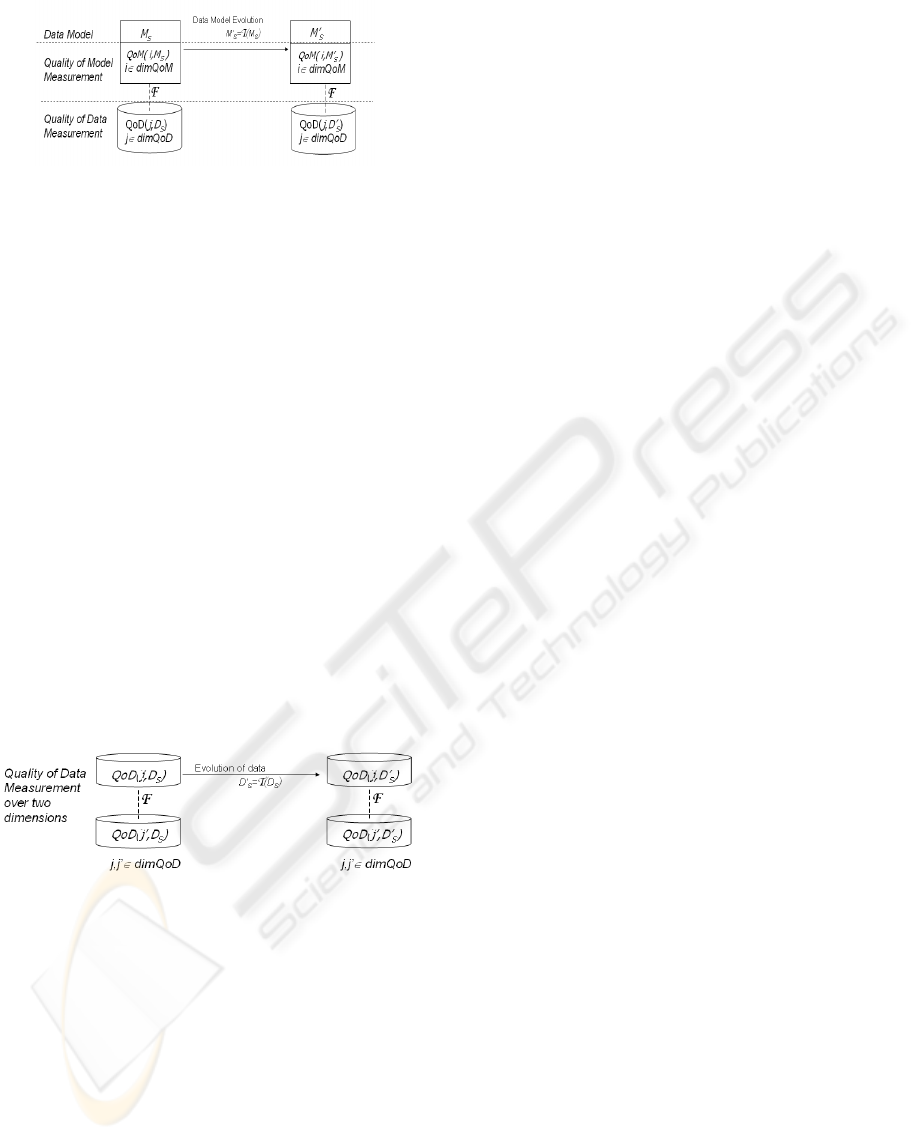
4.1 Impact of QoM on QoD
Consider that the data of the CRM EIS, noted Ds is
stored in a database with a conceptual data model
Ms for which each quality dimension, noted i
(i∈dimQoM) defined in Section 2.2 is evaluated, as
illustrated in Figure 3. Each data quality dimension j
is also measured (j∈dimQoD). When the model is
transformed into a new data model Ms’, the
measures of the quality of this new model,
QoM(i,Ms’) and the ones of the quality of
corresponding data, QoD(j,Ds’) change respectively
for each dimension.
The purpose of the QUADRIS meta-model is to
identify and demonstrate which and how dimensions
of QoM are correlated together with the dimensions
A FRAMEWORK FOR QUALITY EVALUATION IN DATA INTEGRATION SYSTEMS
173
of QoD. Typically, an action on QoM dimensions
may have positive or negative consequences on the
measures of QoD dimensions: e.g., increasing the
minimality of the conceptual data model of the EIS
database may also decrease the completeness of
data; increasing the expressiveness of the model by
adding integrity constraints may also increase data
uniqueness, data accuracy, and data consistency. Our
study focuses on the quantification of such
correlations represented in Figure 3 by the function
F. Orthogonally, we study the transformations T
that can be made on the model Ms (e.g., adding
constraints, checking assertions, or changing the
schema) that are cost-optimal and preserve the
positive effects of the function
F.
4.2 Interdependencies between QoD
Dimensions
Analogously, we measure each dimension of data
quality of the EIS database (j, j’ ∈ dimQoD) and we
apply a transformation
T on the dataset Ds that
becomes Ds’. Such a transformation will have
consequences on the quality measures of other QoD
dimensions (QoD(j’,Ds’)). Again our framework
intends to identify which of and how the considered
QoD dimensions are correlated with the same
function
F, as illustrated in Figure 4. For example, if
we increase the accuracy of data to be integrated and
loaded into the EIS database, this will require
additional cross-checking procedures, and thus, it
will decrease the freshness of data.
5 ONGOING VALIDATIONS ON
CRM EIS
Intuitively presented in the previous subsections, our
approach will be validated on operational data sets
for the CRM application domain, provided by EDF.
Quite similar approaches have been defined for the
medical and geographical domains. All these
domains are of course very concerned by the quality
of their databases since a low quality of data could
have considerably negative financial impacts and
even lead to harmful decision. The EDF Group is an
integrated energetic utility, and manages all aspects
of the electricity business. Here, we focus on a
commercial aspect of the group. EDF has a strong
footing in Europe, with a total of 40.2 million
customers worldwide (including 28 million in
France). Thus, its CRM databases treat a large
volume of multi-source information. The database
chosen for QUADRIS framework validation is used
for the management of major and small business
French markets (these markets represent 2.3 million
customers). This relational database is called
CRM_DB in the following. This database is a crucial
component of a complex chain of data integration
processes (as in Figure 1). Two scenarios in close
connection with the database quality have been
defined. Their goal is to display quality requirements
related to the use of CRM_DB. These scenarios start
with an operational aim and they end with a precise
definition of the metrics used to measure the quality
dimensions concerned by this operational aim. This
step is obviously crucial in order to understand
which dimensions (and their corresponding metrics)
of QoM, QoD and QoP affect CRM_DB.
Validation of the impact of QoM on QoD. In order
to validate the impact of QoM on QoD, we consider
two different conceptual data models of CRM_DB:
M and M’. The M’ model is the current version of
CRM_BD conceptual model and M is the previous
one. We inject the same information in M and M’ so
that the respective corresponding data D and D’ are
comparable. The approach has three steps:
1. Measurement of the conceptual data model
quality dimensions for M and M’ (w.r.t.
dimensions defined in Section 2.2 and
dimensions exhibited by the scenarios) with the
appropriate metrics
2. Measurement of the data quality dimensions for
D and D’ (w.r.t. dimensions defined in Section
2.1 and dimensions exhibited by the scenarios)
with the appropriate metrics
Figure 3: Interdependencies between QoM and QoD
dimensions.
Figure 4: Interdependencies between QoD dimensions.
ICEIS 2007 - International Conference on Enterprise Information Systems
174

3. Comparison of results by couple of metrics (i,j)
where i is a conceptual data model quality
metric and j is a data quality metric.
Validation of interdependencies between QoD
dimensions. In order to validate the
interdependencies between QoD dimensions, we
focus on one status of CRM_DB. Then, for each
couple (d
1
,d
2
) of quality dimensions (Section 2.1,
namely, freshness and accuracy, completeness and
uniqueness, completeness and consistency), we use
the following approach:
1. Measure of d
1
and d
2
for CRM_DB
2. Artificial deterioration (or improvement) of the
data quality for the dimension d
1
3. Characterization of d
2
behavior.
6 CONCLUSIONS
This paper describes an ongoing research project
dedicated to the evaluation and improvement of data
quality in enterprise information systems. A
framework, called QUADRIS, has been proposed
and is currently under experimentations on very
large databases in three application domains: CRM
(EDF), medical domain (Institut Curie) and
geographical domain (Cemagref). The aim is to
identify the interdependencies between quality
dimensions considering two IS design levels: i)
interdependencies between dimensions of quality of
data (QoD), and ii) interdependencies between QoD
dimensions and quality of conceptual data model
(QoM) dimensions. This study already offers very
interesting and quantifiable perspectives for
designing quality-aware information systems and for
setting up cost optimal strategies for data quality
prevention and improvement in EIS.
ACKNOWLEDGEMENTS
The QUADRIS project is funded by the ANR ARA
Masses de Données Program (2005-2008), “Grant ARA-
05MMSA-0015”.
REFERENCES
Batini C., Ceri S., Navathe S.B., Conceptual database
design: An Entity Relationsip approach, Benjamen
Cummings, 1992.
Bobrowski, M.; Marré, M.; Yankelevich, D.: A Software
Engineering View of Data Quality. Intl. Software
Quality Week Europe (QWE'98), 1998.
Bouzeghoub M. Peralta, A Framework for Analysis of
Data Freshness, Intl. Workshop on Information
Quality in Information Systems (IQIS’2004), 2004.
Dasu T. Johnson T., Exploratory Data Mining and Data
Cleaning, John Wiley, 2003.
Gertz, M.; Tamer Ozsu, M.; Saake, G.; Sattler, K., Report
on the Dagstuhl Seminar: Data Quality on the Web.
SIGMOD Record, Vol. 33(1), March 2004.
Grigori D., Peralta V., Bouzeghoub M. Service Retrieval
Based on Behavioral Specifications and Data Quality
Requirements. 3rd Intl. Conf. on Business Process
Management (BPM'05), 2005.
Mecella, M.; Scannapieco, M.; Virgillito, A.; Baldoni, R.;
Catarci, T.; Batini, C.: Managing Data Quality in
Cooperative Information Systems. Intl. Conf. DOA,
CoopIS and ODBASE (DOA/CoopIS/ODBASE'02),
2002.
Naumann, F.; Leser, U.; Freytag, J.C., Quality-driven
Integration of Heterogeneous Information Systems.
Intl. Conf. on Very Large Databases (VLDB'99),
1999.
Naumann, F.; Freytag, J.C.; Leser, U., Completeness of
Information Sources. Intl. Workshop on Data Quality
in Cooperative Information Systems (DQCIS'03),
2003.
Peralta V.: Data Quality Evaluation in Data Integration
Systems, PhD Thesis, Université de Versailles, France
& Universidad de la República, Uruguay, November
2006.
Redman, T., Data Quality for the Information Age. Artech
House, 1996.
Segev, A.; Weiping, F., Currency-Based Updates to
Distributed Materialized Views. Intl. Conf. on Data
Engineering (ICDE'90), 1990.
Sisaïd S., Akoka J., Comyn-Wattiau I., Conceptual
Modeling Quality - From EER to UML Schemas
Evaluation, Intl. ER2002 Conf., 2002.
Sisaïd S., Akoka J., Comyn-Wattiau I., Use Case
Modeling and Refinement: A Quality-Based
Approach. Intl. ER2006 Conf., 2006.
Vassiliadis, P., Bouzeghoub, M., Quix, C.: Towards
Quality Oriented Data Warehouse Usage and
Evolution. Information Systems J., Vol 25, N°2, pp.
89-115, 2000.
Wang, R.; Strong, D., Beyond accuracy: What data quality
means to data consumers. J. on Management of
Information Systems, Vol. 12 (4):5-34, 1996.
A FRAMEWORK FOR QUALITY EVALUATION IN DATA INTEGRATION SYSTEMS
175
