
VISUALISATION AND ANALYSIS OF RELATIONNAL DATA BY
CONSIDERING TEMPORAL DIMENSION
Eloïse Loubier and Bernard Dousset
Institut de Recherche en Informatique de Toulouse
118 route de Narbonne, 31062 Toulouse Cedex 9
Keywords: Graph drawing, relational analysis, actor network, semantic network, morphing, alliance, evolutionary
graph, space/time analogy.
Abstract: Visualization based on graph drawing allows the identification, the evaluation of passed and present
structures between actors and concepts. It also allows the deduction of future ones. VisuGraph is developed
in order to offer to the users the visualization and the interactive classification of relational data. We
propose to complete this prototype with a morphing algotihm which animates with fluidity the
representation between different time periods, emphasizing major elements and significant tendencies.
1 INTRODUCTION
Within strategic information framework, graphs
appear as a tool of synthetic and intuitive
representation of actor networks or semantic
networks. Remarkable topologies are thus identified,
revealing relationships between the various actors
(authors, laboratories, companies, country) and the
terms and/or concepts. Moreover, the study of the
evolution of a network structure in time
(collaborations, co-quotations, co-signatures, co-
occurences, alliances, fusions, acquisitions,
licences,…) allows the evaluation of their last and
current organizations. It makes it possible to deduce
from them their future organizations and their
implications in order to make a decision.
In this context, our research institute proposes
the Tetralogie platform for the visualisation of
relational data. Dedicated to macro analyses, it
makes it possible (remotely and with several users)
to carry out strategic analyses starting from
heterogeneous textual data, by the means of methods
of traditional or innovative data analysis. The
prototype VisuGraph adds to this platform
visualization and interactive classification of
relational data.
In this article, we will focus on analysing the
dynamicity of relational data networks considering
their evolution.
Firstly, we present works on the visualisation of
relational information in order to allow the analysis
of their evolution. Secondly, within the framework
of the platform Tetralogie, we propose new
functionalities for VisuGraph for the visualisation of
the evolution of the various networks and to analyze
the dynamics of their relations from a strategic point
of view,.
We implement a graph algorithm, which reveals
the successive structures by animating the graph
representation between various periods, significant
changes and determining actors and/or concepts. The
representation is based on spaces/time analogy used
for a clock. The objective is to obtain an intuitive
reading of the evolution by sequentially distributing
the periods on a dial. The representation is animated
in a similar way as how we play a video in a fast-
forward mode. The strategic placement of the nodes
allows then, not only, to locate them in time but also
to evaluate their persistence and to deduce the
evolution. We develop this approach while insisting
on data structures, the optimization of graph drawing
and its animation.
2 DATA VISUALISATION
The analysis of the evolution of relational
information is typically based on techniques of
dynamic graphs visualization.
Researchers have developed numerous network
visualisation systems, (DiBattista et al., 1999),
including internet connectivity maps, large networks
of telephone calls, the structure of research shown as
550
Loubier E. and Dousset B. (2007).
VISUALISATION AND ANALYSIS OF RELATIONNAL DATA BY CONSIDERING TEMPORAL DIMENSION.
In Proceedings of the Ninth International Conference on Enterprise Information Systems - ISAS, pages 550-553
DOI: 10.5220/0002375305500553
Copyright
c
SciTePress
citation networks, and the progressive visualisation
of how a knowledge domain evolves.
Brandes (Brandes and Corman, 2003) presents a
system for the visualization of the networks
evolution in 3D. Figure 1 is carried out in the form
of layers representing the network for a given time
period. Each node corresponds to an entity remain,
placed in a particular position on each layer. Thus,
the visualization of the evolution is based only on
the links and not on the structure.
Figure 1: 3D representation of an evolutionary network:
Brandes (Brandes and Corman, 2003).
Erten (Erten et al., 2004) a visual analysis of the
evolution of the collaborations between researchers
of a given field. TGRIP produces a 2D
representations series (see figure 2), for each period,
linking all the nodes common to each period. Nodes
and edges of the graph have a weight calculated
according to the structure of the graph.
Thus, each node has a size in relation with its
weight. The weight of an edge is used to calculate
the attraction force between the nodes during the
graph rendering.
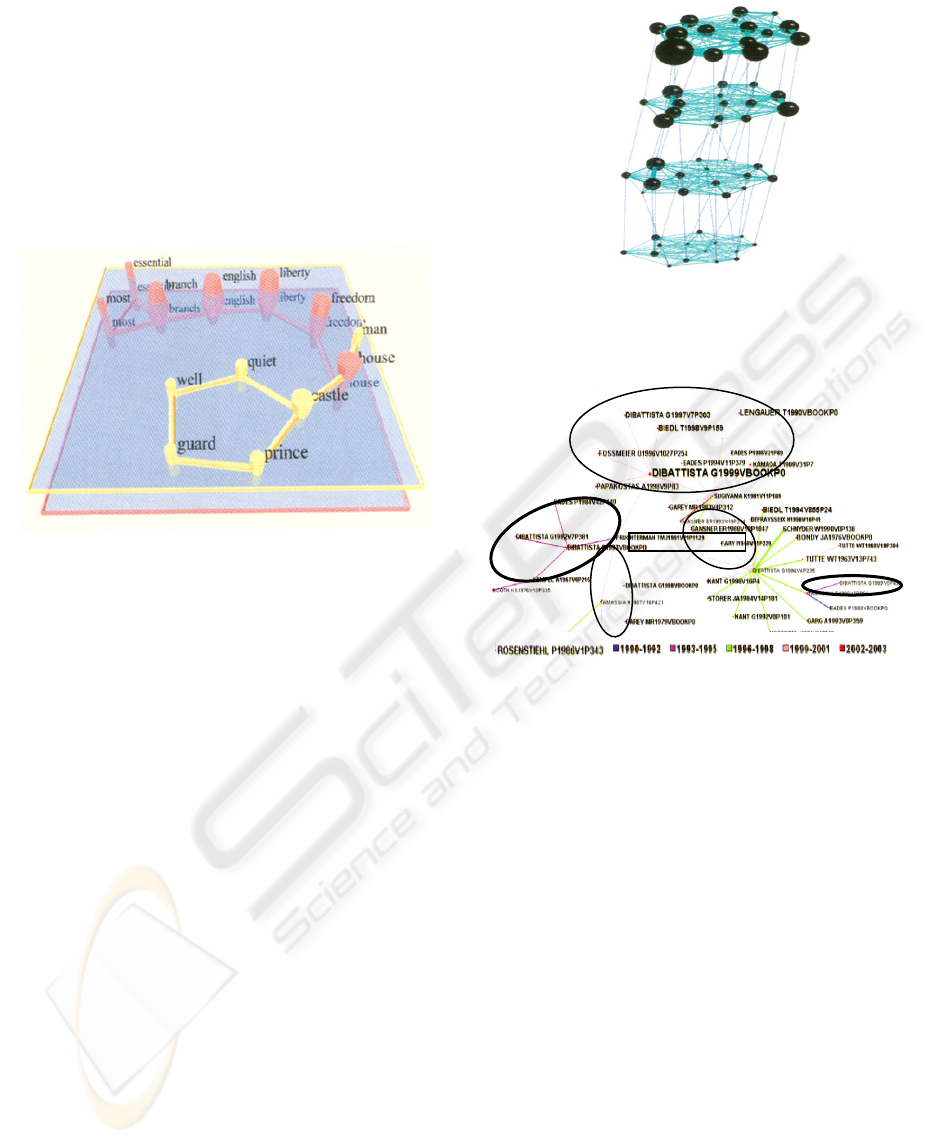
Figure 3, generated by CiteSpace Chen (Chen,
2004), visualizes the most salient co-citation
network of articles published in a domain subject. In
this figure, the graph is based on researches realised
in graph rendering domain. It patches individual
snapshots of co-citation networks taken from
different time slices into a panoramic view. The
important visual and structural attributes include
pivots points
A pivot is a joint between individual snapshots.
Represented on figure 3, it joins branchs surrounded
by a dark black cercle (1993-1995) and branchs
surrounded by a light black cercle (1999 – 2001).
Figure 2: 2D representation of the evolution of
collaborations with TGRIP: Erten et al. (Erten et al.,
2004).
Figure 3: A co-citation map of graph drawing articles
(1990 – 2003) by CiteSpace: Chen (Chen, 2004).
3 TETRALOGIE PLATFORM
3.1 Principles
In strategic information context, IRIT, our research
institute, proposes a powerful tool for the
visualisation of relational data: Tetralogie.
This platform makes it possible (remotely and with
several users) to carry out strategic analyses starting
from heterogeneous textual data. Tetralogie is
composed of two parts:
a handling system of corpus allowing to manage
files resulting from download or interrogations of
CD. By various tools, it allows to extract matrices of
crossing
by considering into account each base and each
format specificity.
- an analysis system of the information contained
in the matrices, which is articulated around a
specific 3D spreadsheet. and which uses innovating
data on static, biparting or evolutionaring fields.
VISUALISATION AND ANALYSIS OF RELATIONNAL DATA BY CONSIDERING TEMPORAL DIMENSION
551

The VisuGraph prototype, a Tetralogie module adds
visualization and interactive classification of
relational data, in a comprehensive way and by
provides to the user a maximum of synthetic
information.
3.2 Representation of Evolutionary
Data
The relational data used result from information
treatments under Tetralogie. Data are represented in
matrices forms by crossed entities over several
temporal homogeneous segments (or time periods).
Then our work consists in transforming these
data into a networks representation, where the nodes
represent entities and the links define the relations
between them. It is possible to define a graph for
each value of the temporal dimension.
This solution makes it possible to only analyze
separately the period time compared to each other
and never combined. Another approach consists in
building the “total” graph G
1-n
, like the combination
of the graphs G
1
, G
2
,…, Gn of the n periods. The
total graph is associated to a matrix resulting from
the addition of the matrices of all the periods. The
advantage of this representation is to dispose of a
total sight of each data for each time period of the
analysis: total positioning.
4 VISUGRAPH PROTOTYPE
According to Tufte (Tufte, 1983), “an excellent
graph provides to the reader the maximum number
of ideas in shortest lapse of time by using less ink
and smallest space”. Based on this principle and on
Karouach’s works (Karouach and Dousset, 2004) we
propose to extend VisuGraph functionalities.
Relations are represented using a graph whose nodes
are the objects and the edges are the links
comparable to springs.
4.1 Graph drawing
4.1.1 Force_Directed Placement
In order to place the nodes as well as possible, we
have decided to use force_directed placement
functions applied on the nodes. These functions
follow generally accepted aestetic criteria for
graph
rendering, including evenly distributed vertices,
minimized edges crossings, and uniform edge
lengths.
According to Eades (Eades, 1984), a graph is
comparable with a spring model while taking as a
starting point the physical laws of graph drawing.
This system generates forces between the nodes that
involves their displacement. Attraction forces are
calculated only for neighboring nodes and repulsive
force are calculated for all pairs of nodes.
The attraction force between the nodes can be
proportional to the force of the bond between them.
The attraction force between two nodes υi and υj is
given by:
ƒa (υ
i
, υ
j
) = β
ij
× d
ij
αa /K (1)
β
ij
is a function of the edge weight (υ
i
, υ
j
) and of the
nodes weight υ
i
and υ
j
. The factor K is calculated
according to the surface of the representation and the
number of graph nodes. d
ij
is the distance between
υ
i
, υ
j
in the representation.
If the nodes υ
i
, υ
j
are not connected by an edge then
ƒa (υ
i
, υ
j
) = 0..
The repulsion force between two nodes υ
i
and υ
j
is
defined by:
ƒr (υ
i
, υ
j
) = -K² / d
ij
αr × β
ij
(2)
The variable αr (resp. αa) is a constant which is used
to define the attraction degree (resp. repulsion)
between two nodes.
Starting from an initial state of strong energy, we
release the system until the nodes are harmoniously
positioned without superimposing themselves. On
the level of each node, the associated metric value is
represented by one or several histogram bar. The
static analysis can be at the origin of serious errors
in the interpretation over a long period, especially if
the visualisation is about non cumulative
phenomena.
As a consequence, it appeared necessary to add to
VisuGraph dynamicity for faithful and rigorous
analyses.
4.1.2 Dynamic Case
I
n order to add to our prototype a dynamic aspect,
we designed a morphing graph algorithm, which
reveals the successive structures, by animating the
graph between various time periods. It reveals the
significant changes and it determines actors and/or
concepts. The graph morphing allows to detect,
include/understand and even to predict the
significant tendencies, through the visualization of
data evolution, while being based on the spaces/time
analogy. In our case, nonvisible temporal references
represent the various time periods. They are fixed in
a chronological order and in an equidistant way on
ICEIS 2007 - International Conference on Enterprise Information Systems
552

the circumference of the display window (like the
hours on a dial).
Graph is influenced by the attribution of new
bonds connecting each node to the temporal
reference marks, which are related to the time period
considered. It generates a displacement, locating
each node next to the marks of the time periods that
it belongs. After stabilization of the graph, each
peripheral sector of the window corresponds to a
typology of particular evolution, only the center can
contain several types of persistence (continuous
presence or over a few spaced periods).
The graphs of various periods can be represented
individually, by simply hiding nodes and bonds not
concerned by the selected period. It is then possible
to detect, for example, an emergent structure or an
organisational change and to check the relevance of
the following period level.
The representation of the nodes as evolution
histogram makes it possible to locate them in time;
For example, if the upper-left part (last reference)
contains a majority of recent nodes, it is here where
we must seek the famous weak signals and try to
envisage their evolution.
The distribution of the other nodes is carried out
randomly. In the dynamic approach, the drawing of
the same total graph makes it possible to locate the
nodes according to their specific periods.
5 CONCLUSION
VisuGraph appears as an ergonomic and powerful
tool for dynamic data analysis which makes it
possible to reveal, include/understand and anticipate
the subjacent structures in order to identify their
strategic implications. We have demonstrated the
potential of an integrative approach to the
visualization and analysis of a research field
evolution. In particular, we have focused on various
practical issues concerning detecting emerging
trends and abrupt changes in transient research
fronts. The encouraging results indicate that this is a
promising line of research with the potentially wide-
ranging benefits to users from different disciplines.
This prototype is on its first steps ans requires
some improvements. The nodes are strongly
attracted by the temporal references, changing their
first position which took care of the relations with
the neighboring nodes. Thus, we would find a
compromise for a more flexible animation of the
movement between two time periods, then an
adapted cinematic for each time period.
Moreover, this morphing is conditioned by the
user point of view. It can be, for example, directed
towards the detection of strong signals (important or
persistent) or weak signals (appearances,
disappearances, reorganizations of actors which can
be potentially interesting). Thus, we must locate the
problems of each one precisely and draw the graph
while taking the user interests into account.
REFERENCES
Brandes U., Corman S., 2003. Visual unrolling of network
evolution and the analysis of dynamic discourse.
InfoVis'02(2), N°1, pp. 40-50.
Chen C, 2004. Searching for intellectual turning
points:Progressive Knowledge Domain Vizua-lisation.
Proceedings of the National Academy of Sciences of
the United States of America, 101(suppl. 1), pp. 5303-
5316.
http://www.pnas.org/cgi/reprint/0307513100v1.pdf
Chen C., Kuljis J., 2003. The rising landscape: A visual
exploration of superstring revolutions in physics.
Journal of the American Society for Information
Science and Technology, 54(5), pp. 435-446.
DiBattista G., Eades P., Tamassia R., Tollis IG, 1999.
Graph drawing:Algorithms for the visualisation of
graphs. Upper Saddle River, NJ:Prentice Hall, 1999.
Eades P., 1984. A heuristic for Graph Drawing.
Congressus Numerantium, vol. 42, pp. 149-160.
Erten C., Harding P., Kobourov S., Wampler K., Yee G.,
2004. Exploring the computing literature using
temporal graph visualization. Conference on
Visualization and Data Analysis.
Karouach S., Dousset B., 2004. Analyse d'information
relationnelle par des graphes interactifs de grandes
tailles. EGC’04, Clermont Ferrand.
Tufte E., 1983. The visual display of quantitative
information. Graphic Press. Cheshire, pp. 198,
Connecticut.
VISUALISATION AND ANALYSIS OF RELATIONNAL DATA BY CONSIDERING TEMPORAL DIMENSION
553
