
FORECASTING OF CHANGES OF COMPANIES FINANCIAL
STANDINGS ON THE BASIS OF SELF-ORGANIZING MAPS
Egidijus Merkevičius, Gintautas Garšva, Stasys Girdzijauskas
Department of Informatics, Kaunas Faculty of Humanities, Vilnius University, Muitinės st. 8, LT- 44280 Kaunas, Lithuania
Vitolis Sekliuckis
Department of Software Engineering, Kaunas University of Technology, Studentų 50, LT-51368 Kaunas, Lithuania
Keywords: Bankruptcy, Self-organizing maps, Neural network, prediction, multivariate discriminate model.
Abstract: The multivariate discriminate models have been used in area of bankruptcy analysis for many years. In this
paper we suggest to conjunct the principles of traditional discriminate bankruptcy models with modern
methods of machine learning. We propose the forecasting model based on Self-organizing maps, where
inputs are indicators of multivariate discriminate model. Accuracy of forecasting is improved via changing
weights with supervised learning type ANN. We’ve presented results of testing of this model in various
aspects.
1 INTRODUCTION
The multivariate discriminate models such a Altman
Z-score (1968, 2001), Zmijewski (1984), or
Shumway (2001) have been used in area of
bankruptcy analysis for many years. The key-point
of multivariate discriminate models is to determine
the most important indicators (ratios) and their
weights in discriminate or logistic function.
Starting 80`s the artificial intelligence methods,
for example, artificial neural networks (ANN), fuzzy
logic, expert systems, have been developed and find
theoretical and practical adaptability for forecasting
of changes of companies financial standings. One of
the type of unsupervised learning ANN is Self-
organizing maps, first presented by Kohonen
(Kohonen, 1997).
In this paper, we suggest to conjunct the
principles of traditional discriminate bankruptcy
models with modern methods of machine learning.
We propose the forecasting model based on Self-
organizing maps, where inputs are indicators of
multivariate discriminate model. Accuracy of
forecasting is improved via changing weights with
supervised learning type ANN.
Review of related works in the adaptability of
SOM for finance related problems is presented in the
second section of this paper. The basic principles of
proposed Neuro-discriminate model are presented in
the third section. The results of experiments with
proposed model using the real world financial data
are demonstrated in the forth section. The last
section makes some conclusions and introduces
future works.
2 RELATED WORKS
A detailed description of the SOM method is
presented in (Kohonen, 1997). Martin-del-Prio and
Serrano-Cinca were one of the first who applied
SOM in financial analysis. They generated SOM’s
of Spanish banks and subdivided those banks into
two large groups. The configuration of banks
allowed determining root causes of the banking
crisis (Martin-del-Prio and Serrano-Cinca, 1993).
In this case (Merkevičius et.al, 2006) the
bankruptcy class of data is labeled on the map and
the data distribution is analyzed.
Kiviluoto (Kiviluoto, 1998) made a map by
means of including 1137 companies, 304 out of
which were crashed. It was stated that SOM’s give
useful qualitative information for establishing
similar input vectors. Based on Kiviluoto’s study,
through visual exploration one can see the
416
Merkevi
ˇ
cius E., Garšva G., Girdzijauskas S. and Sekliuckis V. (2007).
FORECASTING OF CHANGES OF COMPANIES FINANCIAL STANDINGS ON THE BASIS OF SELF-ORGANIZING MAPS.
In Proceedings of the Ninth International Conference on Enterprise Information Systems - AIDSS, pages 416-419
DOI: 10.5220/0002371804160419
Copyright
c
SciTePress
distribution of important indicators (i.e. bankruptcy)
on the map.
3 METHODOLOGY
Artificial neural networks (ANN) are divided into
supervised and unsupervised learning (Atiya, 2001,
Vesanto et.al, 2000). The Self-organizing map
(SOM) is an unsupervised learning artificial neural
network that is generated without defining output
values (Doebeck, 1998). The outcome of this
process is a two-dimensional cluster map that can
visually demonstrate the financial units which are
scattered according to similar characteristics.
Methods used in the Model are original with no
major adjustments, so they are not presented. More
detailed description of multivariate discriminate
analysis, supervised learning neural network and
self-organizing maps are presented in (Altman,
1968, Zmijewski, 1984, Kohonen, 1997, Atiya,
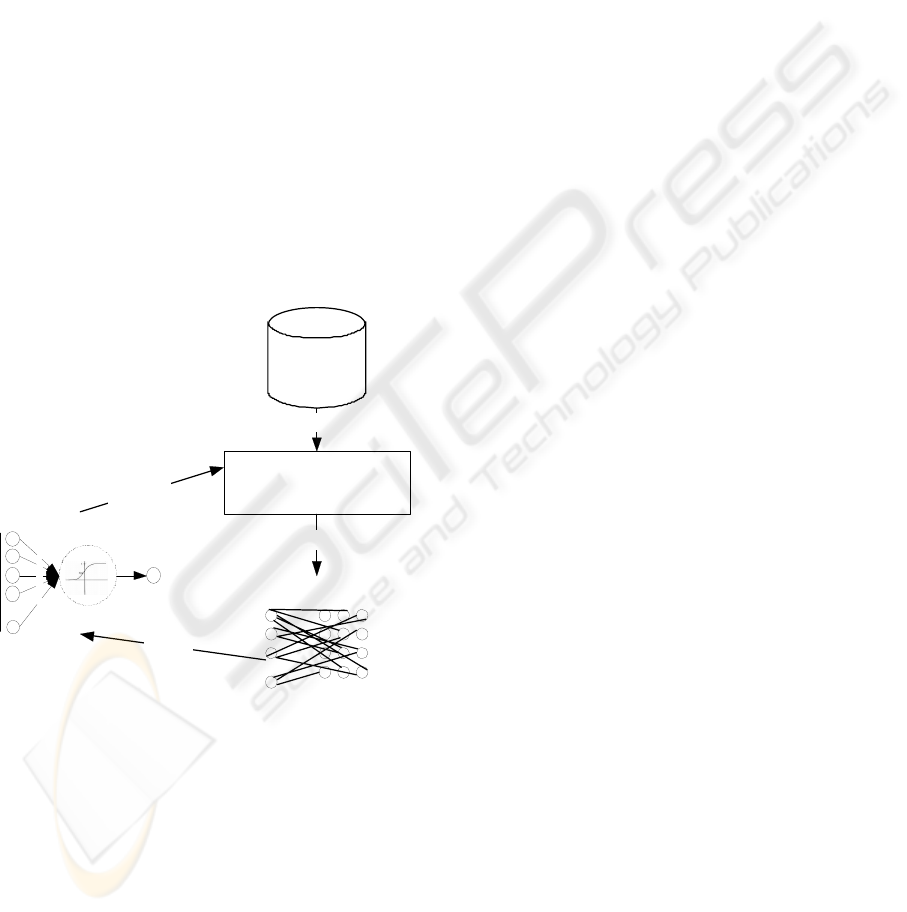
2001). Figure 1 shows the concept of the model.
Financial data
Multivariate discriminate
bankruptcy model
data
inputs / outputs
we i g h t s
corrected
we i ght s
FF ANN
x
x
x
x
x
...
w
w
w
w
w
y
SOM
Figure 1: The concept of the model.
A description of the Model concept is as follows:
1) Changes of companies financial standing are
determined as changes of the indexes of
bankruptcy model during two periods straight
(0 – negative changes, 1 – positive changes);
2) The components of discriminate bankruptcy
model are used for training of unsupervised
neural network and generating SOM. Testing
of accuracy of the SOM is executed via
calculation of corresponding nodes between
training and testing data.
3) The accuracy of forecasting is improved via
changing of weights. Feed-forward neural
network (further - FF ANN) is used in the
Model as a tool for changing of weights. The
main principle is taken from the core of ANN
theory – training an ANN the weights in the
ANN are adjusted while the ANN gives the
same outputs as in the training data. In other
words, the goal of the ANN is to get optimal
set of weights via changing them. In that way
the inputs of FF ANN would be data of testing
and the outputs would be the original
generated labels of SOM nodes. Initial
weights in the ANN are set as weights of
original bankruptcy model as described above.
4 RESULTS OF TESTING
The testing of proposed Model has been executed
using real financial dataset: companies from
NASDAQ list loaded from EDGAR PRO Online
database (EDGAR Pro Online, 2007). The basic
characteristics of the dataset and the experiments are
as follows:
Number of companies: 9364.
Dataset consists of annual financial statements
of 7 periods consecutively. The dataset was
rebuilt in the way that the string of record was
a pair of financial statement straight. After
that count of records seeks 56184 records.
Count of records was reduced to 46353 records
after elimination of missing data.
Records are divided to the two subsets – the
one for the training (TRAINDATA), the
second – for the testing (TESTDATA). On the
each iteration, the separation of data into the
training and testing data has been executed
randomly with the ratio 70:30.
Risk classes of bankruptcy are determined as
follows: if the index of selected bankruptcy
model – in this case – Zmijewski bankruptcy
model (Zmijewski, 1984) - of the second
period is less than index of the first period
then the risk class is determined as 0,
otherwise – 1.
According to Zmijewski`s model, there are 3
variables (inputs) for each of 2 periods for the
training of SOM:
o p0w2 and p1w2: Net income/Total assets
(original weight is -4.513),
o p0w3 and p1w3: Total liabilities/Total
assets (5.679)
FORECASTING OF CHANGES OF COMPANIES FINANCIAL STANDINGS ON THE BASIS OF
SELF-ORGANIZING MAPS
417
o p0w4 and p1w4: Short-term assets/ Short-
term liabilities (0.004).
The main principle of the measurement of
prediction accuracy is as follows: the labeled nodes
of trained SOM are labeled with the outputs of
testing data and the corresponding nodes of training
and testing data are calculated.
First stage of experiments is related with the
determination of the optimal structure of SOM. We
have executed the cycle of training/testing
repeatedly increasing the number of SOM nodes.
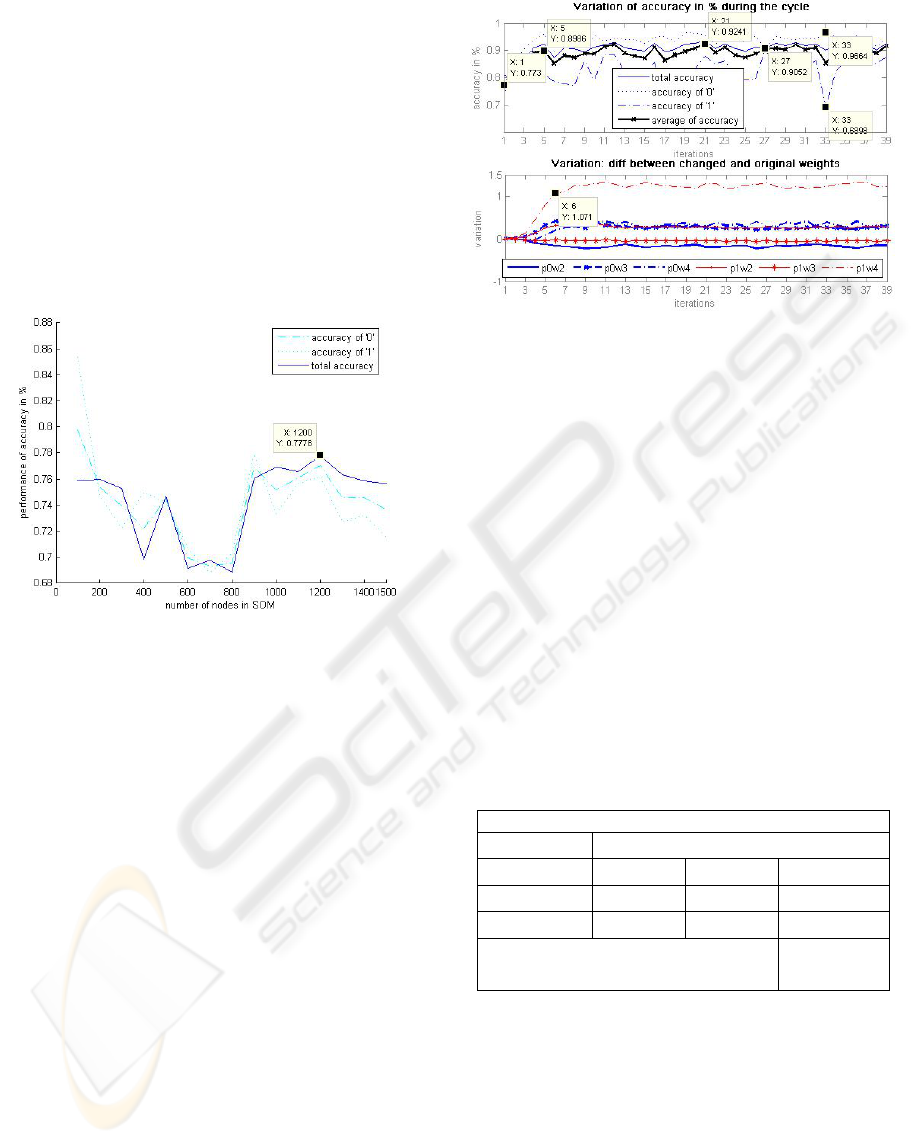
The result of prediction accuracy is showed in the
figure 2.
Figure 2: The result of prediction accuracy changing
number of nodes.
We can see that the best performance of accuracy
(~78%) is reached when the number of SOM nodes
is app. 1200.
Second stage of testing of model is to improve
the accuracy with the ANN. As a result, we get
changed weights according to the labels of generated
SOM. These weights participate in the further stages
of the cycle as described above in the section 3 and
showed above in the figure 1. When the performance
of the prediction does not rapidly change, the cycle
has stopped. After 21 iterations, we have improved
accuracy of prediction from 77.78% to 92.41% as
showed in the figure 3:
Some interesting moments are remarked during
analysis of this graph:
Accuracy of prediction increased rapidly from
77.30% to 89.86% after 5 iterations of the
cycle. Increase was influenced mainly under
changing of variable p1w4 (Short-term assets/
Short-term liabilities (0.004)) as shown in the
second graph of the figure 3 – after 6 iteration
difference between changed and original
weight (p1w4) seeks 1.071.
After further iterations of the cycle, differences
between changed and original variables do not
increase and remains at the same level.
We could observe an interesting case on the 27
iteration of the cycle when all aspects of
calculation of accuracy are nearly equal. Other
case shows conversely results: on the 31
iteration accuracy of ‘0’ reaches the best result
(96.96%) but accuracy of ‘1’ presents the
worst result (68.98%).
We consider, the optimal structure of the
weights was reached after the 21 iterations.
Average of accuracy aspects calculates to
92.41%.
Table 2 presents Confusion matrix of the results
after 21 iterations.
Table 1: Confusion matrix.
Actual vs Predicted (Confusion matrix)
Predicted (by model)
0 1 Total (units)
Actual 0 (%)
95.73 4.27 866
Actual 1 (%)
12.27 87.73 277
Total accuracy (%) 93.79
Average of all aspects of accuracy (%) 92.41
Table 2 presents comparison of importance of
ratios in discriminate bankruptcy model before and
after changing of weights:
Figure 3: Improving of accuracy.
ICEIS 2007 - International Conference on Enterprise Information Systems
418

Table 2: Weights before and after improving.
Name Weights
before
Weights after
21 iterations
no-ratio weight -4,336 -4,336
Net income/Total
assets
-4,513 -4,323
Total liabilities/Total
assets
5,679 5,412
S.-t. assets/ S.-t.
liabilities
0,004 -0,276
no-ratio weight -4,336 -4,336
Net income/Total
assets
-4,513 -4,797
Total liabilities/Total
assets
5,679 5,715
S.-t. assets/ S.-t.
liabilities
0,004 -1,290
Performance of
bankruptcy
prediction (%)
77.78 92.41
Changing of weights allows seek the highest
accuracy of bankruptcy prediction
The highest impact on results has Short-term
assets/Short-term liabilities ratio – accuracy of
prediction increases rapidly due to changing of
weight of this ratio.
5 CONCLUSIONS
The presented model for forecasting of changes
of companies financial standings on the basis
of Self-organizing maps also includes
multivariate discriminate analysis of
bankruptcy and feed-forward supervised
neural network; combination of these methods
makes original model suitable for forecasting.
The presented model works well with real
world data, the tests of the model with
presented dataset showed accuracy of
prediction with more than 92% performance.
Changing of weights with supervised neural
network allows seek the highest accuracy of
bankruptcy prediction.
Changing of the weights with supervised ANN
makes assumptions which ratios have highest
impact on prediction results.
Further works in this area would bee related with
testing of other discriminate models of bankruptcy,
experiments with other datasets, comparison with
other methods of bankruptcy prediction.
REFERENCES
Atiya, A.F., 2001. Bankruptcy prediction for credit risk
using neural networks: a survey and new results. In
IEEE Transactions on Neural Networks, Vol. 12, No.
4, pp. 929-935.
Altman, E., 1968. Financial Ratios, Discrimination
Analysis and the Prediction of Corporate Bankruptcy.
Journal of Finance. pp. 589-609.
Altman, E., 2000. Predicting Financial Distress of
Companies: Revisiting the Z-Score and ZETA®
Models. Working paper at
http://pages.stern.nyu.edu/~ealtman/Zscores.pdf .
Deboeck, G., 1998. Self-Organizing Maps Facilitate
Knowledge Discovery In Finance. Financial
Engineering News.
EDGAR Online, Inc. 1995-2006. http://pro.edgar-
online.com.
Kiviluoto, K., 1998. Predicting bankruptcies with the self-
organizing map. Neurocomputing, Vol. 21.pp.191–
201.
Kohonen, T., 1997. The Self-Organizing Map. In
Proceedings of the IEEE, 78.pp.1464-1480.
Martin-del-Prio, K., Serrano-Cinca, 1993. Self-Organizing
Neural Network: The Financial State of Spanish
Companies. In Neural Networks in Finance and
Investing. Using Artificial Intelligence to Improve
Real-World Performance. R.Trippi, E.Turban, Eds.
Probus Publishing,, pp. 341-357.
Merkevičius, E., Garšva, G., Girdzijauskas, S., 2006. A
Hybrid SOM-Altman Model for Bankruptcy
Prediction. In International Conference on
Computational Science (4), Lecture Notes in
Computer Science, 3994, pp. 364-371, ISSN 0302-
9743.
Shumway, T., 2001. Forecasting Bankruptcy More
Accurately: A Simple Hazard Model, Journal of
Business, Vol. 74, No. 1, pp. 101-124.
Vesanto, J., Himberg, J., Alhoniemi, E., Parhankangas, J.,
2000. SOM toolbox for Matlab 5, Technical report
A57, Helsinki University of Technology, Finland.
Zmijewski, M.E., 1984. Methodological Issues Related to
the Estimation of Financial Distress Prediction
Models. In Journal of Accounting Research 24
(Supplement). pp. 59-82.
FORECASTING OF CHANGES OF COMPANIES FINANCIAL STANDINGS ON THE BASIS OF
SELF-ORGANIZING MAPS
419
