
SPATIAL AUDITORY INTERFACES COMPARED TO VISUAL
INTERFACES FOR MOBILE USE IN A DRIVING TASK
Christina Dicke, Jaka Sodnik, Mark Billinghurst
Human Interface Technology Lab, Canterbury University, Christchurch, New Zealand
Sašo Tomažič
Faculty of Electrical Engineering, University of Ljubljana, Ljubljana, Slovenia
Keywords: Auditory interfaces, visual interfaces, spatial sound, mobile device, in-vehicle interaction.
Abstract: This paper reports on a user study of simulated cell phone use in a driving simulator. The main questions we
were seeking to answer were concerning the effectiveness and efficiency of the auditory interfaces in com-
parison to a standard visual interface. In our experiment we tested two audio interfaces; one with many spa-
tial audio sources and one with a single source. These were compared against a visual interface. Both of the
auditory interfaces were as effective as each other but they were not better than the visual interface. How-
ever users made more errors while using the visual interface than in the two audio conditions. So although
both types of interface were as effective as each other the visual interface was less efficient as it distracted
strongly from the primary driving task.
1 INTRODUCTION
Mobility is more and more a way of life. Some of
the tasks that we used to accomplish in the office or
at home are now being done on the go. In reaction to
the requirements of a highly mobile and informa-
tion-dense domain our handheld communication
devices are getting smaller while at the same time
their functionality dramatically expands.
Mobility requires a high degree of visual atten-
tion. Visual interfaces are therefore not ideal in that
context, as they distract the user’s attention from
primary tasks such as steering a vehicle (Wierwille,
1998; Sodhi, 2004). Moreover, mobile devices are
often put in pockets, bags or otherwise placed out of
sight. As a result, the displayed cues cannot be im-
mediately seen.
In this paper we explore the use of user centred
spatial auditory interfaces in a mobile phone envi-
ronment. Before presenting our interfaces and ex-
perimental results, in the next section we review
previous related work followed by sections on our
user study, experimental methods and results. We
conclude the paper with a discussion section and
some conclusions and future work.
1.1 Related Work
Several researchers have used a ring or dial meta-
phor for designing auditory interfaces. Crispien et.
al. (Crispien, 1996) have designed a user centred
spatial interface for navigating and selecting from a
hierarchical menu structure. Auditory objects can be
reviewed and selected by using 3D-pointing, hand
gestures or speech input.
Sawhney & Schmandt (Sawhney, 2000) created
the nomadic radio. Worn on the shoulder it uses au-
dio cues to notify the user about current events such
as incoming e-mails or calendar entries, and system
messages. Audio messages are positioned in a circle
around the listener, according to their time of arrival.
The user interacts with the nomadic radio by voice
commands and tactile input.
Some researchers have explored the combination
of spatial visual and auditory cues. Frauenberger and
Stockman (Frauenberger, 2006) positioned the user
in the middle of a virtual room with a big, horizontal
dial in front of her. Menu items were presented on
the edge of the dial facing the user while most of the
dial disappears behind a wall. The user could turn
the dial in either direction by using a gamepad con-
282
Dicke C., Sodnik J., Billinghurst M. and Tomaži
ˇ
c S. (2007).
SPATIAL AUDITORY INTERFACES COMPARED TO VISUAL INTERFACES FOR MOBILE USE IN A DRIVING TASK.
In Proceedings of the Ninth International Conference on Enterprise Information Systems - HCI, pages 282-285
DOI: 10.5220/0002370902820285
Copyright
c
SciTePress
troller. Only the item in front of the user could be
selected or activated. All items are synthesised
speech.
As can be seen from these projects, spatial audio
has been successfully applied in a number of inter-
faces, particularly using a ring metaphor. However,
there have been fewer examples of this being ap-
plied in a mobile phone setting, and no previous
work that compares audio interfaces to purely visual
conditions in a mobile phone task.
In the next section we describe our interface in
more detail and then the user study we conducted.
2 USER STUDY
We have been exploring audio interfaces that are
suitable for driving situations. In our study we were
concentrating on a comparison of task completion
times and anomalies in driver performance under
one visual and two auditory conditions. While driv-
ing in a car simulator the participants were asked to
perform five different tasks:
MSG: Write a message to a specific person
PRF: Change the active profile of the device
CAL: Make a call to a specific person
IMG: Delete an image from the device
SNG: Play a specific song
All tasks were performed with three different in-
terfaces. The interaction was based on hierarchically
ordered menus which were controlled and accessed
via a small scrolling wheel and two buttons (left and
right) attached to the steering wheel. Different items
of the menu were selected with the scrolling wheel
and the selected option was confirmed with the left
button. The right button enabled a step back or up in
the menu. In addition a small phone-like keyboard
was attached next to the steering wheel, which was
used for entering letters and text messages in the
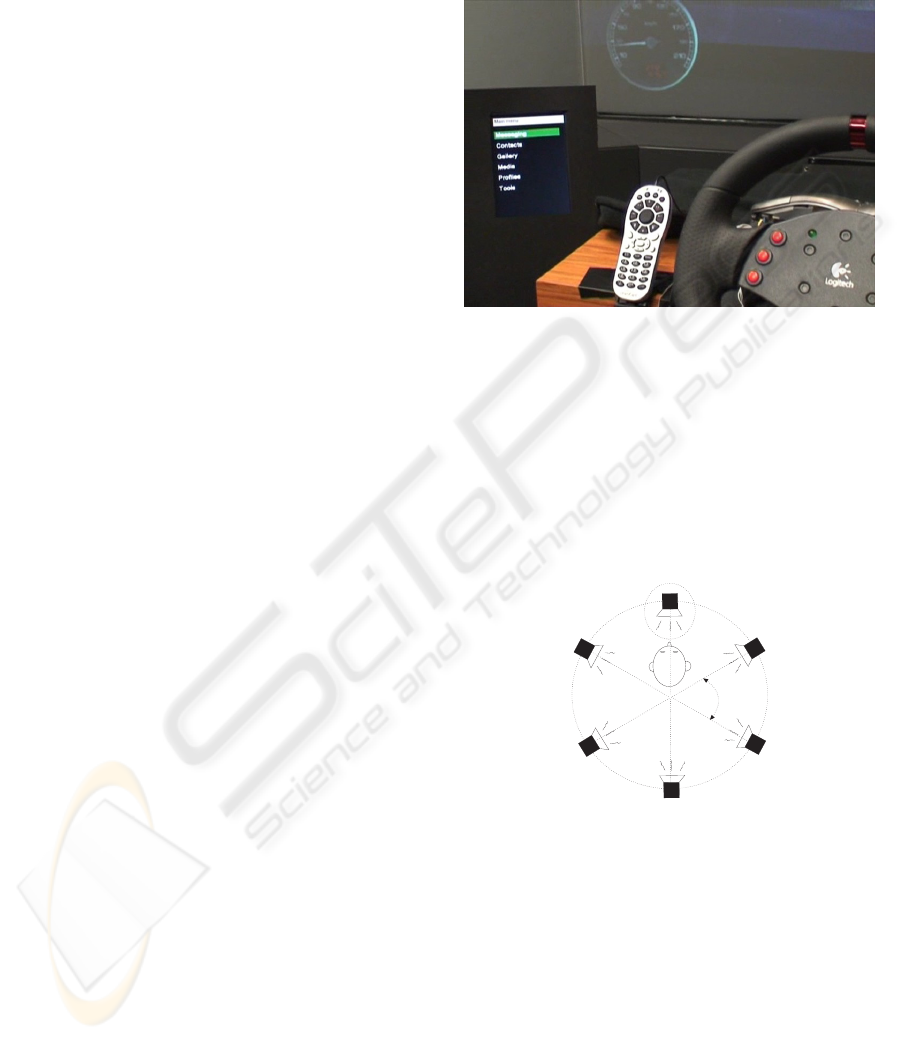
visual condition (Fig. 1).
The first interface was a visual interface (V) with
the menu shown on the small LCD screen (15cm x
12cm). The screen was positioned at about 40° to the
lower left side of the dashboard where it could easily
be seen while driving.
In the case of the auditory interfaces all items
and commands of the menu were presented with
spatial sounds and played to the driver via speakers
installed in the simulator. All sound items were spo-
ken words, recorded by a female native speaker. As
under the visual condition, participants could hear
also other co-occurring auditory events in the simu-
lator (sound of the car engine, braking, environment
sounds, etc.) As shown in Fig. 2 the menu items
were placed on a virtual circle around the user’s
head with constant differences in the angles between
them.
Figure 1: Visual interface, keyboard, and steering wheel.
In the first audio interface (A1) 1-6 sound
sources were put on one level of the menu and
played simultaneously. The selected item was the
loudest, positioned directly in front of the user. In
the second acoustic interface (A2) only one item was
played at a time. The text input was also realized
with an acoustic interface. Single letters were or-
dered to two bigger groups (vowels and consonants)
and then to smaller groups of three letters.
6
0
0
Figure 2: The virtual circle with 6 spatial sound sources.
The same menu structure was used with all three
interfaces. The items and the levels of the menu
were based upon a simplified Nokia 60-series mo-
bile phone menu.
As mentioned at the beginning of this paper, we
were interested in observing the participants operat-
ing the car (primary task) and performing different
tasks (secondary tasks) with the in-build mobile de-
vice. Our main research questions were:
Which interface will distract the user least from
the primary task?
SPATIAL AUDITORY INTERFACES COMPARED TO VISUAL INTERFACES FOR MOBILE USE IN A DRIVING
TASK
283
Which interface will cause the user to make
more errors?
Which interface will have the fastest task com-
pletion times?
3 METHODS
3.1 Participants
A total of 18 participants (8 female, 10 male) took
part in our experiment. Their average age was 27.7
years with 8.7 years of driving experiences. They all
reported normal sight and hearing.
3.2 Experiment Procedure
All participants were first asked to fill a question-
naire on their age, sex, driving experiences, hearing
and visual disabilities. Then they were given a five
minute test drive, followed by performing all five
tasks under the first condition, taking a 15 minute
break and then repeating all tasks under the next
condition and so forth. The tasks were read aloud to
the participants and they were asked to start after a
request to do so. After each condition participants
were asked to complete a questionnaire on user sat-
isfaction (QUIS, 2006).
In order to eliminate learning effects, three ran-
domly assigned groups of six participants were
formed. Each group performed the tasks with the
interfaces in a different sequential order. The study
was filmed for later analysis.
4 RESULTS
4.1 Task Completion Times
The task completion time was measured between the
initial command “Please start now.” and the final
notification “Task completed”.
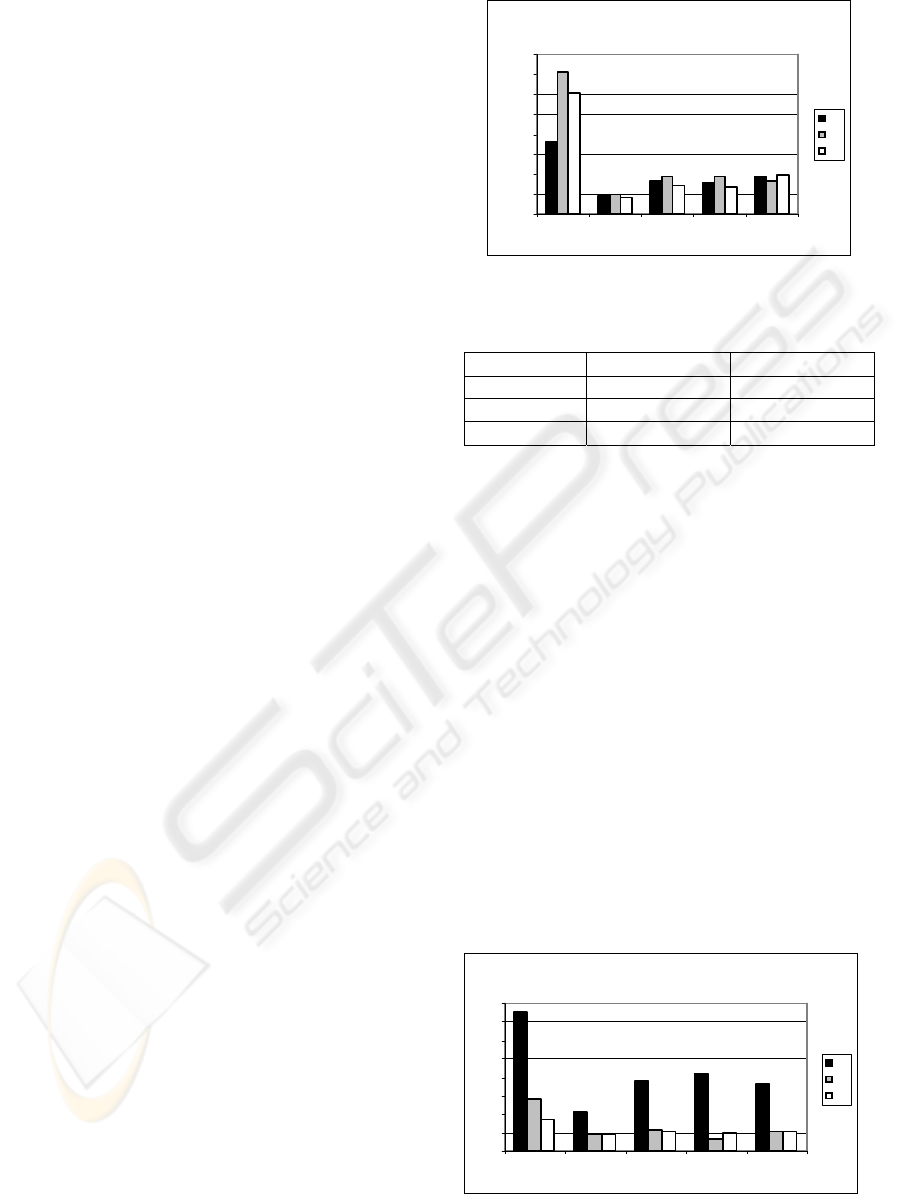
Fig. 3 shows the average task completion times for
the five tasks in the three different interface condi-
tions. There is a significant difference for the mes-
sage composition task (MSG). The visual menu with
mobile phone keyboard proved to be the fastest way
to write a txt message. A within subject ANOVA
test for MSG task resulted gave: F
MSG
(2, 51) = 8.52,
MSE = 2796.52, p = 0.001. A post-hoc Bonferroni
test with a .05 limit on familywise error rate con-
firmed the significant difference between visual (V)
and auditory menus (A1 and A2) but no significant
difference between A1 and A2. The mean values of
MSG tasks are shown in Table 1.
T ask compl et i on ti mes i n seconds
0,00
20,00
40,00
60,00
80,00
100,00
120,00
140,00
160,00
MSG PRF CAL IM G SNG
V
A1
A2
Figure 3: Mean task completion times of all tasks.
Table 1: Mean task completion times (M) for MSG task.
Interface M Std. Dev.
V 71.22 32.24
A1 120.50 63.54
A2 142.22 57.55
We believe that the reason for this lies in the fact
that most of the participants were skilled in writing
messages with mobile phone keyboards. The acous-
tic interface for entering text messages turned out to
be too slow and inappropriate for such conditions.
The ANOVA tests for the other four tasks
showed no significant difference:
F
PRF
(2, 51) = 0.358, MSE = 125.07, p = 0.701;
F
CAL
(2, 50) = 0.550, MSE = 637.06, p = 0.581;
F
IMG
(2, 51) = 1.213, MSE = 435.67, p = 0.306;
F
SNG
(2, 50) = 0.211, MSE = 609.17, p = 0.811.
These results did not confirm our expectations that
the auditory menus should support faster task com-
pletion times.
4.2 Driving Performance
The driving performance was evaluated on the basis
of video recordings. The participants’ driving was
observed and penalty points were assigned accord-
ing to the error severity.
Dr i vi ng penal i ty poi nts
0,00
1,00
2,00
3,00
4,00
5,00
6,00
7,00
8,00
MSG PRF CAL IMG SNG
V
A1
A2
Figure 4: Mean driving penalty points of all tasks.
ICEIS 2007 - International Conference on Enterprise Information Systems
284
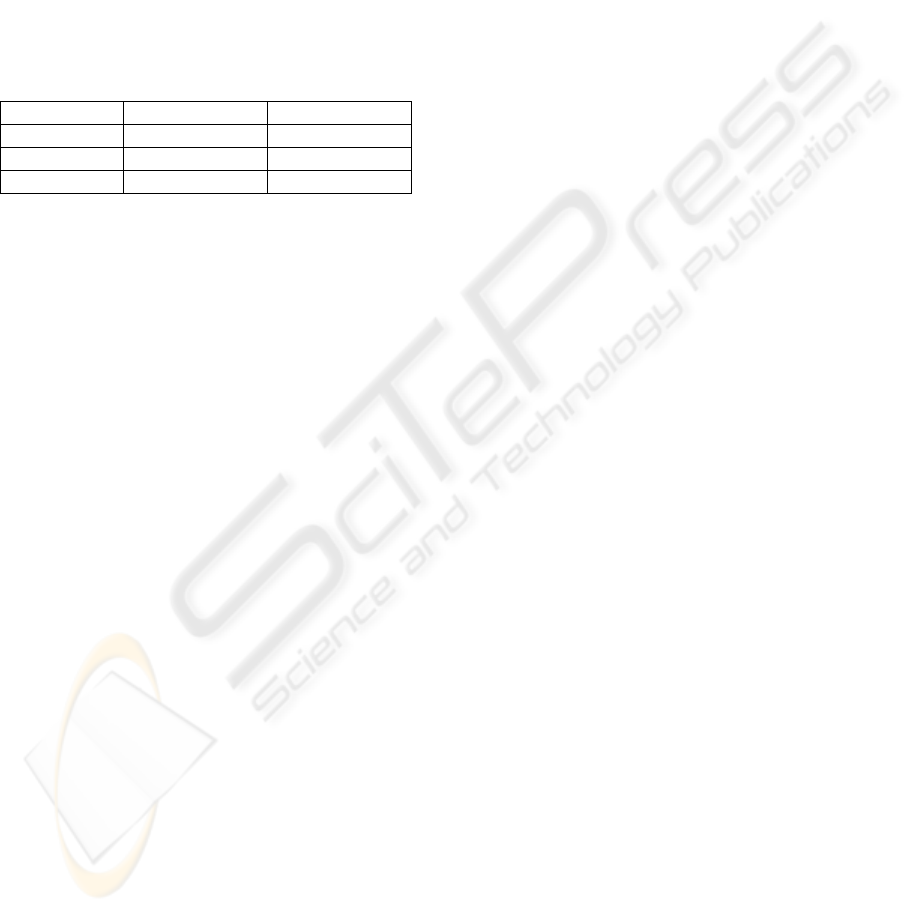
The penalty points for each driver were summed
and the average penalty points for all users were
calculated for each task (see Fig. 4).
The number of penalty points is much greater in
the case of visual menu condition for all tasks. This
was confirmed with the ANOVA test: F(2, 202) =
29.169, MSE = 8.480, p < 0.001. A post-hoc Bon-
ferroni test with a .05 limit on familywise error rate
confirmed the significant difference between the
results of visual and auditory interfaces, but no dif-
ference between the individual auditory interfaces.
The mean values are shown in Table 2.
Table 2: Mean driving penalty points (M) of all tasks.
Interface M SD
V 4.27 4.95
A1 1.14 1.42
A2 0.93 1.18
In this case we can confirm our expectation that
participants were more focussed on driving when
completing tasks with auditory interfaces than with
the visual interface.
5 DISCUSSION
We did not find any significant difference in task
completion times apart from text message comple-
tion. Although all participants reported previous
experiences with hierarchical visual interfaces they
did not complete tasks much faster than with the
new auditory interfaces. The much longer task com-
pletion time with messaging is a consequence of the
use of different and unequally efficient interaction
devices (mobile phone keyboard and auditory menu
for writing messages). We believe the similar task
completion times in the other three cases are encour-
aging since the entirely new auditory interfaces were
compared to a type of well known and widely used
visual interface.
Our high expectations on the significant im-
provement of driving performance were justified.
The users drove the car much more safely when op-
erating the auditory interfaces. The results of the
modified QUIS showed that participants found per-
forming the tasks with the visual menu difficult,
dangerous and unpleasant. On the other hand par-
ticipants found it more difficult to orientate within
the menu structure in the auditory conditions.
Most of the participants reported a learning ef-
fect, especially with the auditory interfaces.
In the experiment we also studied the signifi-
cance of the presence of more simultaneous sounds
in the interface. Participants reported the A2 (one
sound played) option to be more effective. As used
in A1 all additional sounds at different virtual posi-
tions were perceived as a distracting background
noise than as additional information.
6 CONCLUSION
The auditory interfaces used in this study offer an
effective alternative to classic visual interfaces, cur-
rently used in cars. Although an auditory menu
could sometimes be confusing to use it offers sig-
nificant improvement in the driver behaviour. The
possibly complicated menu structure could be
learned fast and consequentially be as effective as
the commonly used visual menu.
As this was only a pilot study further research
has to be done on comparing auditory interfaces to
more novel visual interfaces, for example a head-up
display or to a speech interface. A more realistic and
demanding driving scenario should be tested such as
a major street in an urban environment, or driving
under different weather conditions.
REFERENCES
Crispien, K. Fellbaum, K., Savidis, A., Stephanidis, C.,
1996. A 3D-Auditory Environment for Hierarchical
Navigation in Non-visual Interaction. In: Proc. of the
International Conference on Audio Display (ICAD
1996), Palo Alto, USA, 18-21.
Frauenberger, C. and Stockman, T., 2006. Patterns in
Auditory Menu Design. Proceedings of the Interna-
tional Conference on Auditory Display (ICAD2006),
London, UK.
QUIS, 2006. About the QUIS, version 7.0. Retrieved No-
vember 11, 2006, from http://www.lap.umd.edu/quis/.
Sawhney, N. and Schmandt, C., 2000. Nomadic radio:
speech & audio interaction for contextual messaging
in nomadic environments. ACM TOCHI 7,3., 353-383.
Sodhi, M., Cohern, J. Kirschenbaum, S., 2004. Multi-
Modal Vehicle Display Design and Analysis. A study
conducted in cooperation with U.S. DOT, University
of Rhode Island.
Wierwille, W. and Tijerina, L.. 1998. Vision in Vehicles
VI. In: A. Gale, I. Brown, C. Haslegrave and S. Taylor
[Eds.] Modelling the relationship between driver in-
vehicle visual demands and accident occurrence. El-
sevier, 233-244.
SPATIAL AUDITORY INTERFACES COMPARED TO VISUAL INTERFACES FOR MOBILE USE IN A DRIVING
TASK
285
