
GU METRIC
A New Feature Selection Algorithm for Text Categorization
Gulden Uchyigit and Keith Clark
Department of Computing, Imperial College, London SW7 2BZ
Keywords:
Feature Selection, Text Categorization, Machine Learning.
Abstract:
To improve scalability of text categorization and reduce over-fitting, it is desirable to reduce the number of
words used for categorisiation. Further, it is desirable to achieve such a goal automatically without sacrificing
the categorization accuracy. Such techniques are known as automatic feature selection methods. Typically
this is done in the way that each word is assigned a weight (using a word scoring metric) and the top scoring
words are then used to describe a document collection. There are several word scoring metrics which have
been employed in literature. In this paper we present a novel feature selection method called the GU metric.
The details of comparative evaluation of all the other methods are given. The results show that the GU metric
outperforms some of the other well known feature selection methods.
1 INTRODUCTION
Text categorization is the problem of automatically
assigning predefined categories to text documents. A
major difficulty with text categorization problems is
the large number of words in the collection. Even for
a medium sized document collection there can be tens
or thousands of different words in the collection. This
is too high for many learning algorithms.
2 FEATURE SELECTION
METHODS
In this section we present the existing word scoring
metrics we have evaluated in this study. These are:
Chi-Squared Statistic, Odds Ratio, Mutual Informa-
tion, Information Gain, Word Frequency, NGL coef-
ficient and GSS coefficient. All of these metrics are
popular in text categorisation. We also include two
other metrics which have been employed in gene se-
lection but to our knowledge they have not so far been
employed in text categorisation. These are the Fisher
criterion and BSS/WSS ratio. Finally we present our
novel word scoring metric, the GU metric.
Throughout this section we will use the notation
c
w
,
c
w
, c
w
, c
w
, respectively, to denote: the number of
documents in category c that contain the word w; the
number of documents in category c (the complement
of c) that contain word w; the number of documents
in category c that do not contain word w; the number
of documents in category
c that do not contain word
w; n
c
is the total number of documents in c; n
c
is the
number of documents in c and N is the total number
of documents in the collection (i.e. n
c
+ n
c
).
Chi-Squared Statistic. The Chi-Squared (χ
2
)
statistic was originally used in statistical analysis to
measure how the results of an observation differ (i.e.
are independent) from the results expected according
to an initial hypothesis (higher values indicate higher
independence). In the context of text categorisation
χ
2
statistic is used to measure how independent
a word (w) and a category (c) are ((Y.Yang and
Pedersen, 1997), (Caropresso et al., 2001), (Galavotti
et al., 2000)).
χ
2
has a value of zero if w and c are indepen-
dent. A word which occurs frequently in many
categories will have a low χ
2
value indicating high
independence between w and c. In contrast, a word
which appears frequently in few categories will
have a high χ
2
value (i.e. high dependence). In
our experiments we compute χ
2
using the equation
below: χ
2
w
=
N×(c
w
c
w
−c
w
c
w
)
2
(c
w
+c
w
)×(c
w
+c
w
)×(c
w
+c
w
)×(c
w
+c
w
)
NGL Coefficient. Ng et al. ((Ng et al., 1997))
propose the Correlation Coefficient (CC), a variant
of χ
2
metric where CC
2
= χ
2
, to be used in text
categorisation. In our experiments we compute
the NGL Coefficient using the equation below:
399
Uchyigit G. and Clark K. (2007).
GU METRIC - A New Feature Selection Algorithm for Text Categorization.
In Proceedings of the Ninth International Conference on Enterprise Information Systems - AIDSS, pages 399-402
DOI: 10.5220/0002365503990402
Copyright
c
SciTePress

CC
w
=
√
N(c
w
c
w
−c
w
c
w
)
√
(c
w
+c
w
)×(c
w
+c
w
)×(c
w
+c
w
)×(c
w
+c
w
)
GSS Coefficient. Galavotti et al. (Galavotti et al.,
2000) propose a simplified χ
2
(sχ
2
)statistic. In our ex-
periments we compute the GSS coefficient using the
equation below:
sχ
2
= (c
w
c
w
−c
w
c
w
)
Mutual Information. Mutual Information (MI) is a
criterion commonly used in statistical language mod-
elling of word associations and related applications
(Church and Hanks, 1998), (Fano, 1961). MI has
been used in text categorisation by ((Y.Yang and Ped-
ersen, 1997), (Mladenic, 1998), (Ruiz and Srinivasan,
2002), (Dumais et al., 1998), (Dumais and Chen,
2000), (Joachims, 1997)).
In our experiments we compute the Mutual Infor-
mation criterion using:
MI
w
=
c
w
×N
(c
w
+ c
w
) ×(c
w
+
c
w
)
Information Gain. Information Gain (IG) is a
frequently employed word scoring metric in machine
learning((Quinlan, 1993), (Mitchel, 1997)). Informa-
tion gain measures the number of bits of information
obtained for category prediction by knowing the
presence or absence of a word in a document. In text
categorisation, IG has been employed in ((Y.Yang
and Pedersen, 1997), (Pazzani and Billsus, 1997),
(Caropresso et al., 2001), (Mladenic, 1998), (Forman,
2003)).
Odds Ratio. Odds Ratio (OR) was proposed by
(Rijsbergen, 1979) for selecting words for relevance
feedback. It has been used by ((Mladenic et al.,
2004),(Ruiz and Srinivasan, 2002), (Zheng and Sri-
hari, 2003), (Caropresso et al., 2001)) for selecting
words in text categorization. The odds ratio takes val-
ues between zero and infinity. One (’1’) is the neutral
value and means that there is no difference between
the groups compared; close to zero or infinity means
a large difference; larger than one means that the rel-
evant set has a larger proportion of documents which
contain the word, than the irrelevant set; smaller than
one means that the opposite is true. In our experi-
ments we compute the odds ratio using:
OR
w
=
c
w
c
w
c
w
c
w
Fisher criterion. The Fisher criterion (Bishop 1995)
which has been employed for feature selection in the
context of gene categorisation. The Fisher criterion
is a classical measure to assess the degree of separa-
tion between two classes. We use this measure in text
categorisation to determine the degree of separation
of documents which contain word w within the sets
c and
c. In our experiments we compute the Fisher
criterion using:
f
w
=
(c
µ
w
−
c
µ
w
)
2
(c
σ
w
)
2
+ (c
σ
w
)
2
where c
µ
w
is the average number of documents which
contain the word w and belong to the c, σ
w
is the
standard deviation of documents in c that contain the
word w.
BSS/WSS criterion. This is the feature (gene)
selection criterion used in Dutoit et al (Dutoit et al.,
2002), namely they use this criterion to determine
the ratio of genes between group to within group
sum of squares. This criterion has never been
employed in the context of text categorisation. We
make use of this criterion for determining the ratio
of words occurring between categories to within
categories. In our experiments we compute this cri-
terion using:
BSS(w)
WSS(w)
=
∑
N
j=1
∑
C∈{c,
c}
I(d
j
=C)(µ
C,w
−µ
w
)
2
∑
N
j=1
∑
C∈{c,
c}
I(d
j
=C)(x
w, j
−µ
C,w
)
2
where I(d
j
= C) = 1 if article j belongs to category
C (where C ∈ c,
c) and zero otherwise, µ
w
is the
average occurrence of word w across all documents,
µ
c,w
denotes the average occurrence of word w
across all documents belonging to category c. x
w, j
, is
the frequency of occurrence of word w in document j.
GU Metric. In statistical analysis, significance test-
ing (z), measures the differences between two propor-
tions. A high z score indicates a significant differ-
ence between the two proportions. This is the moti-
vation behind the algorithm. We use the z score to
measure the difference in proportions between doc-
uments which contain word w and belong to c and
those that contain w and belong to
c. The larger the z
score the greater the difference in proportions so the
word is better as a discriminator of the two classes.
We evaluated variations of the raw z score as a feature
selection metric. The GU metric actually uses the fol-
lowing formula:
GU
w
= |z|·
c
w
·n
c
n
c
·c
w
Here z is computed as follows:
z =
c
w
−
c
w
r
p(1−p)
1
n
c
+
1
n
c
where
p =
c
w
+ c
w
n
c
+ n
c
w
t
= |z|·
c
w
·n
c
n
c
·c
w
ICEIS 2007 - International Conference on Enterprise Information Systems
400
3 EXPERIMENTAL SETTING
In our experiments we chose to use the 20 News-
groups data set (Lang, 1995). This data set is widely
used as benchmark in text categorisation. For our ex-
periments we train one naive Bayes classifier for each
newsgroup. The task was to learn whether a certain
news article should be classified as a member of that
newsgroup.
We compute the naive Bayesian probabilis-
tic classifier using the equation below: c
∗
=
argmaxP(C|d) = argmaxP(C)
∏
n
k=1
P(w
k
|C)
N(w
k
,d
C
)
where, C ∈ {c,
c} and N(w
k
, d
C
) is the number of oc-
currences of word w
k
in news article d
C
.
We use the Laplacian prior to compute the
word probabilities P(w
k
|C) (see equation below).
P(w
k
|C) =
1+
∑
d
i∈C
N(w
k
,d
i
)
|V|+
∑
|V|
r=1
∑
d
i
∈C
N(w
k
,d
i
)
where K is the total
number of distinct words in the training set.
Each experiment to measure the performance of
the individual word scoring metrics was repeated 100
times, each time increasing the feature set size (n) by
10. The same training set and test set was used to
evaluate each individual word scoring metric.
4 RESULTS
The results presented below report the average preci-
sion, recall, F
1
and F
2
measures for each category pre-
diction. They are calculated using a set of correctly
classified documents. Reported results are averaged
over 5 repetitions using a different training and test
set each time.
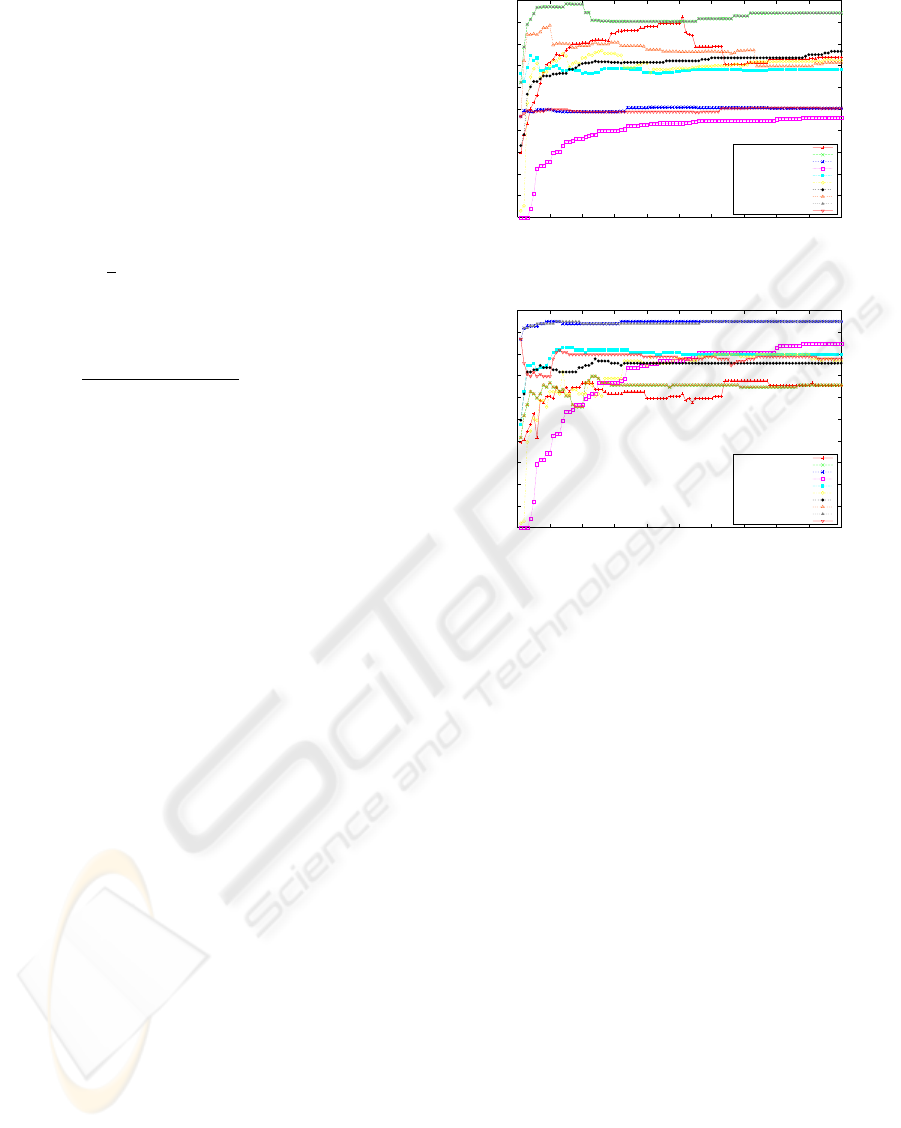
Figure 1shows the precision vs. number of fea-
tures results. It can be seen that χ
2
and NGL metrics
show similar results and they show the best precision
scores. Next best is the GU metric. The worst pre-
cision scores is Mutual Information. Figure 2 shows
the recall vs. number of features. Here, the best per-
formers are IG and GSS coefficient, next is the GU
metric.
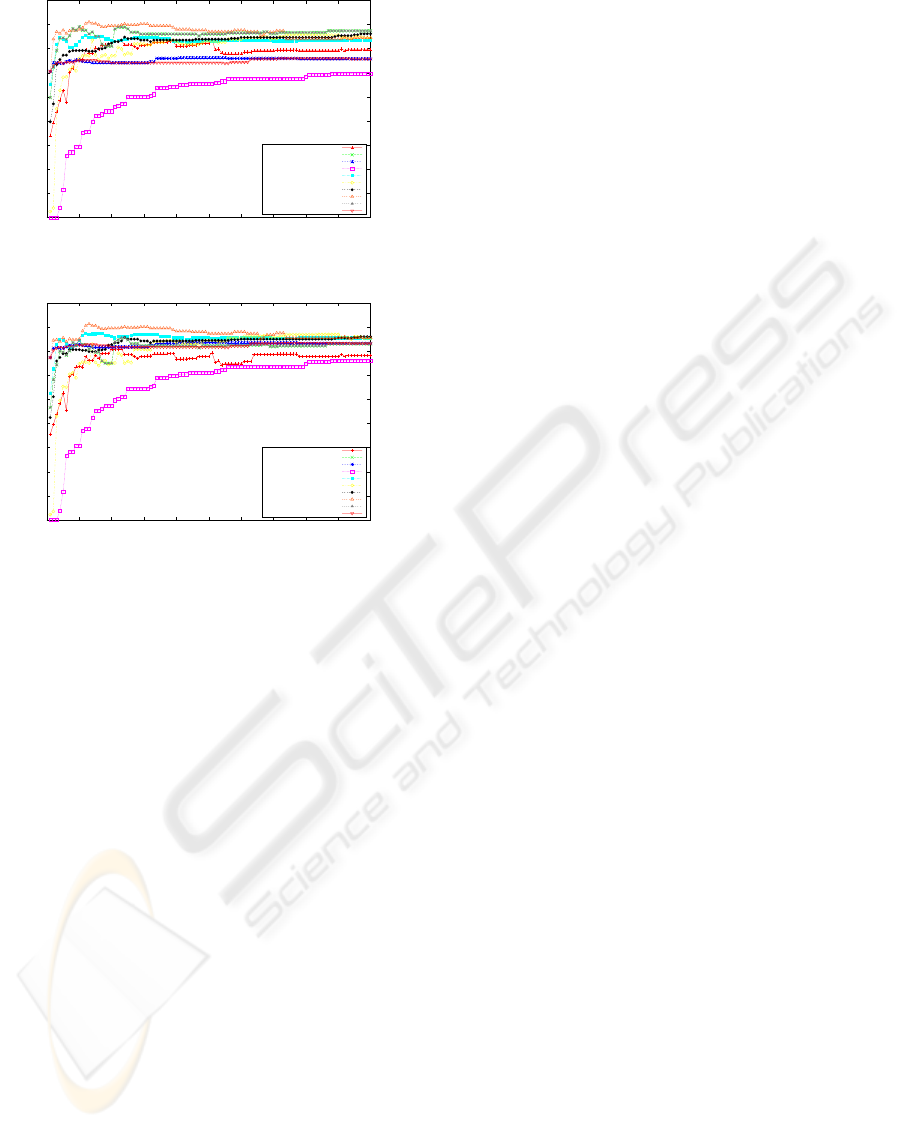
Figure 3 shows the F1 scores vs. number of fea-
tures. Here, the GU metric shows the best perfor-
mance. Figure 4 shows the F2 scores vs. number of
features, these results show similar results to the F1
measures.
0
0.1
0.2
0.3
0.4
0.5
0.6
0.7
0.8
0.9
1
0 100 200 300 400 500 600 700 800 900 1000
Precision
Feature Set Size
Feature Selection Experiments
Odds Ratio
Chi-Squared
Information Gain
Mutual Information
Term Frequncy
Fisher Crierion
BSS/WSS
GU metric
NGL
GSS
Figure 1: Precision of the Feature Selection Experiments.
0
0.1
0.2
0.3
0.4
0.5
0.6
0.7
0.8
0.9
1
0 100 200 300 400 500 600 700 800 900 1000
Recall
Feature Set Size
Feature Selection Experiments
Odds Ratio
Chi-Squared
Information Gain
Mutual Information
Term Frequncy
Fisher Crierion
BSS/WSS
NGL
GSS
GU metric
Figure 2: Recall of the Feature Selection Experiments.
5 SUMMARY AND
CONCLUSIONS
We have presented a comparative study of existing
feature selection methods and some new ones using
Lang’s 20 Newsgroups dataset, to measure the perfor-
mance of each feature scoring methods in text classi-
fication.
Our experimental results are not in contradic-
tion with previously reported results of Mladenic
(Mladenic et al., 2004), they report that Odds Ratio
had better F
1
scores than Information Gain and Mu-
tual Information. Our results also show that Odds Ra-
tio had better F
1
results than Information Gain and
Mutual Information. The overall worst performer has
been obtained by Mutual Information method which
is also what Mladenic and Yang and Pedersen report.
In our experiments we do not report a difference
in performance between the NGL coefficient and the
χ
2
. Also, GSS coefficient does not perform better
than NGL and χ
2
. In our study we can conclude that
the best performers using the Naive Bayesian classi-
fier are χ
2
, GU metric, BSS/WSS, NGL. However,
the best F
1
and F
2
scores were obtained using the GU
metric.
The results which we have obtained from this
GU METRIC - A New Feature Selection Algorithm for Text Categorization
401
0
0.1
0.2
0.3
0.4
0.5
0.6
0.7
0.8
0.9
0 100 200 300 400 500 600 700 800 900 1000
F1-measure
Feature Set Size
Feature Selection Experiments
Odds Ratio
Chi-Squared
Information Gain
Mutual Information
Term Frequncy
Fisher Crierion
BSS/WSS
GU Metric
NGL
GSS
Figure 3: F1 measure of the Feature Selection Experiments.
0
0.1
0.2
0.3
0.4
0.5
0.6
0.7
0.8
0.9
0 100 200 300 400 500 600 700 800 900 1000
F2-measure
Feature Set Size
Feature Selection Experiments
Odds Ratio
Chi-Squared
Information Gain
Mutual Information
Term Frequncy
Fisher Crierion
BSS/WSS
GU metric
NGL
GSS
Figure 4: F2 measures of the Feature Selection Experi-
ments.
study is promising. The GU metric performs as
well as some of the more common feature selection
methods such as χ
2
and outperforms some other well
known feature selection methods such as OddsRatio
and InformationGain. Our experimental evaluations
are still ongoing. In particular we are continuing ex-
perimental evaluations on different domains and using
different classifiers.
REFERENCES
Caropresso, M., Matwin, S., and Sebastiani, F. (2001). A
learner independent evaluation of usefulness of sta-
tistical phrases for automated text categroization. In
Chin, A., editor, Text Databases and Document Man-
agement: Theory and Practice, pages 78 – 102. idea
group publishing.
Church, K. W. and Hanks, P. (1998). Word association
norms, mutual information and leixicography. In ACL
27, pages 76–83, Vancouver Canada.
Dumais, S. T. and Chen, H. (2000). Hierarchical classifica-
tion of web content. In SIGIR’.
Dumais, S. T., Platt, J., Heckerman, D., and Sahami, M.
(1998). Inductive learning algorithms and representa-
tions for text. In ACM-CIKM, pages 148–155.
Dutoit, S., Yang, H., Callow, J., and Speed, P. (2002). Sta-
tistical methods for identifying differently expressed
genes in replicated cdna microarray experiments.
Journal of American Statistic Association, (97):77–
86.
Fano, R. (1961). Transmission of Information. MIT Press,
Cambridge, MA.
Forman, G. (2003). An extensive empirical study of feature
selection metrics for text classification. The Journal
of Machine Learning Research, 3.
Galavotti, L., Sebastiani, F., and Simi, M. (2000). Experi-
ments on the use of feature selection and negative ev-
idence in automated text categorization. In Borbinha,
J. L. and Baker, T., editors, Proceedings of ECDL-00,
4th European Conference on Research and Advanced
Technology for Digital Libraries, pages 59–68, Lis-
bon, PT. Springer Verlag, Heidelberg, DE.
Joachims, T. (1997). A probabilistic analysis of the rocchio
algorithm with tfidf for text categorization. In ICML,
pages 143–151.
Lang, K. (1995). Newsweeder: Learning to filter netnews.
In 12th International Conference on Machine Learn-
ing.
Mitchel, T. M. (1997). Machine Learning. McGraw-Hill
International.
Mladenic, D. (1998). Machine Learning on non-
homogeneous, distributed text data. PhD thesis, Uni-
versity of Ljubljana,Slovenia.
Mladenic, D., Brank, J., Grobelnik, M., and Milic-Frayling,
N. (2004). Feature selection using linear classifier
weights: Interaction with classification models. In
ACM, editor, SIGIR’04.
Ng, H., Goh, W., and Low, K. (1997). Feature selection,
perceptron learning, and a usability case study for
text categorization. In SIGIR ’97: Proceedings of the
20th Annual International ACM SIGIR Conference on
Research and Development in Information Retrieval,
July 27-31, 1997, Philadelphia, PA, USA, pages 67–
73. ACM.
Pazzani, M. and Billsus, D. (1997). Learning and revis-
ing user profiles: The identification of interesting web
sites. Machine Learning, 27:313–331.
Quinlan, J. R. (1993). C4.5: Programs for Machine Learn-
ing. Morgan Kaufmann.
Rijsbergen, V. (1979). Information Retrieval. Butterworths,
London 2nd edition.
Ruiz, M. E. and Srinivasan, P. (2002). Hierarchical text cat-
egorization using neural networks. Information Re-
trieval, 5(1):87–118.
Y.Yang and Pedersen, J. (1997). A comparative study on
feature selection in text categorization. In Fisher,
D. H., editor, Proceedings of ICML-97, 14th Interna-
tional Conference on Machine Learning, pages 412–
420, Nashville, US. Morgan Kaufmann Publishers,
San Francisco, US.
Zheng, Z. and Srihari, R. (2003). Optimally combining pos-
itive and negative features for text categorization. In
ICML-KDD’2003 Workshop: Learning from Imbal-
anced Data Sets II, Washington, DC.
ICEIS 2007 - International Conference on Enterprise Information Systems
402
