
PLAYING MOBILE GAMES: CONSUMER PERCEPTIONS
AN EMPIRICAL STUDY
Krassie Petrova.and Haixia Qu
Auckland Unoversoty of Technology, School of Computing and Mathematical Sciences
Keywords: Mobile gaming, mobile commerce, mobile business, survey, adoption, New Zealand.
Abstract: The paper presents the design and the results of a project studying the adoption of mobile gaming (playing
mobile games) in the New Zealand youth market. An adoption model extending TAM (Technology
Adoption Model) was used, with intention to use as the dependent variable. Data were gathered from a
sample group consisting of undergraduate university students. It was found that adopters of mobile gaming
were likely to be male as well as female, and also that the group surveyed exhibited a behaviour towards
relatively high spending on mobile entertainment (in proportion to income). Perceived expressiveness was
found to be the most significant influential factor affecting intention to use, while perceived enjoyment was
found to be motivated by perceived ease of use. Recommendations regarding developing and offering
mobile games are also included.
1 INTRODUCTION
It has been suggested in the literature that mobile
gaming is a mobile service which will become a
significant revenues stream builder for mobile
business (Anckar & D’Incau 2002; Kleijnen, de
Ruyter & Wetzels 2003; Shchiglik et al. 2004).
Supporting this market research forecasts predict that
worldwide mobile gaming revenues will “increase
six-fold within the next four to five years (Armitt
2005). According to Paavilainen (2003, p. 94) the
expected adopters of mobile gaming are young
people who already use regularly mobile devices.
Based on the potential of this market segment, the
compound annual growth rate of mobile gaming
revenue worldwide is predicted to fall anywhere
between 31% and 50% in 2008 (Wisniewski &
Morton 2005). In New Zealand, where the cellular
market is expected to increase from NZ$1.4 billion
in 2003 to NZ$2.0 billion in 2008 and the number of
subscribers to grow from 2.8 to 3.5 million
respectively (Buckley 2004), it may be expected that
the mobile gaming market will also show growth.
Mobile gaming falls into the broader category of
interactive mobile entertainment (Moore & Rutter
2004). A number of potential drivers of the adoption
process of mobile entertainment services have been
identified in prior research (Baldi & Thaung 2002;
Pedersen, Methlie & Thorbljornsen 2002; Barnes &
Huff 2003; Pagani & Schipani 2003; Moore & Rutter
2004; Carlsson et al. 2005; Pedersen 2005). A point
had been made in several studies that the socio-
cultural and economic contexts have been a
significant factor in the development of mobile
gaming markets in countries such as Japan and Korea
where customers had been predisposed to adopt and
use both small and mobile electronic accessories as a
result of the leading edge electronic industry cultures
(Barnes & Huff 2003; Dhaliwal 2003; Wisniewski &
Morton 2005).
The study presented here aims to contribute to the
understanding the preferences and perceptions of the
young people in New Zealand about mobile gaming,
and whether there are any specific factors or
motivators related to the its adoption.
The paper is organized as follows: The next
section defines mobile gaming. Section three
introduces the initial research model. Section four
presents a summary of the survey results and
discusses some of the most important findings. In the
last section the study limitations are identified and
directions for further research are suggested.
209
Petrova K. and Qu H. (2007).
PLAYING MOBILE GAMES: CONSUMER PERCEPTIONS AN EMPIRICAL STUDY.
In Proceedings of the Second International Conference on e-Business, pages 209-214
DOI: 10.5220/0002115202090214
Copyright
c
SciTePress
2 MOBILE GAMING
Mobile gaming is an example of a mobile commerce
(mCommerce) application which is provided through
a paid for service. Typically the mobile network
operator to whose network the player subscribes
collects the revenue; the revenue stream may be also
shared with other business entities involved – such as
mobile network infrastructure providers, mobile
content developers and publishers, portal
aggregators, and retailers (Petrova & Qu 2006).
There is a variety of mobile game types
depending on the level of complexity and on the
device platform used - from Short Message Service
(SMS)-based games to real-time games involving
multiple players which are played on sophisticated
smart phones. Some more advanced games might
require a persistent network connection and a
dedicated game server, and might have location
sensitive features (Moore & Rutter 2004; Maintland
et al, 2005).
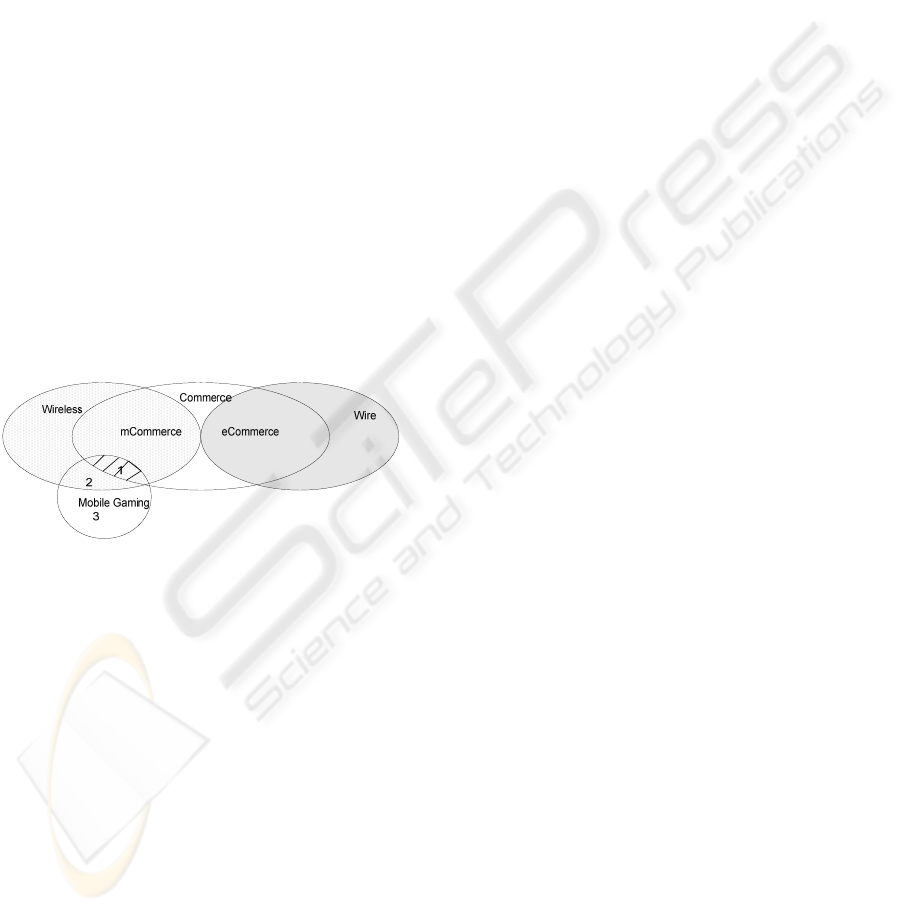
Three currently prevalent mobile gaming
deployment scenarios are currently prevalent. Their
industry positioning is shown in Figure 1, adapted
from Wong and Hiew (2005).
Figure 1: Mobile gaming positioning. Adapted from Wong
and Hiew (2005).
In Segment 1, gamers play real-time 2D or 3D
games on a 3G mobile phone and interact with
groups of gamers via network carriers. Revenue is
collected by the mobile services provider (for
downloading a game) and by network carriers (for
transferring data). The segment covers multiplayer
games, including also WAP (Wireless Application
Protocol)- and SMS- based games.
In Segment 2 gamers play without connecting to
a carrier network – rather they create a private ad hoc
Bluetooth network or play individually. They pay
once only – for downloading the game.
In Segment 3 (which lies entirely outside both the
wireless environment and mCommerce), games still
are played on mobile devices, but these need not be
connected to a network as the games are embedded
in the devices at the time of manufacturing (Ollila et
al. 2003). Subsequently there is no usage cost and no
direct financial benefit to other business entities
except to manufacturers and device vendors.
3 RESEARCH MODEL
Mobile gaming may involve both monetary and non-
monetary transactions across the mCommerce value
chain model (Barnes 2003). A number of value chain
actors (network operators, game designers and
distributors, mobile service providers) are involved
in providing a mobile gaming service; studying
consumer (user) readiness to accept such a service
may help identify potential market segments and
provide useful insights into factors motivating
consumers’ acceptance. Information systems and
technology acceptance models (e.g. Davies 1989;
Venkatesh 2003) have been adapted and used in a
number of studies of mobile business services
adoption (Aarnio et al., 2002; Hung, Ku & Chang
2003; Pagani & Schipani 2003; Nysveen, Pedersen &
Thornbjornsen 2005; Yang 2005; Wu & Wang
2005), in empirical studies on mobile gaming
adoption (Kleijnen, de Ruyter & Wetzels 2003;
Yoon, Ha, & Choi 2005) and in studies on online
gaming (Hsu & Lu 2004).
The constructs of the Technology Acceptance
Model (TAM) and of its extensions found in the
reviewed literature on mobile services and
specifically on mobile gaming were identified and
used to build a research model and to formulate the
hypotheses of the study. The research model of the
study is shown in Figure 2. “Intention to use’ (IU) is
a dependent variable; ‘actual use’ (a dependent
variable in TAM), was dropped from the model
based on results which confirm the positive
relationship between intention to use and actual use
(Bhattacherjee 2000; Wu & Wang 2005). A similar
approach was followed in other related research
(Pagani & Schipani 2003; Nysveen, Pedersen &
Thornbjornsen 2005).
3.1 Perceived Usefulness and Perceived
Ease of Use
Mobile gaming is an activity well suited to ‘filling
gaps’ in time when travelling or waiting (Anchar &
D’Incau 2002); therefore it may be perceived as a
useful value added service. Mobile device or context
limitations (small screen, playing a game in a public
place) may also be of significance.
ICE-B 2007 - International Conference on e-Business
210
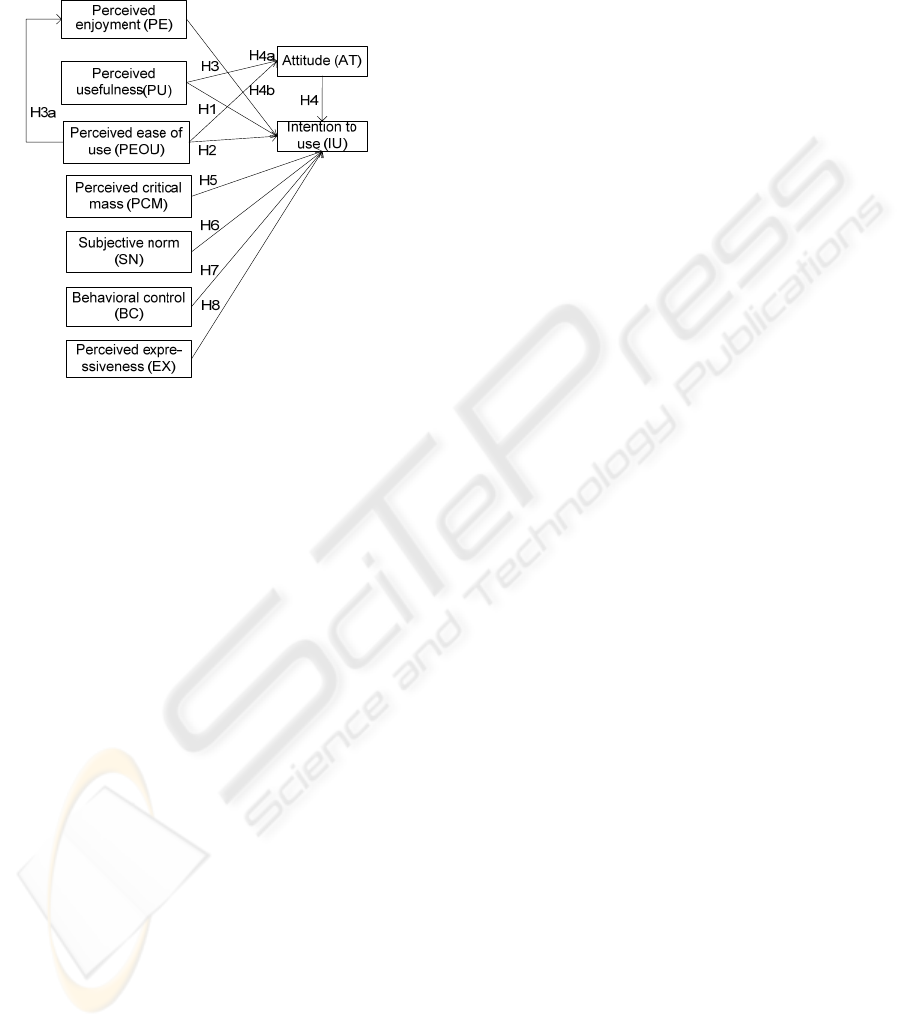
H1: Perceived usefulness (PU) has a positive
effect on IU.
H2: Perceived ease of use (PEOU) has a positive
effect on IU.
Figure 2: Proposed research model.
3.2 Perceived Enjoyment
As mobile gaming is a leisure-oriented service it may
be expected that the enjoyment and fun-seeking
aspects will be important. A positive relationship
between ‘computer playfulness’ and ‘perceived ease
of use’ was found in Venkatesh (2000). While a
challenging game evoke positive feelings, a game
which is technically difficult to play may be
perceived as not enjoyable (Moore & Rutter 2004).
H3: Perceived enjoyment (PE) has a positive
effect on IU.
H3a: PEOU has a positive effect on PE.
3.3 Attitude
Attitude was dropped in the extended TAM proposed
by Venkatesh and Davies (2000). As prior research
of mobile services adoption indicates that
consumers’ attitude may influence intention to use
(Hung, Ku & Chang 2003; Nysveen, Pedersen &
Thorbjornsen 2005; Yoon, Ha & Choi, 2005), the
construct was included.
H4: Attitude (AT) has a positive effect on IU.
H4a: AT has a positive mediating effect between
PU and IU.
H4b: AT has a positive mediating effect between
PEOU and IU.
3.4 Perceived Critical Mass
This construct refers to the notion that consumers
may use a service because other people around them
are using it (i.e. people would follow others’
behaviour). A positive relationship between critical
mass and intention to use was reported in a wireless
services context (Kleijnen, de Ruyter & Wetzels
2003) and in online gaming (Hsu & Lu 2004)..
H5: Perceived critical mass (PCM) has a positive
effect on IU.
3.5 Subjective Norm
This construct refers to the notion that an
individual’s perceptions depend on a reference
group’s opinion as playing a mobile game may give
a sense of commonness, leading to being ‘approved’
by the members of the reference group (Kleijnen, de
Ruyter & Wetzels 2003). Similar constructs have
been used in (Hsu & Lu 2003; Nysveen, Pedersen &
Thornbjornsen 2005).
H6: Subjective norm (SN) has a positive effect
on IU.
3.6 Behavioural Control
Behavioural control includes external factors related
to the quality of the service and the revenue model of
the supplier. Adoption of mCommerce may be
constrained by perceived security and privacy risks,
and by service cost (Kleijnen, de Ruyter & Wetzels
2004; Wu & Wang 2005).
H7: Behavioural control (BC) factors (security
and cost) have a negative effect on IU.
3.7 Perceived Expressiveness
A mobile phone and the related services contribute to
the owner’s identity, status and public image (Baldi
& Thaung 2003; Barnes & Huff 2003; Funk, 2004,
p.27). The effect of ‘perceived expressiveness’ is
stronger in the mobile gaming context compared to
other mobile services (Nysveen, Pedersen &
Thornbjornsen 2005).
H8: Perceived expressiveness (EX) has a positive
effect on IU.
4 SURVEY AND RESULTS
A form of purposive sampling known as ‘judgment
sampling’ (Sekaran, 2003, p. 277) was used and a
PLAYING MOBILE GAMES: CONSUMER PERCEPTIONS
211
sample of university students was selected. It
included both New Zealand and international
students. The survey instrument was based on items
used in the reviewed literature. The anonymous
questionnaire contained between 3 and 6 questions
per construct, with answers to be provided on a
Likert scale from 1 (strongly disagree) to 5 (strongly
agree). The questionnaire was structured into three
parts, with all respondents answering the general
questions in the first part. Part 2 (29 questions) and
part 3 (15 questions) were aimed at respondents who
were actual users (‘mobile gamers’) or were ‘non-
mobile gamers’, respectively.
The sample consisted of 96 respondents, with
44.8% males, 54.2% females, and one not specified.
The majority (96.9%) were young adults between 15
and 35 years of age. They fitted well with the mobile
generation group (Aarnio et al. 2002; Paavilainen,
2003, p. 93; Shchiglik et al. 2004; Pedersen 2005;
Wong & Hiew 2005).
The sample data showed that mobile phone
penetration had reached a saturation point: Only one
respondent did not have a mobile phone. Most
respondents (80.1%) owned a less than two years old
device. A very small number of respondents (less
than 10%) had a 3G cell phone. A significant number
of the respondents (72.9%) owned a model with a
colour display but only 75.2% of them were mobile
gamers. However owing a relatively high-end mobile
device as a pre-condition to engaging in mobile
gaming was met by the sample: 57.3% of the
respondents had WAP-enabled devices and 45.7%
had Java-enabled devices. Significantly, respondents
ranked mobile entertainment as one of the top mobile
services available –second after SMS.
A relatively low ‘mobile phone expenditure’
group dominates the sample (with average monthly
expenditure less than NZ$60). This is consistent with
the high proportion of prepaid customers in New
Zealand reported by Buckley (2004) and may
indicate that in New Zealand, those who spend more
are likely to be using the technology for business
rather than for personal use.
In-phone games dominated the actual users
segment (51.09%), followed by downloadable games
(27.17%) . This result aligns with reported results
(Schiglick et al. 2004; Wisniewski & Morton 2005).
The mobile gamer sub-sample consisted of both
female and male consumers (55.7% and 44.3%
respectively). The possibility of an association
between ‘gender’ and ‘playing’ in the sample was
tested and rejected (Pearson’s Chi-Square .103 with a
significance level of .749), meaning that both males
and females were likely to be mobile gaming
adopters.
A small number of respondents (5.7%, males
only) preferred strategy games and the same number
(females only) preferred card games. Action and
sports games were preferred by females and males
(12.9% and 21.4%) with more females than males
expressing the preference (the respective ratios were
2:1 and 3:2).
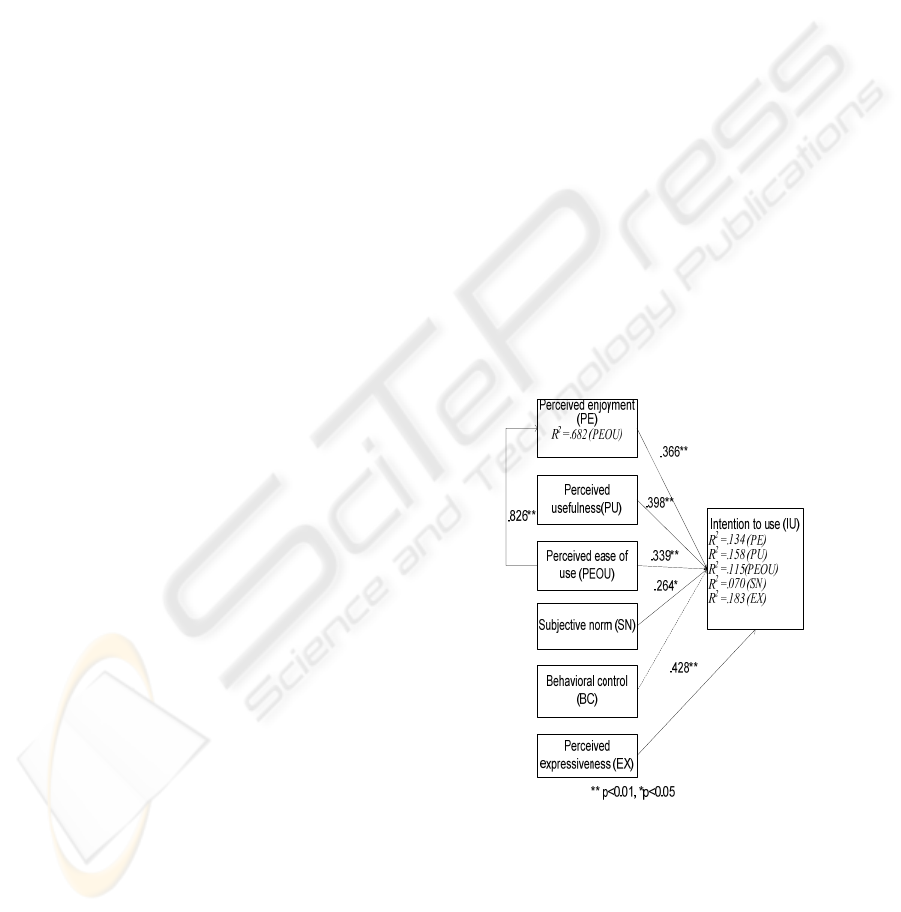
Consistent with the proposed research model
further analysis was performed on the mobile game
sub-sample only (70 respondents). The construct
validity of the instrument was evaluated by
computing convergent and discriminate validity
performing a principal component analysis with a
Varimax rotation. Seven factors (PE, PU, PEOU, SN,
BC, EX, IU) met the criteria used in the study (Hair
et al., 1998, p. 90, p.111). As a result un the revised
model two constructs (PCM and AT) were dropped.
Using SPSS12.0 a correlation bivariate procedure
was run including the factors retained in the revised
model. Using Pearson’s correlation (‘r’) as a measure
of strength it was found that IU had a significantly
strong relationship with SN (r=.264, sig. =.030),
PEOU (r=.339, sig.=.005), PE (r = .366, sig.=.002),
PU (r =.398, sig.=.001), and EX (r=.428, sig.=.000).
Figure 3: Survey results.
The correlation between PE and PEOU was
strong with r=.826 and sig.=.000.
The hypotheses were tested using regression
analysis in SPSS 12.0 and considered supported
when path coefficients (Beta) were significant at the
.05 and .01 levels of the p-value (Figure 3).
ICE-B 2007 - International Conference on e-Business
212

Hypotheses H1, H2, H3, H3a, H6 and H8 were
supported while H7 was not. Hypotheses H4, H4a
H4b and H5 could not be tested.
5 DISCUSSION & CONCLUSION
The results indicated hat the target groups for mobile
gaming adoption among the ‘mobile generation’
include a high percentage of owners of relatively
advanced mobile phone devices, both female and
male, with different mobile game type preferences.
Current usage was found to be predominantly of
embedded games - not a significant revenue
generator.
As also suggested in Repo et al. (2006) mobile
service providers may take advantage of the high
level of ownership of devices with advanced
functions by offering and actively promoting services
to meet the preferences of ‘Segment 2’ consumers -
such as new and updated downloadable games which
are relatively cheap but are still revenue builders
(though not as profitable as interactive games). The
rate of adoption of mobile gaming services may
increase if consumers were made more
knowledgeable and aware about them, to capture low
‘mobile budget’ consumers willing to spend on
mobile entertainment. Mobile game developers and
distributors may explore the gender differences in the
youth market and develop games and game
distribution strategies differentiating between the
preferences of two gender segments.
‘Perceived expressiveness’ was found to be most
significant factor influencing adopter’s behaviour
and should be included as a construct in further
studies. ‘Perceived ease of use’ is a significant
motivator directly and indirectly through ‘perceived
enjoyment’. The relationship between these two
constructs needs to be studied in more depth. Cost
and security were not found to be significant factors
influencing adoption which may be context
dependent.
The study has a number of limitations: it was not
longitudinal and socio-economic factors were not
explored. Considering separately mobile gamers and
non-mobile gamers reduced the size of the sample
and imposed constraints on the subsequent factor
analysis; the initial research model had to be revised.
d testing of four of the initial eleven hypotheses
could not be tested.
ACKNOWLEDGEMENTS
The paper is based in part on an unpublished
Master’s dissertation (Qu, 2006). The authors would
like to thank the reviewers for the helpful critique.
REFERENCES
Aarnio, A., Enkenberg, A., Heikkila, J. and Hirvola, S.,
2002. Adoption and use of mobile services. Empirical
evidence form a Finnish study. In Proceedings of the
35
th
Hawaii International Conference on System
Sciences, Hawaii.
Anckar, B. and D'Incau, D., 2002. Value-added services in
mobile commerce: An analytical framework and
empirical findings from a national consumer survey. In
Proceedings of the 35
th
Hawaii International
Conference on System Sciences, pp. 1087-1096.
Baldi, S. and Thaung, H. P.-P., 2002. The entertaining way
to m-commerce: Japan's approach to the mobile
internet - a model for Europe? Electronic Markets,
12(1), 6-13.
Barnes, S. J. and Huff, S. L., 2003. Rising sun: iMode and
the wireless Internet. Communications of the ACM,
46(11), 79-84.
Bhattacherjee, B., 2000. Acceptance of e-commerce
services: The case of electronic brokerages. IEEE
Transactions on Systems, Man, and Cybernetics-Part
A: Systems and Humans, 30(4), 411-420.
Buckley, A., 2004. Prepaid subscribers curb New Zealand
cellular services market growth. Retrieved March 20,
2006 from http://www.idcresearch.co.nz.PressRelease_
Mobile0404.pdf.
Carlsson, C., Hyvonen, K., Repo, P. and Walden, P., 2005.
Asynchronous adoption patterns of mobile services. In
Proceedings of the 38
th
Annual Hawaii International
Conference on Systems Sciences, p.189a.
Davis, F. D., 1989. Perceived usefulness, perceived ease of
use, and user acceptance of information technology.
MIS Quarterly, 13(3), 319-340.
Dhaliwal, J., 2003. Analyst speak: Why is East Asia so
into mobile gaming? New Media Age, 15 (Nov 13,
2003).
Funk, J. L., 2003. Mobile disruption: The technologies and
applications driving the mobile Internet. New Jersey:
John Wiley & Sons
Hair, J. F. Junior, Anderson, R. E., Tatham, L. and Black,
W. C., 1998. Multivariate Data Analysis, 5
th
edition,
New Jersey. Prentice Hall, Inc.
Hsu, C. and Lu, H., 2004. Why do people play on-line
games? An extended TAM with social influences and
flow experience. Information and Management 41,
853-868.
Hung, S, Ku, C. and Chang, C., 2003. Critical factors of
WAP services adoption: An empirical study.
Electronic Commerce Research and Applications, 2,
42-60.
PLAYING MOBILE GAMES: CONSUMER PERCEPTIONS
213

Kleijnen, M., D., de Ruyter, K. and Wetzels, M., 2003.
Factors influencing the adoption of mobile gaming
services. In B. E. Mennecke & T. J. Strader (Eds.),
Mobile commerce technology, theory, and
applications, pp. 202-217. Hershey, PA. Idea Group
Publishing.
Kleijnen, M., D., de Ruyter, K. and Wetzels, M., 2004.
Consumer adoption of wireless services: Discovering
the rules, while playing the game. Journal of
Interactive Marketing, 18(2), 51-61.
Lin, J., Chan, H. C. and Jin, Y., 2004. Instant messaging
acceptance and use among college students. In
Proceedings of the Eighth Pacific Asia Conference on
Information Systems, Shanghai, China.
Maintland, C. F., van de Kar, E. A .M., de Montalvo, U.
W. and Bouwman, H., 2005. Mobile information and
entertainment services; business models and service
networks. International Journal of Management and
Decision Making 6(1), 47-64.
Armitt, C., 2005. Mobile games revenues set to grow five-
fold. New Media Age, 11 (May 26, 2005),
Moore, K. and Rutter, J., 2004. Understanding consumers’
understanding of mobile entertainment. In K. Moore &
J. Rutter (Eds.) Mobile Entertainment: User-Centred
Perspectives, pp. 49-65. Manchester, UK. ESRC CRIC
(University of Manchester).
Nysveen, H., Pedersen, P. E. and Thorbjornsen, H., 2005.
Intention to use mobile services: Antecedents and
Cross-service comparisons. Journal of the Academy of
Marketing Science, 33(3), 330-346.
Ollila, M., Kronzell, M., Bakos, N. and Weisner, F. (2003).
Mobile entertainment business. European Commission,
User-Friendly Information Society. Retrieved
December 23, 2005, from http://www.mgain.org/mgain
-wp5-D542-delivered3.pdf.
Paavilainen, J., 2003. Mobile games: Creating business
with Nokia N-gage. Indianapolis. New Riders.
Pagani, M. and Schipani, D., 2003. Motivations and
barriers to the adoption of 3G mobile multimedia
services: An end user perspective in the Italian market.
In M. Khosrow-Pour (Ed.), Proceedings of the 2003
Information Resources Management Association
International Conference (IRMA’03), pp. 957-960.
Pedersen, P. E., Methlie, L. B. and Thorbjornsen, H., 2002.
Understanding mobile commerce end-user adoption: a
triangulation perspective and suggestions for an
exploratory service evaluation framework. In
Proceedings of the 35
th
Annual Hawaii International
Conference on System Sciences, pp. 1079-1086.
Pedersen, P. E., 2005. Adoption of mobile Internet
services: An exploratory study of mobile commerce
early adopters. Journal of Organizational Computing
and Electronic Commerce, 15(3), 203-221.
Petrova, K. and Qu. H., 2006. Mobile gaming: A reference
model and critical success factors. In M. Khosrow-
Pour (Ed.), Emerging Trends and Challenges in
Information Technology Management, pp. 228-231.
Hershey, PA. Idea Group Publishing.
Qu, H., 2006.Exploring Consumer Attitudes to Mobile
Gaming in New Zealand. Auckland University of
Technology.
Repo, P., Hyvonen, K., Pantzar, M. and Timonen, P., 2006.
Inventing use for a novel mobile service. International
Journal of Technology and Human Interaction, 2(2),
49-62.
Sekaran, U., 2003. Research Methods for Business: A Skill
Building Approach. Danvers. Wiley & Sons, Inc.
Shchiglik, C., Barnes, S., Scornavacca, E. and Tate, M.,
2004. Mobile entertainment service in New Zealand;
An examination of consumer perceptions towards
games delivered via the wireless application protocol.
International Journal of Services and Standards, 1(2),
155-171.
Venkatesh, V., 2000. Determinants of perceived ease of
use: Integrating perceived behavioural control,
computer anxiety and enjoyment into the Technology
Acceptance model. Information Systems Research,
11(4), 342-365.
Venkatesh, V. and Davis, F. D., 2000. A theoretical
extension of the Technology Acceptance Model: Four
longitudinal field studies. Management Science, 46(2),
186-204.
Venkatesh, V., Morris, M. G., Davis, G. B. and Davis , F.
D., 2003. User acceptance of information technology:
Towards a unified view. MIS Quarterly, 27(3), 425-
478.
Wisniewski, D. and Morton, D., 2005. 2005 Mobile games
white paper. Retrieved February 20, 2006 from
http://igda.org/online/IGDA_Mobile_White_PAper_20
05.pdf.
Wong, C. and Hiew, P. L., 2005. Mobile entertainment:
Model development and cross services study. In
Proceedings of ICSSSM '05, pp. 1355-1359.
Wu, J.-H. and Wang, S.-C., 2005. What drives mobile
commerce? An empirical evaluation of the revised
technology Acceptance model. Information &
Management, 42, 719-729.
Yang, K. C. C., 2005. Exploring factors affecting the
adoption of mobile commerce in Singapore. Telematics
and Informatics 22, 257-277.
Yoon, Y. S., Ha, I. S. and Choi, M.-K., 2005. Nature of
potential mobile gamers' behaviour under future
wireless mobile environment. In Proceedings of the 7
th
International Conference on Advanced Communication
Technology (ICALT’05), pp. 551-558.
ICE-B 2007 - International Conference on e-Business
214
