
MULTIDIMENSIONAL WAVELET ANALYSIS FOR
RECOGNITION OF LESIONS IN COLPOSCOPY TEST
Diana Ivone Tapia López, Aldrin Barreto Flores and Leopoldo Altamirano Robles
National Institute of Astrophysics, Optics and Electronics, Computer Science Department
Luis Enrique Erro No.1, Sta. María Tonantzintla, 72840, Puebla, México
Keywords: Cervical cancer, temporal texture analysis, wavelet analysis, wavelet-aggregated signal.
Abstract: Cervical cancer is an important worldwide disease due the high rate of incidence in the population.
Colposcopy is one of the diagnostic tests employed in recognition of lesions, which performs a visual
examination of the cervix based on temporal reaction of the surface stained with acetic acid. It is proposed
in this paper to evaluate the temporal texture changes produced by the acetic acid based on the concept of
the wavelet-aggregated signal in order to identify lesions. An aggregated signal is a scalar signal providing
maximum information on the most general variations present in all the processes analyzed and at the same
time suppressing components that are characteristic of individual processes. Texture metrics based on
spatial information are used in order to analyze temporally the acetic acid response and deduce appropriate
signatures. Later, temporal information is analyzed using multidimensional wavelet analysis for
identification of lesions.
1 INTRODUCTION
An important disease that has been widely studied is
the cervical cancer due the high rate of incidence in
the population. Actually, a group of tests have been
developed for the early diagnosis of this illness: Pap
smear, colposcopy and biopsy (Claude, Winzenrieth,
et al, 2002). Colposcopy test evaluates several
reactions appearing after the application of acetic
acid on the surface of the cervix; it makes a visual
analysis of the cervix surface using a large
microscope called colposcope, finding lesions and
observing their severity (Parker, Karins and
O’Connor, 1998). The acid causes the appearance or
emphasis of lesions visually analyzed by the
physician (Burghardt, 1991). Several computer
vision based solutions have been proposed in order
to automatically identify abnormalities in the cervix
using colposcopy images.
An image analysis using pixel intensity is
presented in (Pogue, Myceck and Harper, 2000),
evaluating the Red-Green-Blue (RGB) channels,
spatial frequencies, fractal dimension and Euler
number, which was the best criteria for the
discrimination of cervical neoplasia using a small set
of cases. Different computer vision techniques have
been also used in other works, for example, color
and texture analysis using pixel co-ocurrence matrix
for segmentation of lesions (Claude, Pouletaut, et al,
2001). A colposcopy images classification using
edge features is presented in (Claude, Winzenrieth,
et al, 2002). Authors generate a digital signature of 6
contour patterns and analyze the power spectrum of
each one, in order to detect discriminatory patterns
that are learned in a neural network. Related works,
which analyze images to discriminate colposcopy
lesions lack of generality because they focus in a
single feature of the lesion, reporting a better
characterization of the lesions the use of temporal
information, as is described in (Parker, Karins and
O’Connor, 1998), (Tumer, Ramanujam et al, 1998)
and (Parker, Mooradian, et al, 2002).
In this paper we propose to evaluate the temporal
texture changes produced by the acetic acid based on
the concept of the wavelet-aggregated signal in order
to identify lesions in cervix region. Spatial texture
metrics are used for analysis of temporal changes on
cervix surface. These metrics are based in gray level
information between pixels and they are suitable for
characterization of lesions in cervix. We show how
temporal information of texture analysis can be used
to perform multidimensional wavelet analysis, in
350
Ivone Tapia López D., Barreto Flores A. and Altamirano Robles L. (2007).
MULTIDIMENSIONAL WAVELET ANALYSIS FOR RECOGNITION OF LESIONS IN COLPOSCOPY TEST.
In Proceedings of the Second International Conference on Computer Vision Theory and Applications - IFP/IA, pages 350-355
Copyright
c
SciTePress
order to identify those regions in cervix where
lesions are presented.
The rest of this paper is organized as follows:
next section presents a briefly description of texture
metrics and temporal information obtained; in
section 3 wavelet-aggregated signal is briefly
described; image sequences used in this work are
presented in section 4; experimental results are
described in section 5; finally, some conclusions and
directions for future work are presented in section 6.
2 TEMPORAL TEXTURE
METRICS
2.1 Texture Metrics
The analysis of temporal changes on the cervix
surface has been performed using the metrics
presented in (Baeg, Kehtarnavaz, 2002) to classify
breast mass. These metrics are well correlated with
colposcopy exam because features of lesions are
similar to the breast mass (Tapia, Barreto and
Altamirano, 2006).
Denseness measure is obtained by calculating the
distribution of gray values, maxima/minima local
points in rows and columns. The idea is to produce a
binary image that represents the distribution of
maxima and minima gray values in a region of
interest. A pixel is considered local column
maximum and it is assigned a zero value in the
binary image if its value in the original image is
greater than its neighbors, in other case it is assigned
one. The equation (1) shows the calculation of local
column maximum and (2) local row maximum.
g(x-1,y) < g(x,y) > g(x+1,y) .
(1)
g(x,y-1) < g(x,y) > g(x,y+1) .
(2)
Architectural distortion is associated with new
details revealed by the acetic acid and it can be
quantified using a gradient based measure like in
(Baeg, Kehtarnavaz, 2002), because new details
appears like small points, mosaics and edges. The
equation used for its calculation is presented in (3).
The values N
1
and N
2
correspond to the number of
pixels in which gradient were different to zero. This
process uses just those pixels that are presenting
changes in the image. The 3 value in the equation is
used in order to increase the presence of changes
presented in the image. A small change cannot
increase so much while a high change can be more
noticeable.
2
),(
3
1
),(
3
),(),1(),()1,(
N
yxgyxg
N
yxgyxg
I
yxyx
∑
∑
∀∀
−+
+
−+
=
.
(3)
A detail description of the metrics can be
consulted in (Baeg, Kehtarnavaz, 2002).
2.2 Temporal Texture Analysis
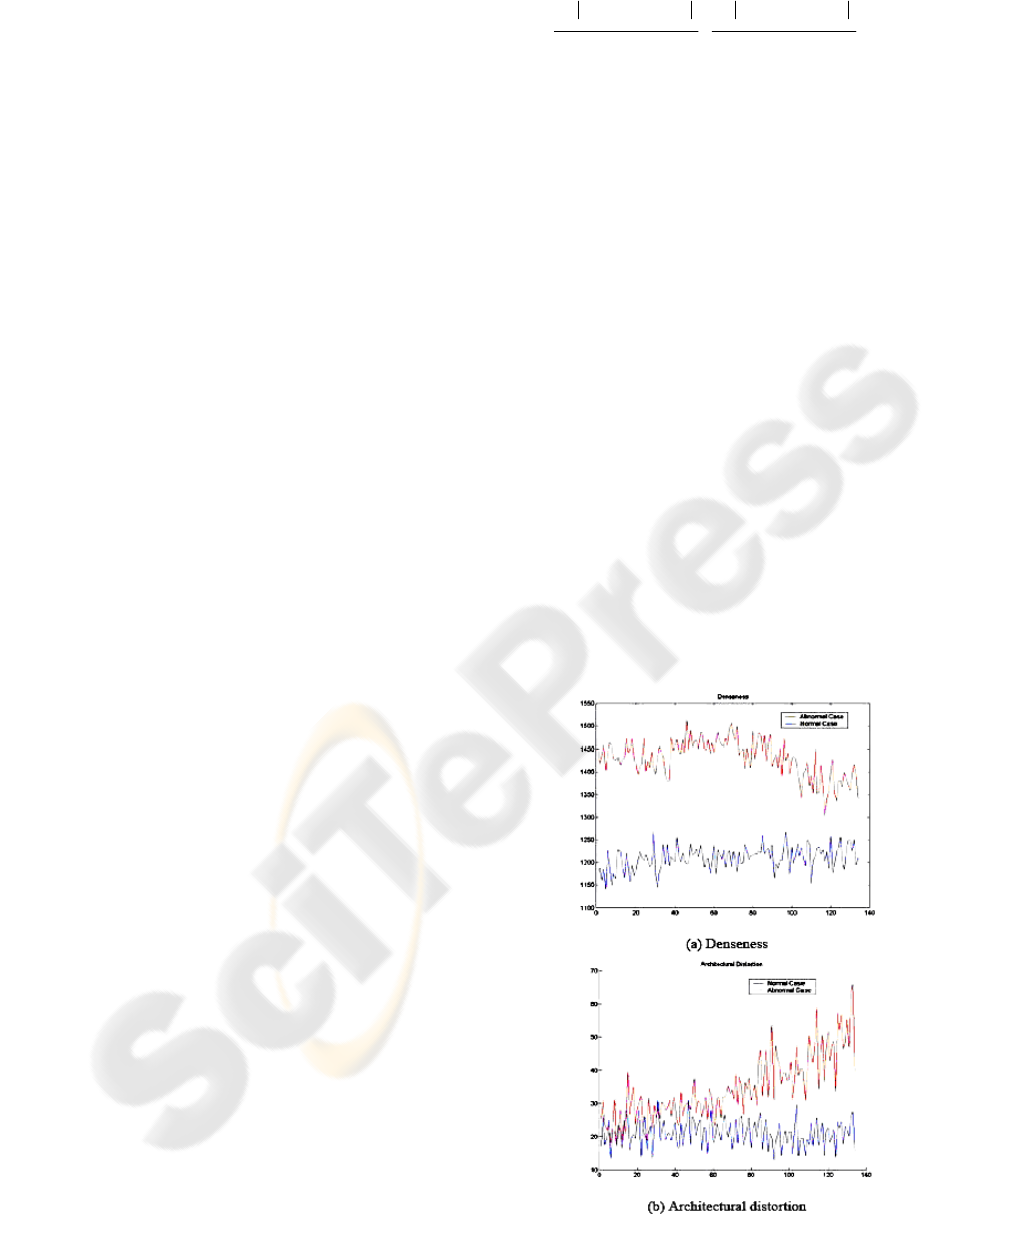
Denseness and architectural distortion values are
extracted and tracked in each frame of the sequence,
selecting a region of interest during the acetic acid
reaction. Graphs in Figure 1 show the temporal
changes occurring when we select a normal and
abnormal region of interest over the cervix surface.
Density presents no significant changes in its
temporal behavior for normal cases (lower curve)
because the acetic acid is not producing changes in
the cervix surface, while in abnormal cases (upper
curve) significant changes are represented by a
decrease in the slope at the end of the curve.
Architectural distortion evaluation is presented in
Fig. 1.b. The abnormal curve presents an increasing
slope because new details appear as the cervix
surface reacts with the acetic acid, while normal
region is not presenting changes. it’s important to
remark the difference between normal and abnormal
cases and how the temporal behavior of metrics can
be used for discrimination and identification of
lesions in a colposcopy exam using a computer
vision approach.
Figure 1: Temporal texture analysis of medical cases.
MULTIDIMENSIONAL WAVELET ANALYSIS FOR RECOGNITION OF LESIONS IN COLPOSCOPY TEST
351
3 WAVELET AGGREGATED
SIGNAL
The concept of the wavelet-aggregated signal was
previously introduced by (Lyubushin, 1998). An
aggregated signal is a scalar signal providing
maximum information on the most general
variations present in all of the processes analyzed
and at the same time suppressing components that
are characteristic of individual processes and that
usually represent local noise. The aggregated signal
is constructed in two stages that will be described
below. A detailed description of the wavelet-
aggregated signal can be found in (Lyubushin,
2000).
Below, only Haar wavelets (4) are used. This
choice is dictated by the fact that we seek the most
pronounced common variations for which basis (4)
is best suited.
⎥
⎦
⎤
⎜
⎝
⎛
∈−=Ψ
2
1
,01)( tift
,01,
2
1
1 totherfortif
⎥
⎦
⎤
⎜
⎝
⎛
∈+
(4)
Let x(t) be a signal with a discrete time t N
samples long, t = tj= j∆t, j= 1, … , N. It is assumed
that N is an integer of the 2
m
type, which is
convenient for the subsequent use of the fast wavelet
transformation. If N is not equal to 2
m
, the signal x(t)
can be complemented by zeros until its length
becomes 2
m
, where m is the minimum integer for
which N≤2
m
. In the case of a finite sample and
discrete time, the formula for multiresolution
analysis is
.2
),()()(
),()(
)(
)()()(
2
1
)()(
1
)(
)(
tj
tctx
txdtx
j
jj
j
m
m
ΔΧ=
−Ψ=
+=
∑
∑
−
=
=
αα
ααααα
α
α
τ
ττ
α
(5)
The coefficient d in (5) is equal to the mean of
x(t), t = 1, …, N. The set of values c
(
α
)
(
τ
j
(
α
)
) and d
are calculated using the direct fast wavelet
transformation. The wavelet-aggregated signal is
constructed in two stages.
The first stage initially involves the calculation
of the wavelet coefficients for each time series under
study and at each scale level using the fast discrete
wavelet transformation. Before the transformation,
the time series are converted to series in increments
and are normalized in order to provide diverse
physical signals of different scales for join
processing. The initial wavelet coefficients are then
converted to the so-called canonical wavelet
coefficients, which are obtained from covariance
matrices of wavelet coefficients at each detail level
using the method of canonical correlations. This
conversion aims at removing individual noise from
the wavelet coefficients and to amplify the common
component.
At the second stage, the intensity of the common
component is additionally increased by calculating
the first main component of the covariance matrices
of canonical wavelet coefficients at each detail level.
Thus, a scalar sequence of hypothetical wavelet
coefficients is obtained at each detail level, which
makes it possible to calculate the inverse discrete
fast wavelet transform and to obtain the time
realization of a scalar signal called the wavelet-
aggregated signal of the initial time series.
4 COLPOSCOPY IMAGE
SEQUENCES
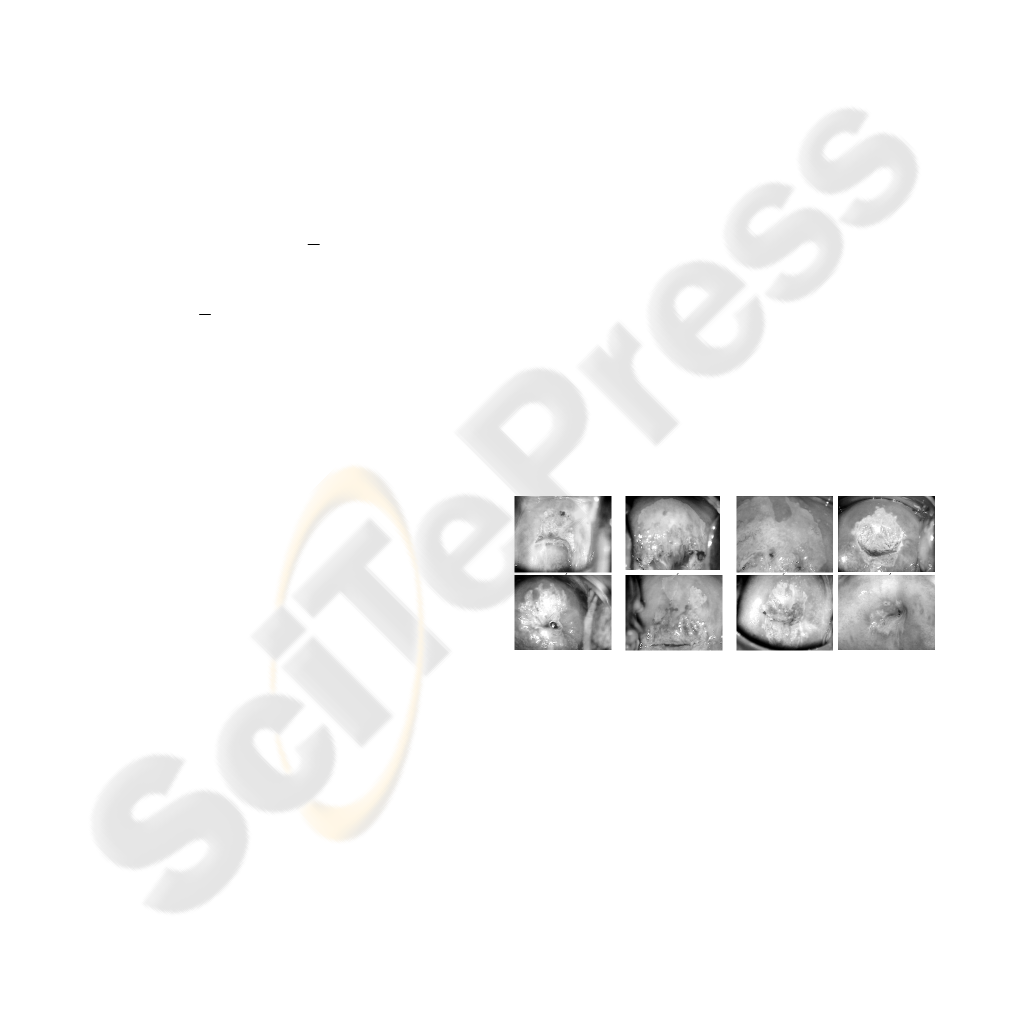
Sequences used in this work include 8 abnormal
medical cases shown in Figure 2, captured by a
couple of colposcopy specialists in a public health
institution in Mexico. The equipment used for the
capture was a standard colposcope, a framegrabber
and a digital camera. Sequences were acquired after
the acetic acid application in order to register the
most important changes on the cervix.
Figure 2: Abnormal medical cases used in the study.
The size of the sequences varies in a range of
160 frames to 240 frames and the capture time is
about 8-12 seconds, that is the time that colposcopy
test last, using a rate of 20 frames per second.
Images in Figure 3 present the initial frame before
acetic acid application and the last frame of the
sequence after the acetic acid reaction has occurred.
There are some problems that must be solved in
order to have a correct temporal analysis: the image
stabilization and the non uniform illumination. A
more detailed description of the methods used here
is described in (Barreto, Altamirano, 2005).
VISAPP 2007 - International Conference on Computer Vision Theory and Applications
352
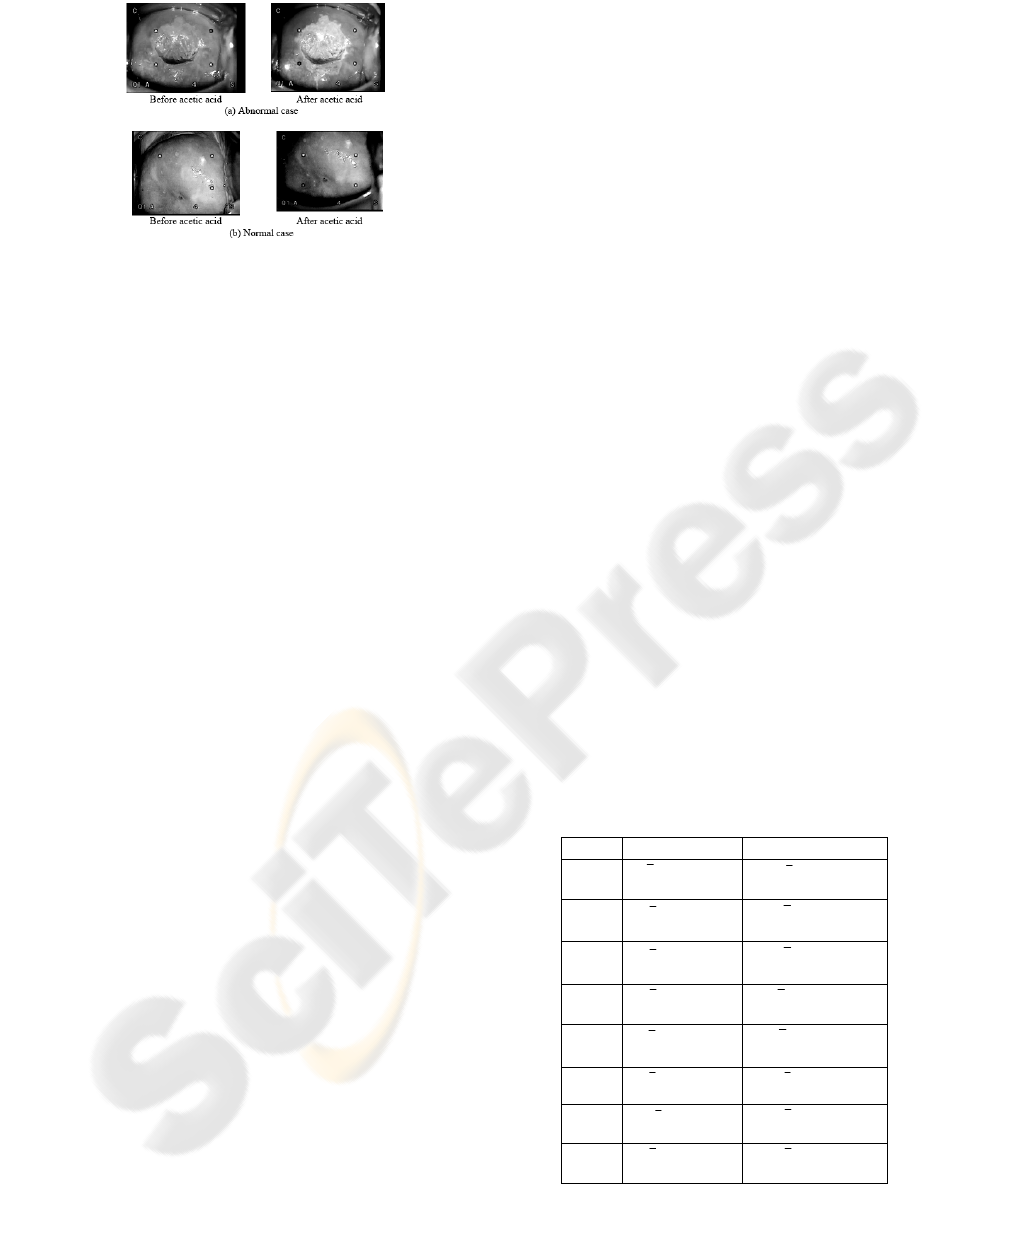
Figure 3: Texture changes after acetic acid application.
5 RESULTS
After image stabilization and non uniform
illumination correction processes are performed,
texture metrics are applied to the sequences for
temporal analysis estimation. After that, results of
temporal analysis are processed using the wavelet-
aggregated signal to identify lesions in cervix.
We just present results of architectural distortion
in this paper because this metric achieved in better
results in wavelet analysis. In every abnormal case a
region of interest to be analyzed along the sequence
was selected. This region was divided in several
subregions that were analyzed with texture metrics,
and the resulting curve describes the temporal
behavior of each subregion. Results of temporal
information are presented in Figure 4.
As we can see in Figure 4, in those subregions
where new details appear, the curve suffers an
increase in its slope value, while values in normal
regions do not present important changes,
identifying lesions in cervix accurately.
Results obtained from temporal analysis were
processed using the wavelet-aggregated signal
described previously. It’s important to highlight that
wavelet analysis allows to identify lesions,
eliminating components that are characteristic of
individual processes, like local noise caused by
measurement uncertainties. The wavelet-aggregated
signal for every abnormal case is constructed with
the time series described by each subregion in the
region of interest. So, we have N time series for
every abnormal case to be analyzed in the
construction of the wavelet. N is the total amount of
subregions in every case.
The method described in section 3 produce a new
signal that is characterized by significantly lower
noise and preserves the most informative variations
in time during the test.
Figure 4 plots the wavelet-aggregated signal for
every abnormal case, showing over the horizontal
axis the subregion where lesions appear. For a better
appreciation of results, we also show standard
deviation and mean values in every case, splitting
data in normal and abnormal subregions and getting
two measures for each case. These measures are
summarized in Table 1. It can be noticed that
standard deviation value in normal subregions is
smaller than those subregions where lesions
appeared, showing data dispersion and variations in
the signal.
In the same way, the wavelet-aggregated signal
generated in every case show variations in those
subregions where significant changes are present.
This analysis give support to temporal analysis
performed with texture metrics.
We can compare graphs for texture metrics with
the wavelet-aggregated signal of every abnormal
case, in order to identify subregions where lesions
appear as for example subregions 9 to 12 and 25 to
26 in the first medical case, where it can be noticed
an increase in the slope of the curve and a significant
variation in the wavelet obtained in these same
regions. The rest of the wavelet signal preserves its
normal value, not showing significant variation in
the amplitude value.
We also performed classification process using
information of wavelet analysis to give support to
our method. We use 1-NN, Simple Naive Bayes and
Backpropagation as learning algorithms and 10-fold
cross validation as test mode. Classification results
are shown in Table 2.
Table 1: Mean and standard deviation values for normal
and abnormal regions in medical cases.
MC Normal Abnormal
1
83931.0
23316.0
=
=
σ
x
3664.5
8631.1
=
=
σ
x
2
73117.0
17536.0
=
=
σ
x
2666.4
365.1
=
=
σ
x
3
72382.0
12835.0
=
=
σ
x
6212.3
4254.1
=
=
σ
x
4
47121.0
1592.0
=
=
σ
x
84576.0
062167.0
=
=
σ
x
5
1207.1
33906.0
=
=
σ
x
5982.2
85605.0
=
=
σ
x
6
53559.0
09307.0
=
=
σ
x
8261.1
65914.0
=
=
σ
x
7
689.5
8197.1
=
=
σ
x
611.45
619.23
=
=
σ
x
8
7862.1
64328.0
=
=
σ
x
466.17
9494.5
=
=
σ
x
MULTIDIMENSIONAL WAVELET ANALYSIS FOR RECOGNITION OF LESIONS IN COLPOSCOPY TEST
353

Can be observed that features used in
classification process achieved in good results, even
when accuracy in classification is not a high value in
some cases. The F-measure is a popular combination
of precision and recall into a single parameter,
showing that classifications of lesions can be
identified with some precision. Although
classification gives good results, more features can
be used in order to increase accuracy in
identification of lesions.
Multidimensional wavelet analysis performed in
this work shows how useful is temporal information
for identification of lesions in cervix, enhancing our
previous work, and giving reliability to our method.
6 CONCLUSIONS
We have presented an approach about identification
of lesions in the cervix based on temporal texture
analysis. Results show the importance of temporal
analysis in identification of lesions and how this
information can be used in later analysis, in order to
enhance lesions detection process.
Wavelet analysis allows to process data at
different scales or resolutions. Main advantage over
traditional Fourier methods is that wavelet analyzes
physical situations where the signal contains
discontinuities and sharp spikes, highlighting
abnormalities found in temporal analysis of
colposcopy test information.
The wavelet-aggregated signal used in this work
allows to identify those regions in cervix where
lesions are present, complementing our previous
work and giving support to the approach presented
before. The main advantage of wavelet analysis is
that this technique supress local noise present in the
curve obtained from temporal analysis, preserving
just the variations corresponding to lesions in the
cervix surface.
Texture metrics results showed a good
correlation with the changes presented in the images.
Results show to be promising because there are
important differences between normal and abnormal
cases using a set of medical cases.
Direction for future work is to use not just
texture information but other parameters like three-
dimensional data as well as use another basis
function in wavelet analysis instead of just Haar
function.
ACKNOWLEDGEMENTS
First author wishes to thank CONACyT the support
for studies of masters in Computer Science under
scholarship number 189941.
REFERENCES
Baeg S., Kehtarnavaz N., 2002. Classification of Breast
Mass Abnormalities using Denseness and
Architectural Distortion, Electronics Letters on
Computer Vision and Image Analysis, Vol. 1 Num. 1
pp. 1-20.
Barreto F.A., Altamirano R.L., Morales T.R.M., Cisneros
A.J.D., 2005. Identifying Precursory Cancer Lesions
Using Temporal Texture Analysis, Second Canadian
Conference on Computer and Robot Vision.
Burghardt E., 1991. Colposcopy-Cervical Pathology,
Textbook and Atlas, Thieme Germany.
Claude I., Pouletaut P., Huault S., Boulanger J-C, 2001.
Integrated Color and Texture Tools for Colposcopy
Image Segmentation, International Conference Image
Processing IEEE.
Claude I., Winzenrieth R., Pouletaut P., Boulanger J-C,
2002. Contour Features for Colposcopic Image
Classification by Artificial Neural Network, 16 th
International Conference on Pattern Recognition
IEEE.
Lyubushin A.A., 1998. An Aggregated Signal of the Low-
Frequency Geophysical Monitoring Systems, Fiz.
Zemli Num. 3 pp. 69–74.
Lyubushin A.A., 2000. Wavelet-Aggregated Signal and
Synchronous Peaked Fluctuations in Problems of
Geophysical Monitoring and Earthquake Prediction,
Fiz. Zemli Num. 3 pp. 20–30.
Parker M.F., Karins J.P., O´Connor D.M., 1998.
Hyperspectral Diagnostic Imaging of the Cervix:
Initial Observations, Proceedings of the Pacific
Medical Technology Symposium IEEE.
Parker M.F., Mooradian G.C., Okimoto G.S., et al, 2002.
Initial Neural Net Construction for the Detection of
Cervical Intraephithelial Neoplasia by Fluorescence
Imaging, American Journal of Obstetrics and
Gynecology.
Pogue B.W., Mycek M.A., Harper D., 2000. Image
Analysis for Discrimination of Cervical Neoplasia,
Journal of Biomedical Optics SPIE, Vol. 5 pp.72–82.
Tapia L.D., Barreto F.A., Altamirano R.L., 2006.
Identifying cervical cancer lesions using temporal
texture analysis, Fourth IASTED International
Conference on Biomedical Engineering, Innsbruck
Austria.
Tumer K., Ramanujam N., Ghosh J., Kortum R.R., 1998.
Ensembles of Radial Basis Function Networks for
Spectroscopy Detection of Cervical Precancer, IEEE
Transactions on Biomedical Engineering, Vol. 45
Num. 8. pp. 953-961.
VISAPP 2007 - International Conference on Computer Vision Theory and Applications
354
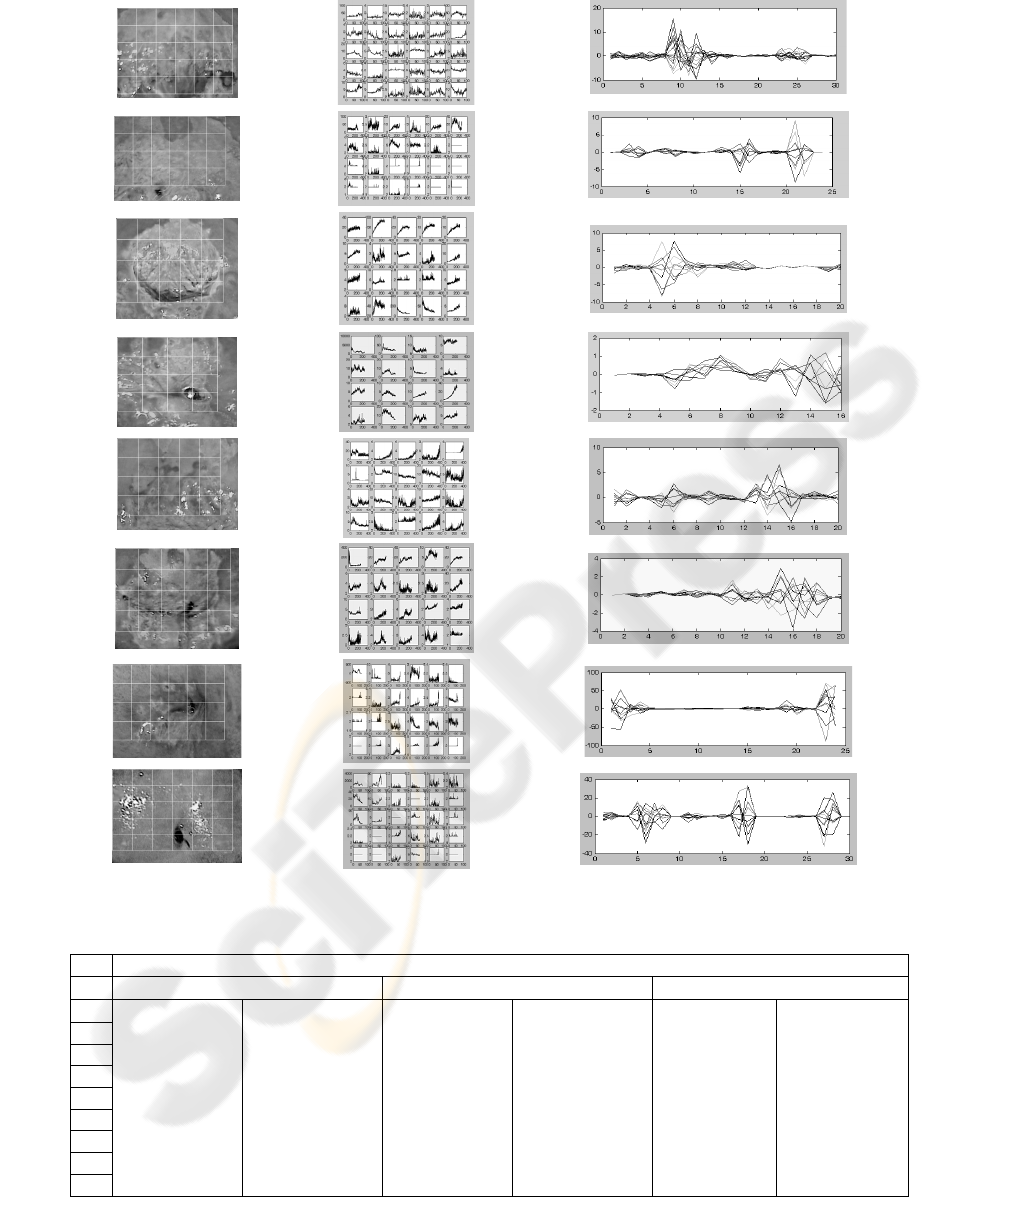
Region of interest Temporal texture analysis Wavelet-aggregated signal
Figure 4: Temporal information obtained with temporal texture analysis and wavelet-aggregated signal for every case.
Table 2: Classification results using several learning algorithms.
C ALGORITHMS
1-NN Naive Bayes Backpropagation
Accuracy (%) F-Measure (%) Accuracy (%) F-Measure (%) Accuracy (%) F-Measure (%)
1 73.33 77.8 73.33 77.8 73.33 77.8
2 75 85 83.33 88.9 75 85
3 75 83.9 73.684 81.5 70 81.3
4 56.25 72 62.5 70 43.75 60.9
5 50 61.5 70 76.9 30 34.8
6 65 78.8 80 84.6 80 87.5
7 75 85 87.5 90.9 75 85
8 70 80 83.33 87.2 80 87
MULTIDIMENSIONAL WAVELET ANALYSIS FOR RECOGNITION OF LESIONS IN COLPOSCOPY TEST
355
