
ADAPTIVE DOCUMENT BINARIZATION
A Human Vision Approach
Vassilios Vonikakis, Ioannis Andreadis, Nikolaos Papamarkos
Democritus University of Thrace, Dept. of Electrical & Computer Engineering, 67100, Xanthi, Greece
Antonios Gasteratos
Democritus University of Thrace, Dept. of Production & Management Engineering, 67100, Xanthi, Greece
Keywords: Document binarization, thresholding, OFF center-surround cells, human visual system.
Abstract: This paper presents a new approach to adaptive document binarization, inspired by the attributes of the
Human Visual System (HVS). The proposed algorithm combines the characteristics of the OFF ganglion
cells of the HVS with the classic Otsu binarization technique. Ganglion cells with four receptive field sizes
tuned to different spatial frequencies are employed, which, adopting a new activation function, are
independent of gradual illumination changes, such as shadows. The Otsu technique is then used for
thresholding the outputs of the ganglion cells, resulting to the final segmentation of the characters from the
background. The proposed method was quantitatively and qualitatively tested against other contemporary
adaptive binarization techniques in various shadow levels and noise densities, and it was found to
outperform them.
1 INTRODUCTION
In automatic document processing, text binarization
is critical, since it allows the documents to be
recognized, stored, and retrieved more efficiently.
The first attempts towards binarization utilized a
statistically defined global threshold (Otsu 1979).
These methods, though simple, exhibit poor results
when they deal with degraded documents or
documents captured under varying lighting
conditions (e.g. shadows). Other methods attempt to
reduce the number of shades in the document, using
color reduction techniques (Papamarkos 2003).
Their main objective is to decrease the number of
shades into only two. This results to the binarization
of the document. More sophisticated techniques use
local thresholds, estimated according to local spatial
and intensity characteristics (Niblack 1986,
Papamarkos and Gatos 1994, Sauvola and
Pietikainen 2000). These methods are tolerant to
illumination changes, but they might be sensitive to
noise and, thus, degrade the final output of the
segmentation.
Contemporary work in the HVS has proved that
brightness and darkness are qualitatively different,
rather than different grades on a single continuum of
the perceived intensity. The perception of brightness
and darkness is subserved by two different cell
populations of antagonistic responses; the ON-center
and OFF-center ganglion cells (Fiorentini 2004).
ON-center cells increase their activity when light
increments (bright stimuli) are presented in their
receptive fields (the part of the retina that the cell is
connected to), whereas OFF-center cells are
stimulated by light decrements (dark stimuli)
(Chichilnisky and Kalmar 2002). In the retina, these
two cell populations form two independent and
superimposed mosaics.
Usually, the text comprises dark stimuli over
bright background. Thus, it is a visual signal, which
stimulates the OFF-center ganglion cells. The ability
of the HVS to recognize text under complex lighting
conditions surpasses any artificial system. Figure 1
shows a text image, where there exists a sharp
change from a highlight to a shadow. This might be
the case in scanned books, where the middle of the
two pages is occasionally poorly lightened. This
uneven illumination causes the dark text in the light
104
Vonikakis V., Andreadis I., Papamarkos N. and Gasteratos A. (2007).
ADAPTIVE DOCUMENT BINARIZATION - A Human Vision Approach.
In Proceedings of the Second International Conference on Computer Vision Theory and Applications - IU/MTSV, pages 104-109
Copyright
c
SciTePress
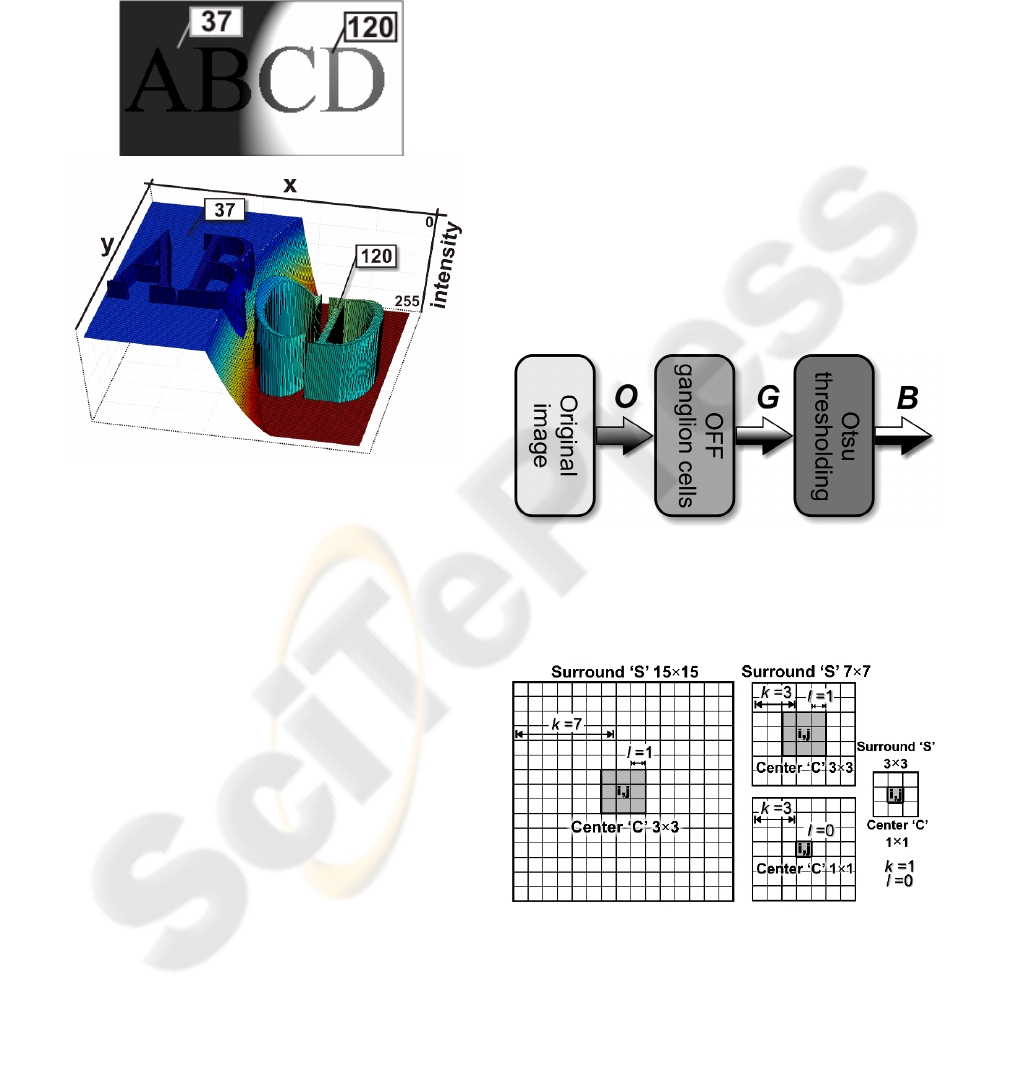
region, to be lighter (120/255) than the bright
background in the dark region (37/255). It is
impossible to find a global threshold to successfully
segment the whole text from the background, since
in some regions the background is darker than the
characters. However, the HVS effortlessly manages
to do so.
Figure 1: A document and its 3-dimensional
representation. A strong shadow and a highlight are both
present
.
The main objective of the proposed method is to
adopt the characteristics of the OFF-ganglion cells
of the HVS and employ them in the text binarization
process. OFF-ganglion cells have an antagonistic
center-surround receptive field. This characteristic is
also present in the artificial center-surround cells
that are employed by the proposed method. Since the
HVS simultaneously processes many spatial scales,
four receptive field sizes, ranging from 3×3 to
15×15 pixels, are used in order to extend the
performance of the proposed method from fine to
coarse spatial scales. Additionally, a new activation
function for the proposed OFF center-surround cells
is introduced. This activation function exhibits
constant responses for a document subjected to
uneven illumination. Finally, the output of the OFF
center-surround cells is segmented with the Otsu
technique (Otsu 1979), delivering good results at
various illumination levels. The proposed method is
compared, both quantitatively and qualitatively, to
two other well-known techniques for local
thresholding (Niblack 1986, and Sauvola and
Pietikainen 2000). The tests include various
densities of noise along with different shadow
levels. In all cases, the propose method outperforms
the other methods.
The rest of the paper is organized as follows:
Section 2 presents a description of the proposed
method. Section 3 depicts the experimental results as
well comparisons and evaluation of the proposed
method. Finally, section 4 presents the conclusions.
2 DESCRIPTION OF THE
METHOD
Figure 2 depicts the block diagram of the proposed
method. First, the grayscale image O of the
document is processed by OFF center-surround
cells. At every pixel (i,j) of the image O, an OFF
center-surround cell calculates the local contrast.
The output G of these cells is then thresholded by
the classic Otsu technique (Otsu 1979), which
outputs the final binary result B.
Figure 2: The block diagram of the proposed method.
The size of the center-surround masks employed is
selected among four possible scales, depicted in
Figure 3.
Figure 3: The four possible sizes that an OFF center-
surround cell might obtain for every pixel (i,j).
The above four sizes were selected for two main
reasons. First, the neurophysiological data for the
HVS suggest that the radius of the surround is
typically 4 to 8 times larger than the radius of the
ADAPTIVE DOCUMENT BINARIZATION - A Human Vision Approach
105
center (Martin and Grunert 2004). Second, the size
of the receptive field, tunes the response of the cell
to a certain spatial frequency: small receptive fields
are stimulated by high spatial frequencies (fine
details), whereas large receptive fields are stimulated
by low spatial frequencies (coarse details). The four
sizes were selected in order to respond to three
frequency categories, roughly defined as high,
medium and low. The 3×3 surround mask responds
better to small fonts and other high-frequency
details. The two 7×7 masks respond optimally to
middle-frequency details and the 15×15 mask
responds better to low-frequency inputs. The exact
sizes were determined after extensive
experimentation with several kinds of documents.
Additionally, the sizes were selected to be small, in
order to reduce the complexity and minimize the
execution times.
For every pixel (i,j) in the original image O, the
size of the mask that best fits the spatial scale of the
local contents of the image is selected among the
four possible sizes. This is done by selecting the
mask that maximizes equation (1). The physical
meaning is that at any position in the image, only
one of the four receptive field sizes has the optimum
scale for the contents of this region: the one
achieving the highest contrast between the surround
and the center. This is exactly what function f
i,j
(S,C)
measures, i.e. the local contrast in the neighborhood
of pixel (i,j).
(
)
(
)
(
)
() ()
,,,
,,
22
,
11
21 21
ij ij ij
jk jl
ik il
y
xyx
yikx jk yilx jl
fSC SkCl
OO
kl
++
++
=− = − =− = −
=−=
=−
++
∑∑ ∑∑
() () ()
()
,
max
,,
,
,max
ij
ij ij
kl
f
SC S k C l=−
(1)
where S
i,j
is the average image intensity in the
surround of the mask, with its central pixel placed in
the pixel (i,j) of the original image O. Similarly, C
i,j
is the average image intensity in the center of the
mask. k is the radius of the surround, l is the radius
of the center and O is the pixel value of the original
image.
The main objective of the proposed method is to
compensate for the dark image regions caused by
insufficient illumination (e.g. shadows), or the
strong highlights. For this reason a new activation
function (equation (2)) is introduced, inspired by the
shunting equation of a center-surround network
(Ellias and Grossberg 1975).
Equation (2) correlates the maximum local
contrast f
i,j
max
with the surround S for every pixel
(i,j). The surround S, being the average image
intensity, constitutes a measurement of the local
lighting conditions in the neighborhood of pixel (i,j).
The value 255 in the numerator is necessary to scale
the output of equation (2) in the interval [0,255].
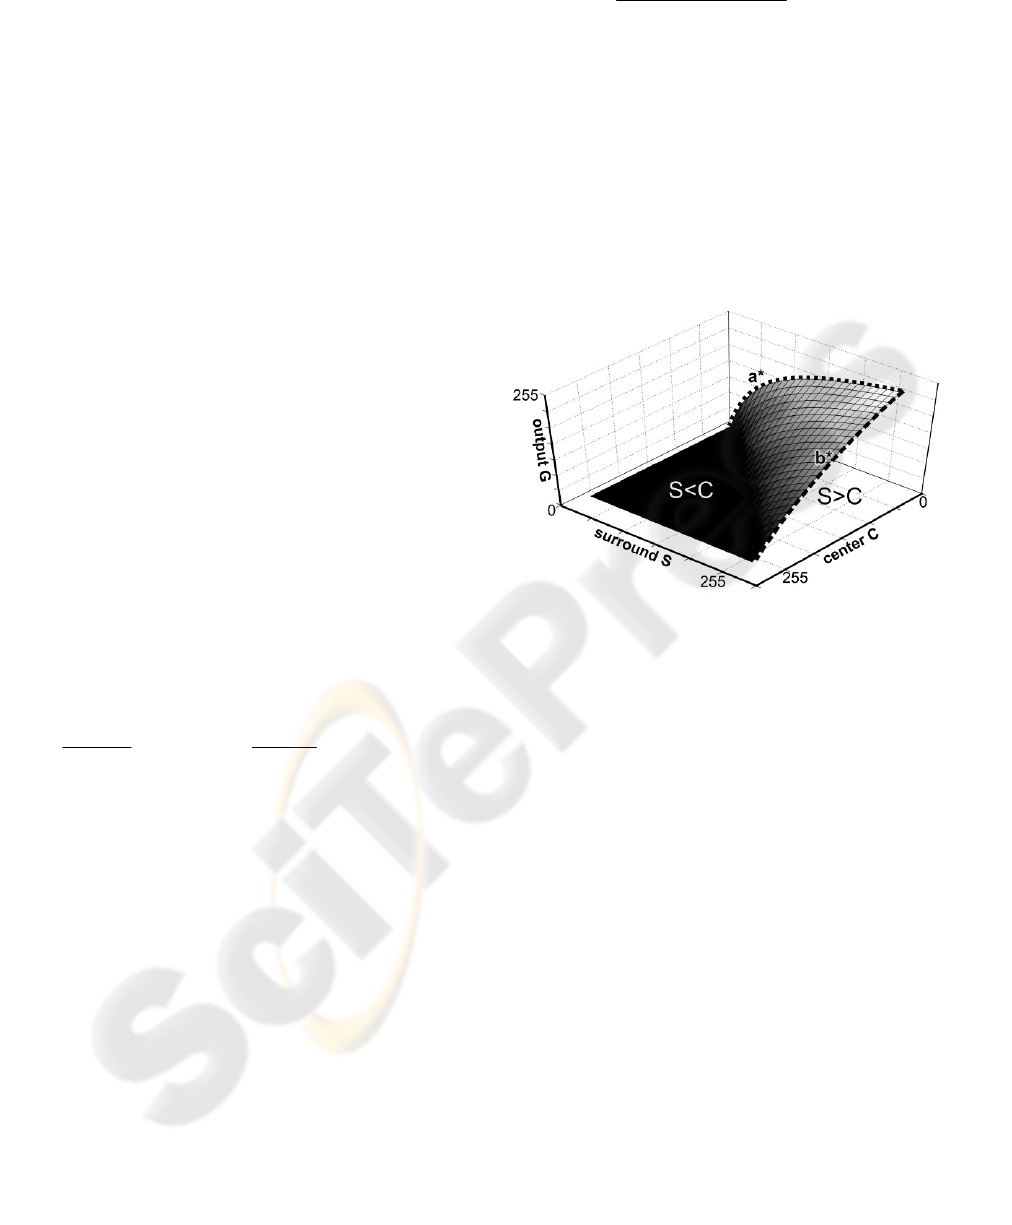
Figure 4 shows the 3-dimensional representation of
equation (2).
Figure 4: The 3-dimensional representation of equation
(2).
When the center is brighter than the surround
(S<C), which means that the central pixel (i,j) is part
of the background, the output G is zero. On the
contrary, when the center is darker than the surround
(S>C), the central pixel (i,j) probably belongs to the
characters and its output value is determined by the
non-linearities a* and b*. The non-linearity a*
compensates for the dark image regions, such as
shadows, where S has low values. In these cases, the
maximum local contrast f
i,j
max
increases its value
according to a*. The degree of non-linearity a* is
determined by equation (3). The smaller the constant
in the equation (3), the higher is the degree of non-
linearity a*. Small constants around 1 or 2 tend to
over-compensate for dark image regions, resulting to
the extraction of noise in these areas. Extensive
testing showed that this problem is surpassed by
setting an offset in equation (3), which achieves a
good trade-off between shadow compensation and
noise extraction. An optimum value for this offset
was found to be 10, for 8-bit images. In the light
image regions, such as highlights, where S has high
values, the non-linearity b* determines the output G.
In these cases, the maximum local contrast f
i,j
max
()
()
(
)
()
max
,,
max
,
max
,
,,
255
>0
,
0 otherwise
ij ij
ij
ij
ij ij
fAS
f
GSC
AS f
⎧
⋅+
⎪
∀
=
+
⎨
⎪
⎩
(2)
(
)
,
=+
ij
A S S offset
(3)
VISAPP 2007 - International Conference on Computer Vision Theory and Applications
106
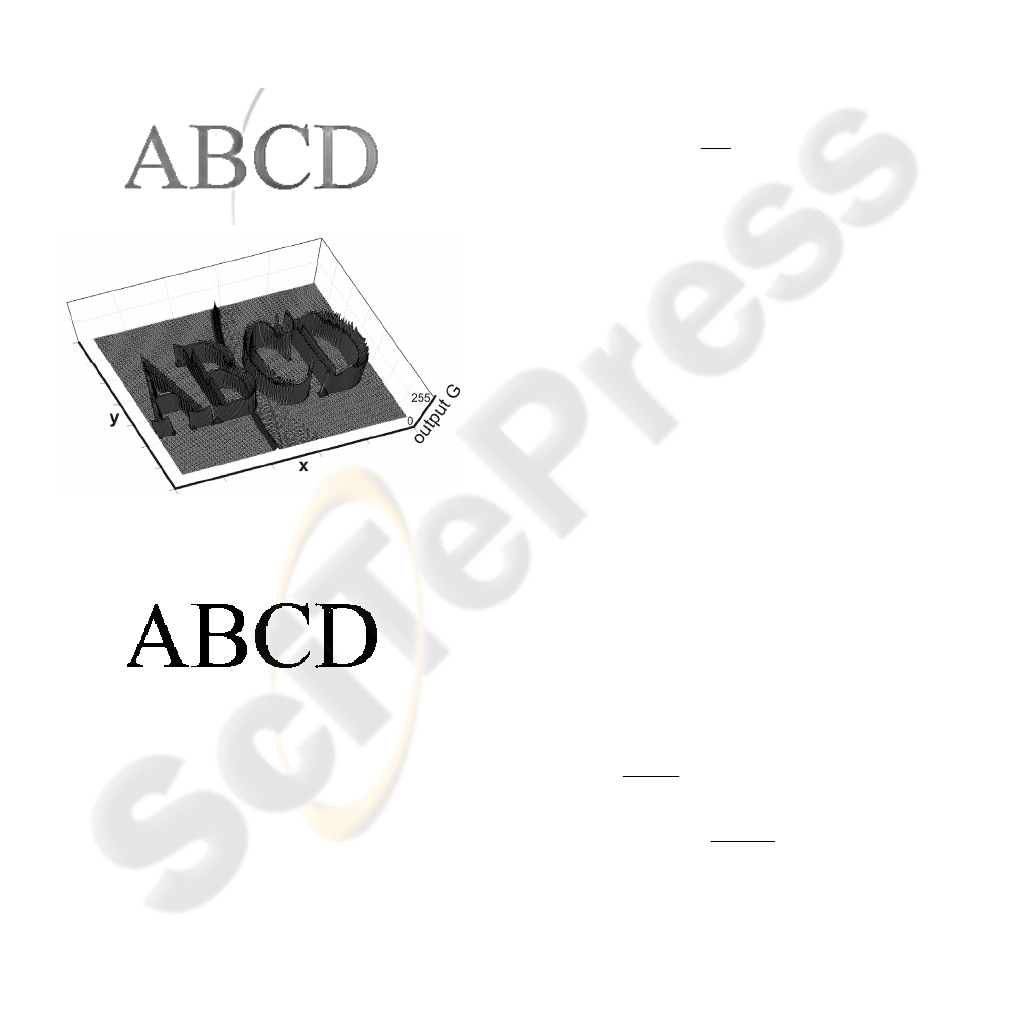
increases its value according to b*. Figure 5 depicts
the output of equation (2) when applied to the image
of Figure 1. It is clear that the output G of the OFF
center-surround cells is not affected by the varying
illumination. The transition from the shadow to the
highlight has disappeared and all the characters have
obtained approximately the same output value,
making them apparently distinguishable from the
background. The final step of the method is the
Otsu’s thresholding technique, which classifies the
output G of the center-surround cells into two
classes: background and foreground. Figure 6
depicts the output of the Otsu technique when
applied to the output G of the center-surround cells.
Figure 5: The output of equation (2) when applied to the
image of Figure 1, both in 2 and 3-dimensional
representation.
Figure 6: The output of the Otsu’s thresholding technique
when applied to the output G of the center-surround cells
of the image in Figure 5.
Clearly, Otsu’s technique when combined with
the OFF center-surround cells, successfully
segments the text characters from the background.
Even the sharp transition from shadow to highlight,
located between the B and C letters, which has
triggered the OFF center-surround cells (Figure 5),
is correctly classified.
3 EXPERIMENTAL RESULTS
The results of the proposed method were compared
with the ones of two others, which perform local
thresholding and can cope with varying illumination:
Niblacks’s and Sauvola’s (Niblack 1986, and
Sauvola and Pietikainen 2000). For the quantitative
evaluation, a test document, containing Times New
Roman fonts ranging from 10pt to 48pt, both plain
and bold, was constructed in order to be used as
ground truth. This ground truth image (GT) was then
used to construct test images with various levels of
shadows and noise densities. The shadowed images
(SH) were created by multiplying half of the pixels
of GT with a shadow factor, as equation (4) depicts.
() ()
,1 ,
100
sh
SHij GTij
⎛⎞
=− ×
⎜⎟
⎝⎠
(4)
where, sh is a variable that defines the final shadow
level. In the following experiments, five SH were
created, having shadow levels of 50%, 60%, 70%,
80% and 90%. The lower limit of 50% was selected
because shadow levels below 50% slightly alter the
image visually. The upper limit of 90% was selected
because shadow levels higher than 90% result to the
loss of visual information, altering irreversibly the
image. Different levels of noise were added with
Matlab to the five SH images, resulting to the final
40 test images with both shadow and noise that were
used in the experiments. The added noise was
Gaussian with zero mean and a variety of variances:
0.02, 0.04, 0.06, 0.08, 0.1, 0.15 and 0.2. The upper
variance limit was selected because noise densities
with variances above 0.2, severely distort the image,
making it impossible even for the human observer to
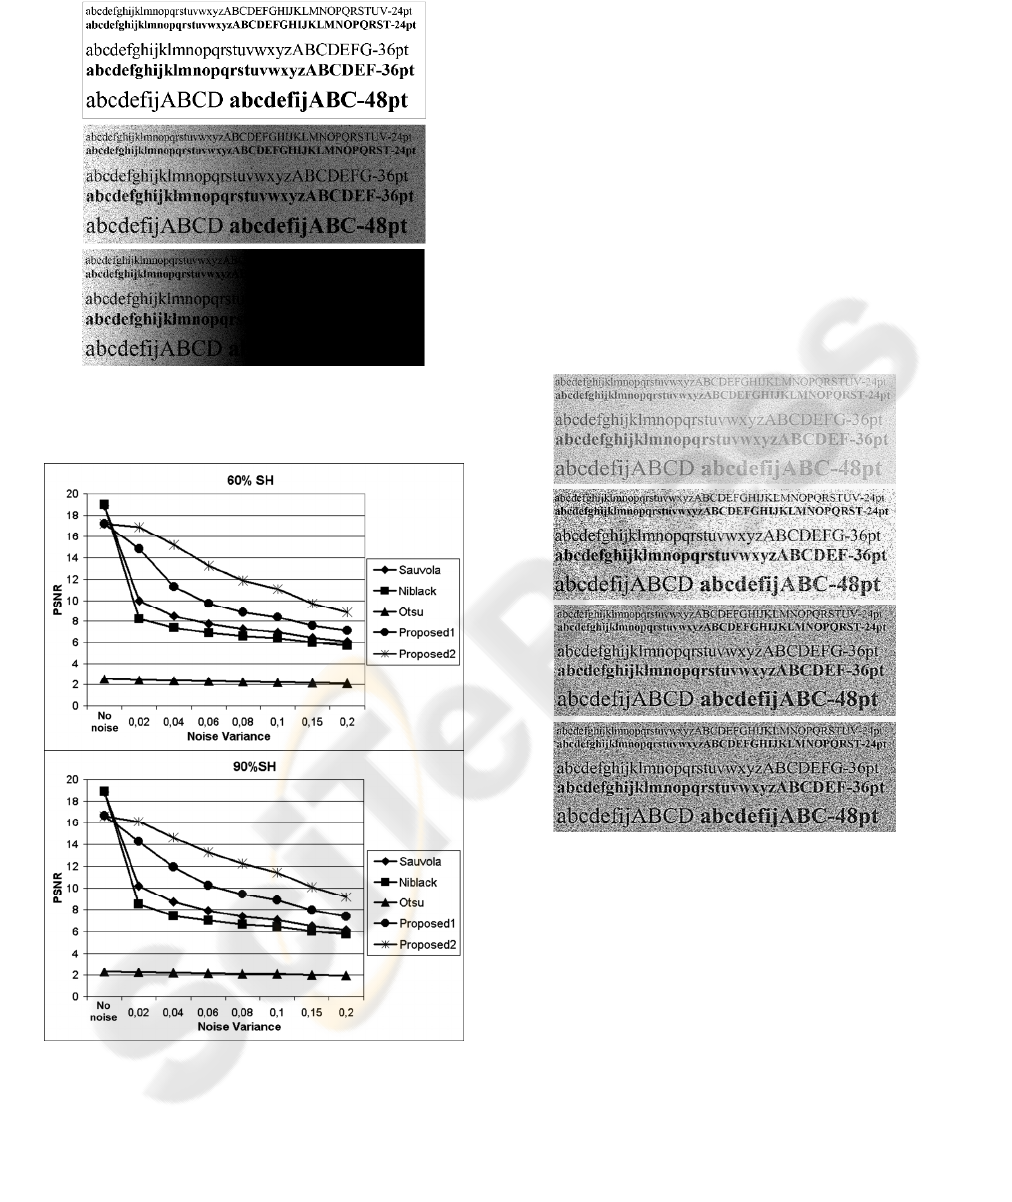
distinguish font sizes smaller than 12pt. Figure 7
shows parts of the test images along with the GT.
All 40 images were segmented by the proposed
method, Niblacks’s, Sauvola’s and Otsu techniques.
The results were compared with the GT image and
the Peak Signal-to-Noise Ratio (PSNR) was
calculated according to equation (5).
()
2
,,
11
2
10
1
10 log
py px
ij ij
ij
GT
MSE GT K
py px
MAX
PSNR
MSE
==
=−
⋅
⎛⎞
=⋅
⎜⎟
⎝⎠
∑∑
(5)
where MSE is the root mean square error, K is one of
the 40 images, MAX
GT
is the maximum value of the
GT image, and py and px are the image dimensions.
In the evaluation process, two versions of the
proposed method were used. The first, named
ADAPTIVE DOCUMENT BINARIZATION - A Human Vision Approach
107
“Proposed1” is the one that has been described in
Section 2.
Figure 7: From top to bottom: Part of the GT image, the
50% and 90% SH images both corrupted with Gaussian
noise with 0.2 variance.
Figure 8: Results of the comparison for test images 60%
SH and 90% SH.
The second, named “Proposed2” is the same as
the first, but with a very basic post-processing step:
Any foreground pixel that has zero connectivity in
its 8-neighborhood, is reassigned to background.
Figure 8 depicts the results of the comparison
between the five methods for the images 90% SH
and 60% SH and for all the noise densities. It is clear
that both for low (60%) and high (90%) shadow
levels, the two versions of the proposed method
outperform all the other methods, achieving a higher
PSNR. The same accounts for all the noise densities,
apart from the case of no noise. In this case the
proposed method achieves slightly lower PSNR than
the methods of Sauvola and Niblack. In all the other
cases, the proposed method, in both versions,
outperforms all the other techniques. Sauvola’s
method is second after the proposed method, slightly
outperforming Niblack’s. The very low PSNR that
the Otsu method achieves is a proof that global
threshold techniques are unsuitable for use in images
captured under varying lighting conditions.
Figure 9: From top to bottom: Results of the OFF ganglion
cells (G), final result of the proposed method (B),
Sauvola’s and Niblack’s results for the 90% SH image
with 0.2 noise variance.
Figure 9 depicts a part of the results of the three
methods for the most difficult image of the set: the
90% SH image with the 0.2 noise variance. Figure
10 depicts the result of the proposed method in a
degraded document produced by repeated
photocopying. This qualitative comparison clearly
reinforces the quantitative results depicted in Figures
8 and 9. The proposed method achieves the best
results among the three techniques, compensating
for the dark image region and finally restores the
document. Both the other two techniques are heavily
VISAPP 2007 - International Conference on Computer Vision Theory and Applications
108
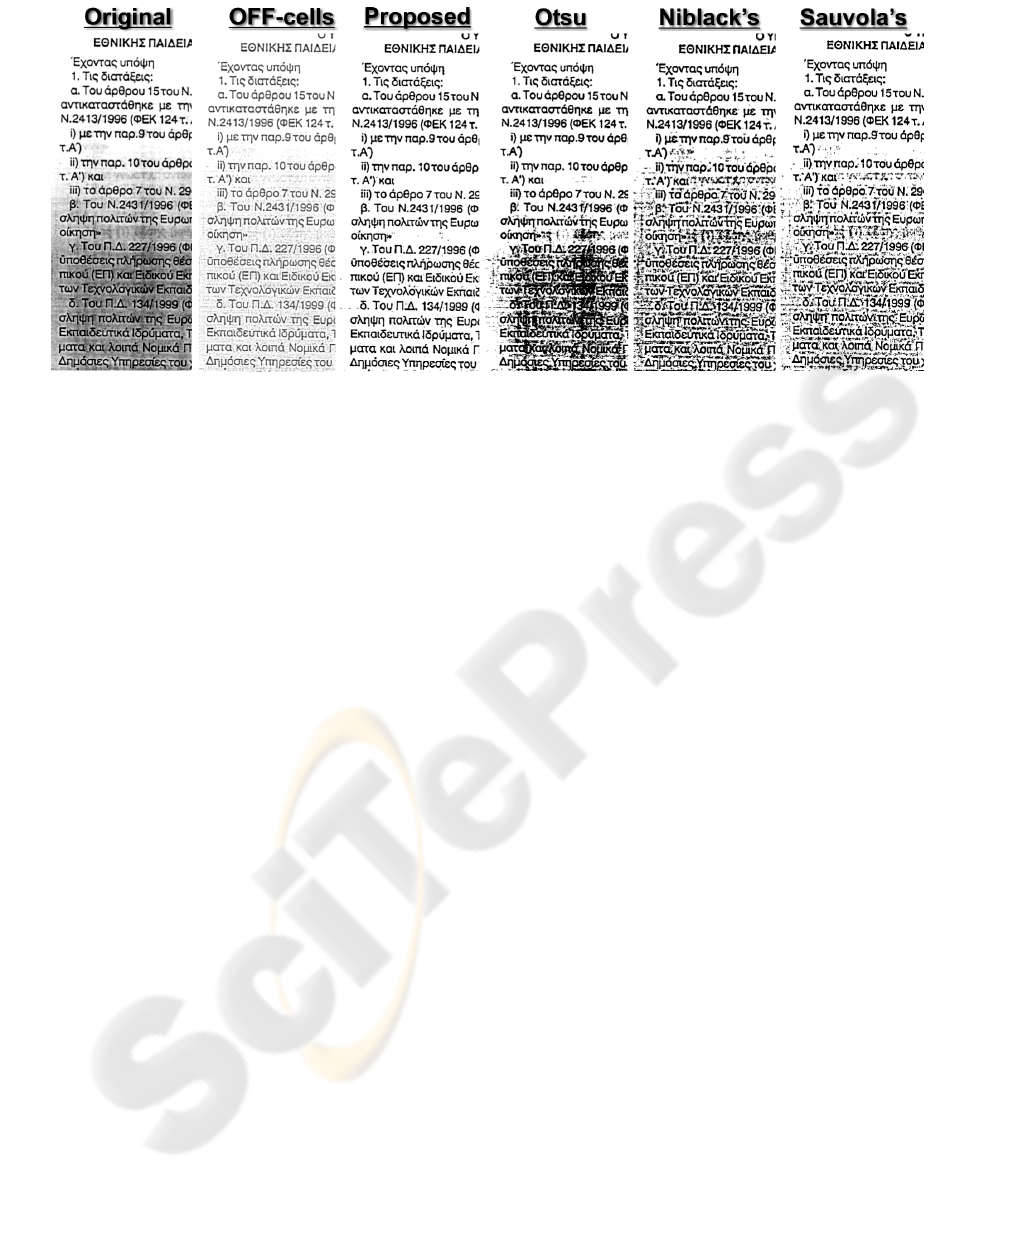
Figure 10: Results of the proposed method in a degraded photocopied document.
affected by the noise, failing to improve the
condition of the original document. Among the two,
Sauvola’s method achieves slightly better results
than Niblack’s method, again in agreement with the
quantitative results.
4 CONCLUSIONS
A new technique for adaptive document binarization
was presented in this paper, motivated by the OFF
ganglion cells of the HVS. Two are the important
novelties of the proposed method. First, the multi-
scale processing that is achieved by four different
center-surround masks, which are best tuned for
high, middle and low spatial frequencies. This
ensures that no information is lost in the processing,
even for the small font sizes. Second, is the new
activation function that correlates the maximum
local contrast with the average image intensity in
every image region. This activation function is not
affected by varying illumination, such as shadows
and highlights and produces a strong output for the
pixels that belong to characters.
The proposed method was both qualitatively and
quantitatively tested against 2 other methods for
local thresholding and was found to outperform
them in all shadow levels and noise densities.
Additionally, the proposed method exhibited better
results in the restoration of degraded documents,
mainly because it is less affected by the presence of
noise. This shows that the proposed method can be
successfully used for the binarization of documents
that were captured under uneven lighting conditions.
ACKNOWLEDGEMENTS
Mr. V. Vonikakis is funded by the Greek GSRT
(PENED-03ED17).
REFERENCES
Chichilnisky, E., J., Kalmar, R., S., 2002. Functional
Asymmetries in ON and OFF Ganglion Cells of
Primate Retina. The Journal of Neuroscience, 22, (7),
pp. 2737–2747.
Ellias, S., Grossberg, S,. 1975. Pattern Formation,
Contrast Control and Oscillations in the Short Term
Memory of Shunting On-Center Off-Surround
Networks. Biological Cybernetics, 20, pp. 69-98.
Fiorentini, A., 2004. Brightness and Lightness, The Visual
Neurosciences, MIT Press, 2, pp. 881-891.
Martin, P., Grunert, U., 2004. Ganglion cells in
mammalian retinae. In The Visual Neurosciences, MIT
Press, 1, pp. 410-421.
Niblack, W., 1986. An Introduction to Digital Image
Processing, Englewood Cliffs, N.J. Prentice Hall,
pp.115-116.
Otsu, N., 1979. A thresholding selection method from
grey-level histogram. IEEE Trans. Systems Man
Cybernet, SMC-8, pp. 62-66.
Papamarkos, N., 2003. Document Gray-Scale Reduction
Using a Neuro-Fuzzy Technique. International
Journal of Pattern Recognition and Artificial
Intelligence, 17, pp. 505-527.
Papamarkos, N., Gatos, B., 1994. A new approach for
multithreshold selection. Computer Vision, Graphics,
and Image Processing-Graphical Models and Image
Processing, 56, (5), pp. 357-370.
Sauvola, J., Pietikainen, M., 2000. Adaptive Document
Image Binarization. Pattern Recognition, 33, pp. 225–
236.
ADAPTIVE DOCUMENT BINARIZATION - A Human Vision Approach
109
