
ENHANCING KAPPA NUMBER CONTROL IN DOWNFLOW
LO-SOLIDS
T M
DIGESTER USING DIAGNOSIS AND MODELLING
Timo Ahvenlampi
University of Oulu, Systems Engineering Laboratory, 90014 University of Oulu, Finland
Rami Rantanen
Metso Automation Inc., Process Automation Systems, Tampere, Finland
Keywords:
Fault tolerant, pulp industry, monitoring, controllability.
Abstract:
In this study, Kappa number prediction and diagnosis in continuous Downflow Lo-Solids
T M
cooking appli-
cation is investigated. Gustafson’s Kappa number model is applied for the prediction of the blowline Kappa
number. New cooking temperature set point is solved iteratively based on the difference between the pre-
dicted and target blow-line kappa numbers. The main active variables for the Kappa number are monitored
using self-organizing map (SOM). The diagnosis and Kappa control are combined into a fault tolerant system.
The data is collected from industrial continuous Downflow Lo-Solids
T M
cooking digester. Good results were
achieved using the proposed approach.
1 INTRODUCTION
The question how the overall system of the sub
processes and chains of sub processes can be im-
proved, by means of fault diagnosis (see e.g. (Iser-
mann, 1997), (Venkatasubramanian et al., 2003a) and
(Venkatasubramanian et al., 2003b)), has not fully an-
swered. In particular, this holds for demanding pro-
cess conditions such as found in chemical and me-
chanical pulping. Modern processes generate a lot
of information, which can be used for improving
the operation of the process and quality of the prod-
ucts. This can be accomplished by combining expert
knowledge, modelling, control and fault diagnosis.
The pulp digester is very important unit opera-
tion in the chemical pulping plant. The control ac-
tions in the digester have effects to the entire fiber
line operations. Also the quality of the pulp in the
digester should be achieved with minimal cooking
costs. (Leivisk
¨
a, 2000) The quality of the chemical
pulping is characterized e.g. by the pulp’s strength,
viscosity, yield and Kappa number. Usually only
Kappa number is measured on-line. The on-line mea-
surement is located in the blow line of the digester.
Thus, the main control actions are observed only af-
ter the delay time of the cooking and washing zones.
The delay time can be several hours. By the predic-
tion of the Kappa number prior to the cooking zone
more information is provided to be applied in accu-
rate control actions. The prediction indicates changes
in the blow line Kappa number. The main control of
the pulp quality should be applied in the pulp digester.
The control of the pulp quality is more challenging
in the following subprocesses of the plant, if the pulp
quality (Kappa number) is out of the good quality area
after the digester.
The fault diagnosis is needed to ensure accurate
quality control of the chemical processes. Diagno-
sis of the chemical processes are studied in many pa-
pers, see e.g. ((Dash et al., 2003) and (Qian et al.,
2003)). In the field of chemical pulping, there are
not too many publications concerning fault diagno-
sis. Puranen (Puranen, 1999) has formed a distur-
bance index for process operators to be able to ob-
serve faulty process situations. In that study measure-
ments, means and deviations are combined by fuzzy
logic. Diagnosis of the digester has been also studied
in papers (Ahvenlampi et al., 2005) and (Tervaskanto
et al., 2005).
In large industrial plants, every sub process has its
own task and the entire plant is working properly if
all the sub processes are functioning effectively. A
faulty operation in one sub process usually changes
the performance of the entire plant. Therefore, faults
161
Ahvenlampi T. and Rantanen R. (2007).
ENHANCING KAPPA NUMBER CONTROL IN DOWNFLOW LO-SOLIDSTM DIGESTER USING DIAGNOSIS AND MODELLING.
In Proceedings of the Fourth International Conference on Informatics in Control, Automation and Robotics, pages 161-166
DOI: 10.5220/0001626201610166
Copyright
c
SciTePress

have to be found as quickly as possible and decisions
that stop the propagation of their effects have to be
made (Blanke et al., 2003). Active Fault Tolerant
Control (AFTC) detects and isolates possible faults
in the system and also reconfigures the control law
(Mahmoud et al., 2003). In paper (Simani and Patton,
2002), a robust model-based technique for the diag-
nosis of faults in a chemical process has been devel-
oped. The system consists of a fuzzy combination of
Takagi-Sugeno models. Fault Detection and Identifi-
cation (FDI) is then applied by using residual analysis
and geometrical tests.
In this study a continuous kraft cooking applica-
tion is investigated. Most of the kraft pulp is produced
in the continuous digesters (Gullichsen, 2000). In a
typical chemical pulping process, the pre-treated and
penetrated wood chips are fed into the impregnation
vessel and pulp digester where lignin is removed from
the chips with the aid of chemical reactions. The main
active variables for the Kappa number are tempera-
ture, alkali concentration, cooking (residence) time
and the wood species. The main lignin removal takes
place in the cooking zone in the digester, where the
temperature is significantly higher than in the impreg-
nation vessel.
Applied Kappa number model (Gustafson’s
Kappa number model (Gustafson et al., 1983)) is also
used in the real-time Kappa number modeling. The
results for the conventional cooking process are pre-
sented in paper (Rantanen et al., 2003) and in the
Downflow Lo-Solids
T M
cooking process in paper
(Rantanen et al., 2005).
In earlier study by the authors (Ahvenlampi et al.,
2006), the proposed system was applied for the con-
ventinal kraft cooking process. In this paper, the same
approach is tested with Downflow Lo-Solids
T M
kraft
cooking process.
The aim of this approach has been to improve
the Kappa number control by combining diagnosis
(Ahvenlampi and Kortela, 2005) and new control
strategy for Kappa number control (Rantanen, 2006).
The used monitoring method is self-organizing map
(SOM) (Kohonen, 1997). The evaluation of the prob-
lems in the process is performed by quantization error.
If the quantization error is notable, the Kappa number
prediction has been stopped.
The blow line Kappa number is predicted before
cooking zone. Thus, the cooking temperature can be
controlled. In the Kappa number control strategy, the
cooking temperature’s set point is determined by us-
ing only the Kappa number model.
The structure of the paper is an following. The
methods used are presented in chapter 2. The pro-
posed fault tolerant control system is presented in the
chapter 3. Case study is considered in chapter 4 and
discussion and conclusions are shown in chapters 5
and 6.
2 METHODS USED
In this chapter, methods used are presented. Em-
pirical and experimental methods were applied.
Gustafson’s Kappa number model is an empirical
model for delignification. The monitoring method,
SOM, (Kohonen, 1997) is also presented.
2.1 Gustafson’s Kappa Number Model
Gustafson et al. (Gustafson et al., 1983) have derived
a mathematical model consisting of a series of dif-
ferential equations describing the combined diffusion
and kinetics within a wood chip during the kraft pulp-
ing process.
The lignin removal in the impregnation vessel can
be calculated using Gustafson’s Kappa number model
for the initial phase. The rate equation for the initial
phase delignification is:
dL
dt
= k
il
e
(17.5−8760/T )
L (1)
where L is the lignin content at time t,
k
il
is a species specific constant and
T is temperature in Kelvin.
The rate equation for the bulk phase (cooking
zone) delignification is:
∂L
∂t
= k
0bl
e
(A
l
−B
l
/T )
OH
−
L + (2)
k
1bl
e
(A
2
−B
2
/T )
OH
−
0.5
HS
−
0.4
L,
where [OH
−
] is the hydroxyl ion concentration,
[HS
−
] is the hydrosulphide ion concentration and
k
0bl
, k
1bl
, A
1
, A
2
, B
1
and B
2
are species specific
constants.
The relative reaction rate is higher in the bulk
phase than in the other phases.
Residual delignification happens in the washing
zone and it is formulated as:
∂L
∂t
= k
rl
e
(19.64−10804/T )
OH
−
0.7
L, (3)
where k
rl
is a species specific constant for residual
delignification.
The relative rate decreases, and the effect of hy-
droxyl ion concentration decreases in the residual
phase. Parameters k
x
, A
x
and B
x
are presented in
(Rantanen, 2006).
ICINCO 2007 - International Conference on Informatics in Control, Automation and Robotics
162
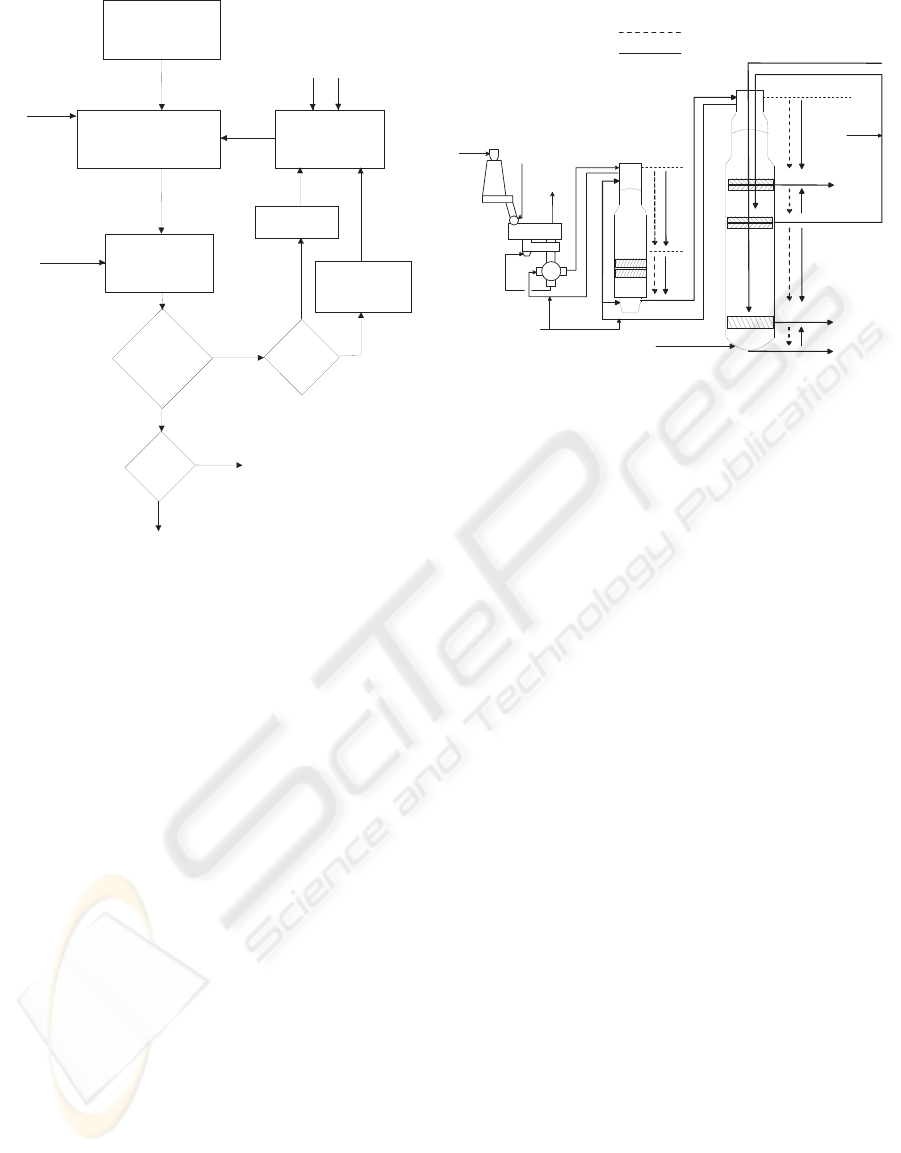
K a p p a n u m b e r
p r e d i c t i o n (
i
= 1 ) o r
i t e r a t i o n m o d e l (
i
> 1 )
T
p r e d i c t e d
b l o w - l i n e
K a p p a #
b l o w - l i n e
K a p p a #
t a r g e t
R e a l - t i m e
K a p p a n u m b e r
m o d e l
n o
y e s
d i f f =
p r e d i c t e d K # -
K # t a r g e t
d T =
f (
d i f f
)
T + d T
E A + d E A
i s
a b s ( d i f f )
< s i g m a
?
T _ s e t p o i n t = T _ s e t p o i n t
k - 1
E A _ s e t p o i n t = E A _ s e t p o i n t
k - 1
p r o c e s s d a t a a t
p r e d i c t i o n p o i n t
E A
i s
i
= 1 ?
d E A =
f (
d i f f
)
y e s
n o
d T =
f (
d i f f
)
i s
i
= 1 ?
y e s
T _ s e t p o i n t = T + d T
E A _ s e t p o i n t = E A + d E A
n o
p r o f i l e s b e f o r e
p r e d i c t i o n p o i n t
i
= 1
i
=
i
+ 1
Figure 1: Structure of the new Kappa number control strat-
egy.
2.2 Self-organizing Map
The SOM (Kohonen, 1997) is an unsupervised artifi-
cial neural network. The network is normally a two-
dimensional mapping / projection of the data group.
The visualization of the map is easier with a two-
dimensional map. In the training of the SOM net-
work, data points are sequentially introduced to the
SOM. In each iteration, the SOM neuron which is
closest to the input unit is selected by the equation
(4). This unit is the Best Matching Unit (BMU) or
winner.
kz − c
c
k = min
i
{kz − c
i
k} (4)
where z is input vector,
c
c
is the selected center, Best Matching Unit
(BMU), and
c
i
is the current center in the evaluation.
The weight vectors are updated using the follow-
ing formula. Only the weight vectors which are inside
the neighborhood radius h
ci
, are updated.
c
i
(t + 1) = c
i
(t) + h
ci
(t) [z (t) − c
i
(t)] (5)
I
2
D
1
D
2
D
3
D
4
U p p e r e x t r a c t i o n
C o o k i n g
c i r c u l a t i o n
L o w e r e x t r a c t i o n
B l o w - l i n e
C h i p s
L i q u o r
W a s h i n g l i q u o r
W a s h i n g l i q u o r
F e e d
c i r c u l a t i o n
F e e d c i r c u l a t i o n
T 1
T 2
T 3 ,
A 2
T 4
T 5 , A 3
T 6 , A 4
T 7 , A 5
T 8
C h i p s
S t e a m
E x h a u s t
( a )
( c )
( d )
( e )
( b )
( a ) = c h i p b i n
( b ) = c h i p m e t e r
( c ) = l o w p r e s s u r e f e e d e r
( d ) = s t e a m i n g v e s s e l
( e ) = h i g h p r e s s u r e f e e d e r
( f ) = i m p r e g n a t i o n v e s s e l
( g ) = d i g e s t e r
( f )
( g )
W h i t e
l i q u o r , A 1
W h i t e
l i q u o r , A 1
I
1
Figure 2: Impregnation vessel and continuous cooking di-
gester.
3 KAPPA NUMBER CONTROL
In industrial plants, the Kappa number control is usu-
ally performed by the H-factor (Vroom, 1957). The
H-factor expresses the cooking temperature and time
as a single variable. Based on the difference between
the predicted Kappa number and the Kappa number
target the H-factor and temperature profile are cor-
rected. One weakness of the H-factor is that depend-
ing on the variations in chip quality etc. different H-
factors are needed, although the process conditions
were otherwise the same. To overcame this prob-
lem new methods have been introduced. In this pa-
per, Kappa number control strategy with and without
a fault tolerant part is presented.
3.1 Kappa Number Control Strategy
New Kappa number control strategy is presented in
study (Rantanen, 2006). In the approach, only Kappa
number model is applied. That is the main difference
compared to the use of Vroom’s H-factor and Hatton’s
Kappa number model (Hatton, 1973). Thus, no sepa-
rate models are needed to cover the effects of temper-
ature, chemical concentrations and cooking time. The
control of the alkali profile could also be improved by
using the Kappa number model. In this paper, only
temperature control is considered.
The procedure of the strategy is depicted in Fig-
ure 1. The blow line Kappa number is predicted be-
fore the cooking zone - in the middle of the Downflow
Lo-Solids
T M
digester (Figure 2). Predicted tempera-
ture and alkali profiles of the cooking zone, and on-
line modelled Kappa number profile and process data
ENHANCING KAPPA NUMBER CONTROL IN DOWNFLOW LO-SOLIDSTM DIGESTER USING DIAGNOSIS
AND MODELLING
163
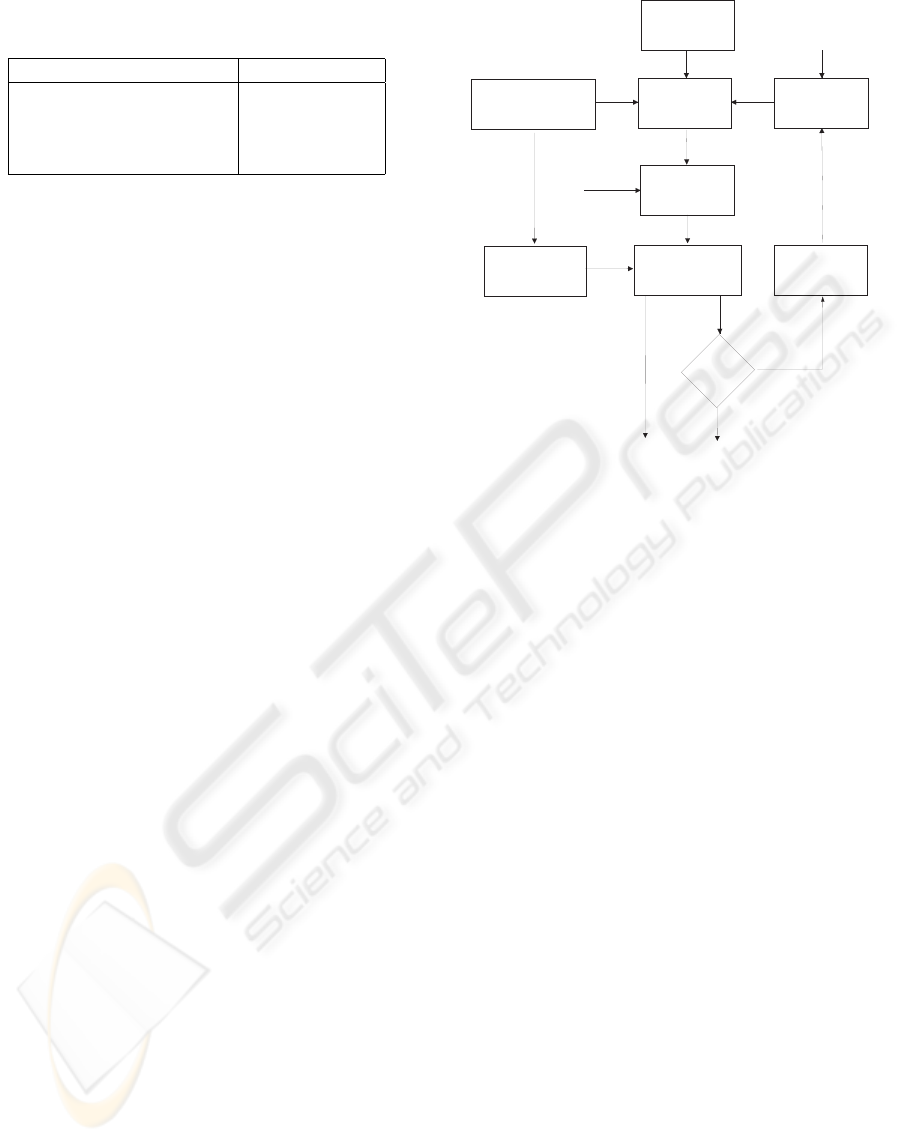
Table 1: Variables for the monitoring system before cooking
zone (BCZ).
Variable Unit
Alkali concentration BCZ g/l (Na
2
O, EA)
Temperature BCZ K
Production rate BCZ adt/d
Kappa number BCZ
before cooking zone are used as inputs to the Kappa
number prediction model. New temperature set point
is solved iteratively based on the difference between
the predicted and target blow line Kappa numbers.
Also other process conditions, especially alkali pro-
file, can be more precisely taken into account in the
applied strategy.
3.2 Fault Tolerant Kappa Number
Control Strategy
The fault tolerant control system (see structure in Fig-
ure 3) is formulated by the combination of diagno-
sis and control of the Kappa number in the continu-
ous cooking plant. The self-organizing map (SOM)
is applied for the monitoring purposes. The SOM is
trained with normalized data. The inputs for the mon-
itoring system are presented in Table 1. The quanti-
zation errors are used in the coloring of the trends of
the measured inputs and the predicted Kappa number.
With the aid of the diagnosis part the problematic
process conditions and measurement failures can be
detected. If the process is not in the good operation
area, the control of the Kappa number can be stopped
and keep in the current state for the period of the poor
operation. This ensures that the corrections are not
done into wrong directions and there is not too strong
corrections (overshoot).
Without monitoring problems can occur, due to
the residence time between the cooking tempera-
ture control point (before cooking zone) and on-line
Kappa number measurement. Inaccurate control can
also bring other difficulties into the process. One of
the problems is faulty packing in the digester. Faulty
packing can occur, if the chips are cooked too long or
too short a time. Due to the problems, also the shut-
down of the process is possible.
4 CASE STUDY
Case study is Downflow Lo-Solids
T M
Kamyr process
consisting of an impregnation vessel and a steam /
liquor phase digester (Figure 2). The chips are im-
pregnated in the impregnation vessel (I1-I2) and in the
K a p p a #
m o d e l
T
p r e d i c t e d
K a p p a #
T e m p e r a t u r e
a n d a l k a l i
m o d e l s
T + d T
K a p p a #
t a r g e t
n o
y e s
d i f f =
p r e d i c t i o n -
t a r g e t
d T = f ( d i f f )
i s d i f f <
s i g m a 2 ?
T _ s e t p o i n t = T + d T
S O M a n d c o l o r
c o d e s
I s q u a n t i z a t i o n
e r r o r < s i g m a 1 ?
n o
y e s
M e a s u r e d p r o c e s s
d a t a b e f o r e c o o k i n g
z o n e
T _ s e t p o i n t = p r e v i o u s ( T _ s e t p o i n t )
v i s u a l i s e d p r e d i c t e d K a p p a # =
p r e v i o u s ( v i s u a l i s e d p r e d i c t e d K a p p a # )
Figure 3: Structure of the fault tolerant Kappa number con-
trol system.
first zone (D1) of the digester. Between upper extrac-
tion and cooking circulation there is a counter-current
washing zone (D2). In this zone, black liquor is dis-
placed with cooking circulation liquor which temper-
ature and alkali concentration are high. The lignin is
mainly removed in the comparatively long co-current
cooking zone (D3). At the bottom of the digester there
is a short washing zone. Softwood chips mainly con-
sist of pine chips with a small amount of spruce chips.
Hardwood chips consist mainly of birch chips with a
small addition of aspen chips.
In Downflow Lo-Solids
T M
cooking, the Kappa
number control is mainly performed by the cooking
zone temperature and alkali in the middle of the di-
gester (prior to D3).
In this study, fault tolerant control system is used
for monitoring and control purposes in Downflow Lo-
Solids
T M
continuous cooking digester. The inputs to
the system are monitored and the blow line Kappa
number is controlled. The blow line Kappa number
is predicted at the middle of the digester by using
prediction model (Gustafson’s Kappa number model)
and the new temperature setpoint is calculated. The
study is carried out in Matlab environment using mea-
surements from the industrial continuous kraft cook-
ing application.
The monitoring is carried out by using SOM. The
modeling data (about one month data) was collected
from the industrial continuous digester during its nor-
mal operation. The outliers and faulty measurements
ICINCO 2007 - International Conference on Informatics in Control, Automation and Robotics
164
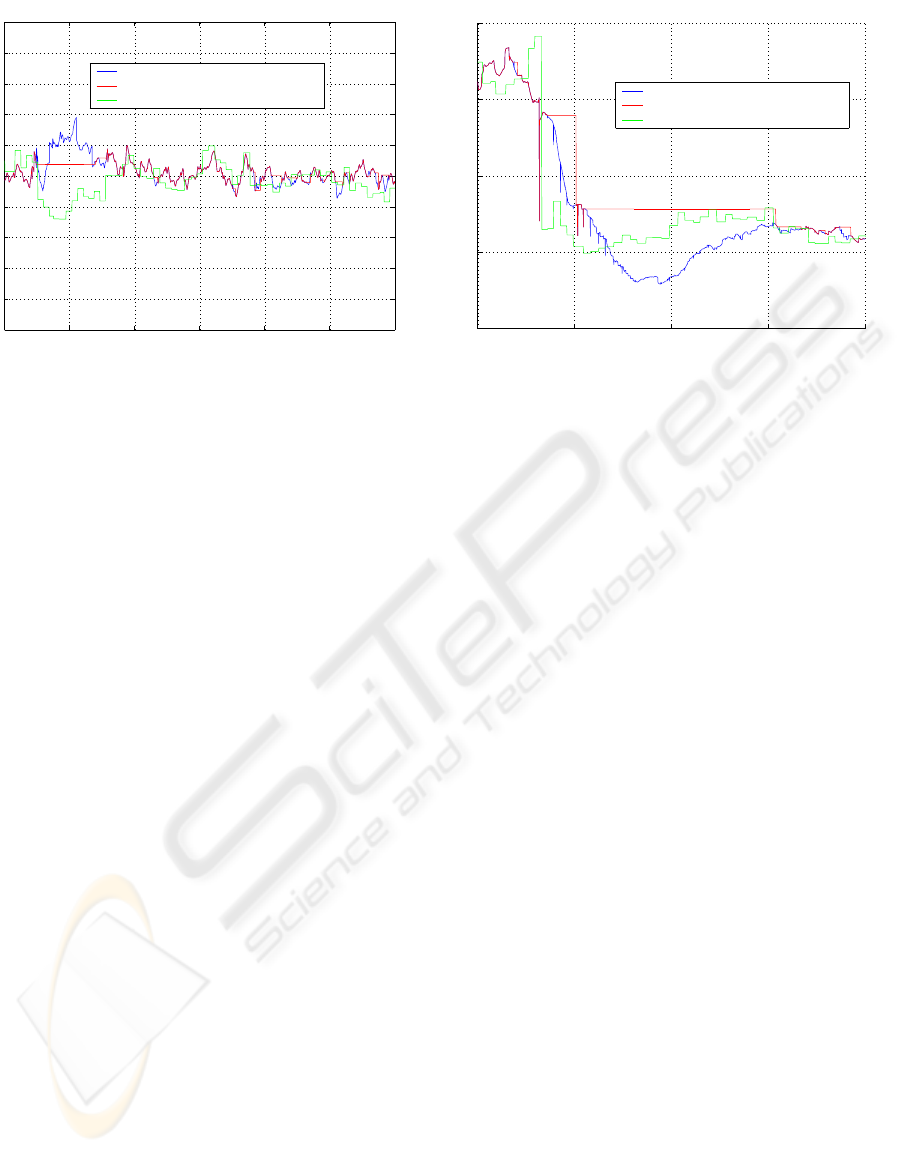
0 500 1000 1500 2000 2500 3000
Validation period 1
Time (min)
Kappa number
Kappa prediction
Kappa prediction with monitoring
on−line Kappa measurement
Figure 4: Validation period 1.
are filtered out from the data. The inputs are tem-
perature, alkali, lignin content (Kappa number) and
production rate before the cooking zone. The system
is validated with the data from the same industrial di-
gester, but from the different time periods.
In the Figures 4 - 6, are presented validation re-
sults of the proposed system. The monitoring system
indicates, whether the prediction can be trusted or not.
The stopping of the prediction is shown in Figure 4 in
the time period 250-750.
Other example is shown in Figure 5, where the
prediction after the grade change has not been good
and it has shifted into wrong direction. The monitor-
ing system has indicated problems in the process and
the prediction has been stopped in time period 600-
1500.
The same kind of example is shown in Figure 6.
The prediction has been stopped for the period 600-
1100.
5 DISCUSSION
The sampling interval of the on-line Kappa number
measurements is about half an hour. Hence, it is use-
ful to also get continuous information about quality
properties. The accurate control can decrease signifi-
cantly problems in the digester. The proposed system
is a combination of diagnosis, prediction and control
of Kappa number in the continuous kraft pulping di-
gester. This kind of systems can be very helpfull for
the operators.
The proposed fault tolerant control system gives
new information for the control and the control ac-
tions are not taken into wrong directions as seen in
Figure 4. In Figure 4 in time step 250-750, the pre-
0 500 1000 1500 2000
Validation period 2
Time (min)
Kappa number
Kappa prediction
Kappa prediction with monitoring
on−line Kappa measurement
Figure 5: Validation period 2.
diction without monitoring is shifted dramatically too
up and the control action would have been too strong
into wrong direction. This has been avoided using
monitoring and the stopping of the prediction.
In the Figures 5 and 6, are shown examples when
there has been problems in the process after the grade
change from softwood to hardwood. Diagnosis sys-
tem has indicated problems and the Kappa number
prediction has been stopped for these faulty periods.
In the validaton period 2 (Figure 5), the prediction is
stopped for the period 600-1500 and in the validation
period 3 (Figure 6) for the period 600-1100.
The approach has been tested using the data
from the industrial Downflow Lo-Solids
T M
continu-
ous cooking digester. Although the results are good,
more research is needed to ensure the proper func-
tioning of the proposed system in all operation points.
Both prediction and diagnosis parts need some devel-
opment in the future.
6 CONCLUSION
In this study, the combination of empirical and ex-
perimental methods for the diagnosis and monitoring
of Kappa number control in Downflow Lo-Solids
T M
cooking application was considered. Modeling and
prediction of the Kappa number is applied using
Gustafson’s Kappa number model. The SOM is used
to monitor the usability of the modelling and predic-
tion results. The quality control is applied by con-
trolling the temperature at the middle of the digester
(before cooking zone) using diagnosis results and the
prediction of the Gustafson’s Kappa number model.
Good results were achieved using the approach.
ENHANCING KAPPA NUMBER CONTROL IN DOWNFLOW LO-SOLIDSTM DIGESTER USING DIAGNOSIS
AND MODELLING
165
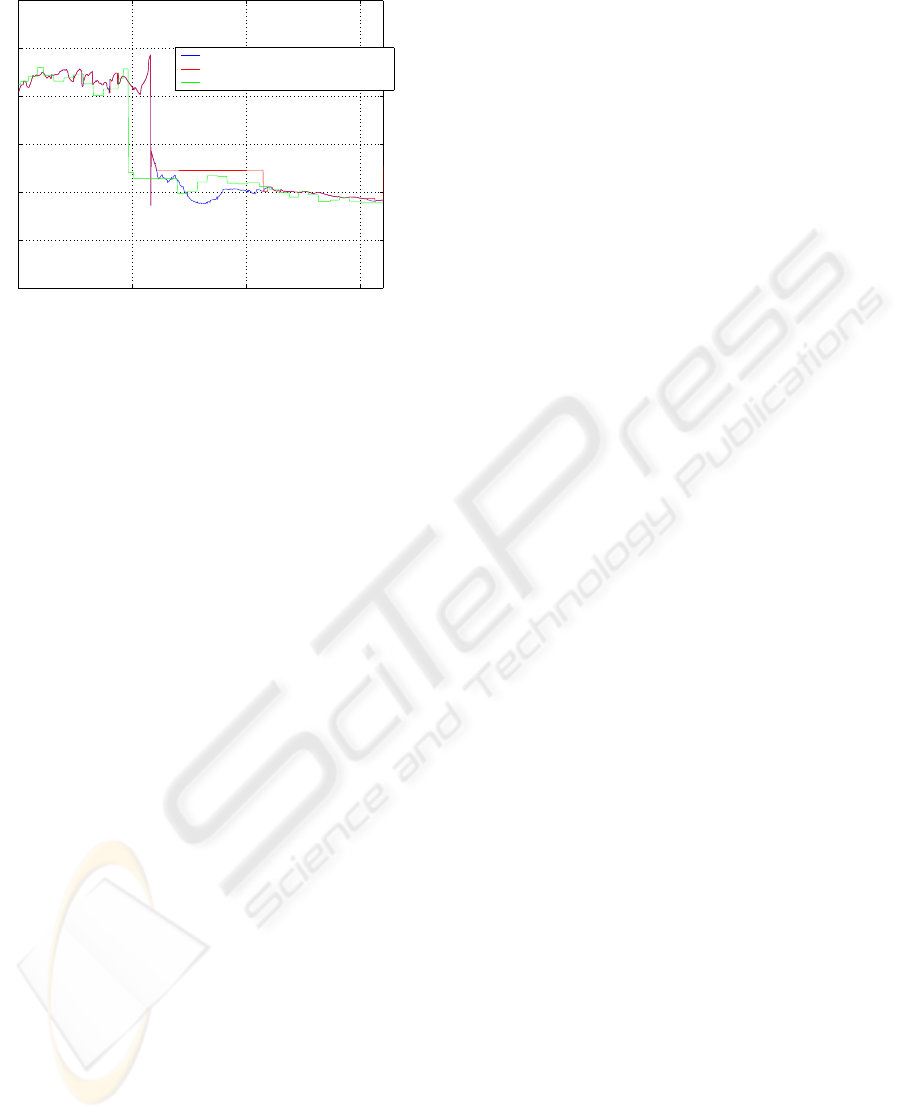
0 500 1000 1500
Validation period 3
Time (min)
Kappa number
Kappa prediction
Kappa prediction with monitoring
on−line Kappa measurement
Figure 6: Validation period 3.
ACKNOWLEDGEMENTS
This research study was funded by The Acedemy of
Finland, Mets
¨
a-Botnia Oy, Andritz Oy, Stora Enso
Oyj, Metso Automation Oy and the Finnish Funding
Agency for Technology and Innovation (Tekes). The
authors would like to thank the partners for the special
knowledge and process data provided.
REFERENCES
Ahvenlampi, T. and Kortela, U. (2005). Clustering algo-
rithms in process monitoring and control application
to continuous digesters. Informatica, 29(1):99–107.
Ahvenlampi, T., Rantanen, R., and Tervaskanto, M. (2006).
Fault tolerant control application for continuous kraft
pulping proces. In 6
th
IFAC Symposium on Fault
Detection, Supervision and Safety of Technical Pro-
cesses, Beijing, PR China.
Ahvenlampi, T., Tervaskanto, M., and Kortela, U. (2005).
Diagnosis system for continuous cooking process. In
16
th
IFAC World Congress, Prague, Czech Republic.
Blanke, M., Kinneart, M., Lunge, J., and Staroswiecki,
M. (2003). Diagnosis and Fault-Tolerant Control.
Springer-Verlag, Berlin.
Dash, S., Rengaswamy, R., and Venkatasubramanian, V.
(2003). Fuzzy-logic based trend classification for fault
diagnosis of chemical processes. Computers & Chem-
ical Engineering, 27:347–362.
Gullichsen, J. (2000). Chemical engineering principles of
fiber line operations. In Gullichsen, J. and Fogelholm,
C.-J., editors, Chemical Pulping. Papermaking Sci-
ence and Technology, Book 6A. Fapet Oy, Jyv
¨
askyl
¨
a,
Finland.
Gustafson, R. G., Sleicher, C. A., McKean, W. T., and Fin-
layson, B. A. (1983). Theoretical model of the kraft
pulping process. Ind. and Eng. Chem., Process Design
and Development, 22(1):87–96.
Hatton, J. V. (1973). Development of yield prediction equa-
tions in kraft pulping. Tappi J., 56(7):97–100.
Isermann, R. (1997). Supervision, fault-detection and fault-
diagnosis methods - an introduction. Control Engi-
neering Practice, 5(5):639–652.
Kohonen, T. (1997). Self-Organizing Maps. Springer-
Verlag, Berlin, Germany, second edition.
Leivisk
¨
a, K. (2000). Process Control. Papermaking Sci-
ence and Technology, Book 14. Fapet Oy, Helsinki,
Finland.
Mahmoud, M., Jiang, J., and Zhang, Y. (2003). Active
Fault Tolerant Control Systems. Lecture Notes in
Control and Information Sciences. Springer-Verlag,
Berlin, Germany.
Puranen, T. (1999). Jatkuvatoimisen sellukeittimen
h
¨
airi
¨
ontunnistus sumealla logiikalla (in finnish). In
Automation’99 -Seminar, pages 406–411, Helsinki,
Finland.
Qian, Y., Li, X., Jiang, Y., and Wen, Y. (2003). An ex-
pert system for real-time fault diagnosis of complex
chemical processes. Expert Systems with Applica-
tions, 24:425–432.
Rantanen, R. (2006). Modelling and control of cooking de-
gree in conventional and modified continuous pulping
processes. PhD thesis, University of Oulu, Oulu.
Rantanen, R., Ahvenlampi, T., and Kortela, U. (2003).
Kappa number profile in continuous cooking - ap-
plying Gustafson’s model to softwood and hardwood
pulping process. In 4
th
Biennial Johan Gullichsen
Colloquium, pages 83–92, Espoo, Finland.
Rantanen, R., Simil
¨
a, E., and Ahvenlampi, T. (2005). Mod-
eling of kappa number in Downflow Lo-Solids
T M
cooking using Gustafson’s model. Pulp & Paper
Canada, 106(5).
Simani, S. and Patton, R. J. (2002). Model-based data-
driven approach to robust fault diagnosis in chem-
ical processes. In 15th Triennial World Congress,
Barcelona, Spain. IFAC.
Tervaskanto, M., Ahvenlampi, T., Rantanen, R., and Ko-
rtela, U. (2005). Fault diagnosis of continuous cook-
ing process using intelligent sensors. In NeCST Work-
shop, pages 187–192, Ajaccio, France.
Venkatasubramanian, V., Rengaswamy, R., and Kavuri,
S. N. (2003a). A review of process fault detection and
diagnosis part II: Qulitative models and search strate-
gies. Computers & Chemical Engineering, 27:313–
326.
Venkatasubramanian, V., Rengaswamy, R., Yin, K., and
Kavuri, S. N. (2003b). A review of process fault
detection and diagnosis part I: Quantitative model-
based methods. Computers & Chemical Engineering,
27:293–311.
Vroom, K. E. (1957). The h-factor, a means of expressing
cooking times and temperatures as a single variable.
Pulp. Pap. Mag. Can., 58(3):228–231.
ICINCO 2007 - International Conference on Informatics in Control, Automation and Robotics
166
