
A MULTI-MODEL APPROACH FOR BILINEAR GENERALIZED
PREDICTIVE CONTROL
Anderson Luiz de Oliveira Cavalcanti
Informatic and Industry Academic Department, CEFET, Natal/RN, Brazil
André Laurindo Maitelli
Department of Computation and Automation, UFRN, Campus Universitário S/N, Natal/RN, Brazil
Adhemar de Barros Fontes
Department of Electrical Engineering,UFBA, Rua Aristides Novis, 04, Salvador/BA, Brazil
Keywords: Model Predictive Control, Multi-Model, Distillation Column.
Abstract: This paper presents a contribution in multivariable predictive control. A new approach of multi-model based
control is presented. The controller used is the quasilinear multivariable generalized predictive control
(QMGPC). A metric based in 2-norm is presented in order to build a global model using local models.
Simulation results in a distillation column, with a comparative analysis, are presented.
1 INTRODUCTION
The multi-model approach has been presented as an
alternative method to be applied is systems that
operate in a long range (Aslan et al., 2004). When a
process operates in a long range, due to non-
linearities, usually the parametric variation of its
models is large. For this reason, usually, a controller
based in just one model has poor performance in
these kind of process.
The basic idea of multi-model approach is to
identify a set of models (one for each operating
regime in a chosen trajectory) and to interpolate
these models (through an interpolation function).
Other approach calculates a suitable control effort as
a wheighting sum of each control effort (in each
designed controller for each operating regime).
Some approches use space state models like
(Azimadeh et al., 1998) and (Foss et al., 1995). In
(Azimadeh et al., 1998) a set of linear space state
models is chosen in a given trajectory. In (Foss et
al., 1995) a set on nonlinear space state models is
chosen (and a nonlinear predictive controller is
designed).
A closed loop metric, that guarantee the global
stability, is proposed in (Aslan et al., 2004). In that
case, a set of PI controllers is projected and, for each
instant, the distance from the current point in a
chosen trajectory to a tabled operating regime is
calculated.
In this paper, a similar idea to (Foss et al., 1995)
is proposed. In this case, a set of local bilinear
models is identified. The global model is build with
a wheigthing sum of the identified local models. The
wheigthing factor is calculated based in a proposed
metric. This metric consists of use a 2-norm to
measure the distance from the current point (in a
chosen monotonic trajectory) and a tabled operating
regime. A case study in a debutanized distillation
column is presented in order to show an application
of the proposed controller.
The next step of this research is the stability and
robustness analisys (to presents a stable algorithm
proposal).
289
Luiz de Oliveira Cavalcanti A., Laurindo Maitelli A. and de Barros Fontes A. (2007).
A MULTI-MODEL APPROACH FOR BILINEAR GENERALIZED PREDICTIVE CONTROL.
In Proceedings of the Fourth International Conference on Informatics in Control, Automation and Robotics, pages 289-295
DOI: 10.5220/0001617202890295
Copyright
c
SciTePress

2 MULTIVARIABLE MULTI-
MODEL
The designed controller is based in quasilinear
multivariable generalized predictive control
(QMGPC). This controller is based in multivariable
bilinear NARIMAX (Non Linear, Auto-Regressive,
Moving Average, with exogenous input) models.
The basic idea of QMGPC algorithm is calculate
a control effort sequence, based in the minimization
of a multi-step objective function, in a defined
prediction horizon.
2.1 Multivariable Multi-Model
The multivariable multi-model bilinear NARIMAX
model with p-inputs and q-outputs is given by:
)()(
)1()()()]1([)(
)1()()()()()(
1)(
11
)(
1
)(
11)(11)(
keqC
kyqqDkuDqD
kuqqBkyqqA
k
q
k
d
k
e
p
k
q
k
−
−−−
−−−−
+−Δ−
+−Δ=Δ
(1)
where
q
Rky ∈)( is the process output vector,
p
Rku ∈)( is the process input vector and
q
Rke ∈)(
is the gaussian white noise with zero mean and
covariance
)(
2
σ
diag . The matrices )(
1)( −
qA
k
,
)(
1)( −
qB
k
and )(
1)( −
qC
k
are polynomials matrices in
shift operator
1−
q
and are defined by:
na
k
na
k
qq
k
qAqAIqA
−−
×
−
+++=
)(
1
)(
1
1)(
)( "
(2)
nb
k
nb
kk
k
qBqBBqB
−−−
+++=
)(
1
)(
1
)(
0
1)(
)( "
(3)
nc
k
nc
k
pp
k
qCqCIqC
−−
×
−
+++=
)(
1
)(
1
1)(
)( "
(4)
d
d
nd
k
ndd
k
d
k
d
k
d
qDqDDqD
−
−−
+++=
)(
,
1
)(
1,
)(
0,
1
)(
)( "
(5)
e
e
nd
k
nde
k
e
k
e
k
e
qDqDDqD
−
−−
+++=
)(
,
1
)(
1,
)(
0,
1
)(
)( "
(6)
where:
qqk
RqA
×−
∈)(
1)(
,
pqk
RqB
×−
∈)(
1)(
,
qqk
RqC
×−
∈)(
1)(
,
pq
k
e
RqD
×−
∈)(
1
)(
and
qp
k
d
RqD
×−
∈)(
1
)(
. The matrix
)]1([ −kuD is defined as:
⎥
⎥
⎥
⎥
⎥
⎦
⎤
⎢
⎢
⎢
⎢
⎢
⎣
⎡
−
−
−
=−
)1(00
0)1(0
00)1(
)]1([
2
1
ku
ku
ku
kuD
p
"
#%##
"
"
(7)
The generic polynomial matrix
)(
1)( −
qP
k
in (1)
represents this matrix in instant
k.
The first step to build (1) is decompose the
system's operating range into a number of operating
regimes that completely cover the chosen trajectory.
Second, for each operating regime, a local model
structure must be developed as showed in (Foss
et
al.
, 1995). In this case, the model structure is chosen
by using the Akaike criterion.
The last step is to identify the parameter's model
for each local model. The estimation algorithm is the
Multivariable Recursive Least Squares (MRLS).
2.2 Building the Global Model
The global model is built as a weighting sum of the
bilinear models in each chosen operating regime.
The generic polynomial matrix
)(
1)( −
qP
k
is built as:
∑
=
−−
=
NOR
i
kii
k
wqPqP
1
,
1
)(
1)(
)()(
(8)
where
)(
1
)(
−
qP
i
is the polynomial matrix in i
th
operating regime,
ki
w
,
is the i
th
weighting factor
calculated in instant
k, NOR is the number of
operating regimes. The computation of
ki
w
,
is
showed in the section 3 of this paper.
2.3 The Quasilinear Multivariable
Multi-Model
The nonlinear model presented in (1) is
quasilinearized to be used in QMGPC (Quasilinear
Multivariable Generalized Predictive Control). The
multivariable quasilinear multi-model must be
obtained by rewriting the expression (1) of the
following form:
)()()1()()(
)()(),(
1)(1)(1
11)(
keqCkuqqB
kyquqA
k
p
k
q
k
−−−
−−
+−Δ
=Δ
(9)
where:
)()]1([)(
)(),(
1
)(
1
)(
1)(1)(
−−
−−
−
−=
qDkuDqD
qAuqA
k
d
k
e
kk
(10)
The polynomial matrix
),(
1)(
uqA
k −
is calculated
considering its parameters as constant in prediction
ICINCO 2007 - International Conference on Informatics in Control, Automation and Robotics
290

horizon. The polynomial matrix )(
1)( −
qA
k
is
considered diagonal in this paper.
2.4 The Predictor
The output prediction i-step ahead may be calculated
multiplying the expression (1) for
i
q
as in the
following expression:
)()()1()()(
)(),(
~
1)(11)(
1)(
ikeqCikuqqB
ikyuqA
k
p
k
k
++−+Δ
=+
−−−
−
(11)
where
)(),(),(
~
11)(1)( −−−
Δ= quqAuqA
q
kk
.
In this case, the polynomial matrix
pp
IqC
×
−
=)(
1
is uncorrelated (white noise). Considering the
following Diophantine equation:
),(),(
~
),(
1
)(
1)(1
)(
uqFquqAuqEI
k
i
ik
k
ipp
−−−−
×
+=
(12)
where:
)1(
)(
1,
)(
,
1
)(
)()(),(
−−
−
−
++=
i
k
ii
k
oi
k
i
quEuEuqE "
(13)
na
k
nai
k
oi
k
i
quFuFuqF
−−
++= )()(),(
)(
,
)(
,
1
)(
"
(14)
Pre-multiplying (11), with
pp
IqC
×
−
=)(
1
, for
),(
1
uqE
i
−
we obtain:
)(),(
)1()()(),(
)(),(
~
),(
1
)(
11)(1
)(
1)(1
)(
ikeuqE
ikuqqBuqE
ikyuqAuqE
k
i
p
k
k
i
k
k
i
+
+−+Δ
=+
−
−−−
−−
(15)
Rewriting (12) of the following form:
),(),(
~
),(
111
uqFqIuqAuqE
i
i
ppi
−−
×
−−
−=
(16)
Substituting (16) in (15) we obtain:
+−+Δ
++=+
−−−
−−
)1()()(),(
)(),()(),()(
11)(1
)(
1
)(
1
)(
ikuqqBuqE
ikeuqEkyuqFiky
p
k
k
i
k
i
k
i
(17)
As the degree of
),(
1
)(
uqE
k
i
−
is 1−i , then the
sub-optimal prediction of
)( iky + is:
)1()()(),(
)(),()(
ˆ
11)(1
)(
1
)(
−+Δ
+=+
−−−
−
ikuqqBuqE
kyuqFiky
p
k
k
i
k
i
(18)
Make:
),(),()(),(
1
)(
1
)(
1)(1
)(
uqHquqHqBuqE
k
ipa
i
k
i
k
k
i
−−−−−
+=
(19)
As the degree of
),(
1
uqH
i
−
is less than 1
−
i ,
the predictor may be written as:
)1()(),(
)1()(),()(),()(
ˆ
11
)(
11
)(
1
)(
−+Δ
+−Δ+=+
−−
−−−
ikuquqH
kuquqHkyuqFiky
p
k
i
p
k
ipa
k
i
(20)
The last term of (20) considers the future inputs
(forced response) and the two first terms consider
only past inputs (free response). Define:
)(
11
)(
)1()(),()(
ˆ
k
lip
k
i
YikuquqHiky +−+Δ=+
−−
(21)
where:
)1()(),()(),(
11
)(
1
)()(
−Δ+=
−−−
kuquqHkyuqFY
p
k
ipa
k
i
k
li
(22)
2.5 The Objetive Function
The objective function is given by:
∑∑
==
−+Δ++−+=
NU
i
Q
NY
Ni
R
k
k
ikuikyikrJ
1
2
2
)(
1
)(
)1()(
ˆ
)(
(23)
where
1
N is minimum prediction horizon, NY is
prediction horizon,
NU is the control horizon,
)(k
R
and
)(k
Q are weighting matrices of error signal and
control effort in instant
k in the chosen trajectory,
respectively,
)(
ˆ
iky
+
is the sub-optimum i-step
ahead predicted output,
)( ikr + is the future
reference trajectory.
2.6 The Control Law
The control effort is obtained, without constraints,
by the minimization of the objective function. This
minimization is obtained by the calculation of its
gradient (making it equals zero), of the following
form:
0=
∂
∂
u
J
(24)
Consider the predictions set:
)(
)(
1
1
1
k
ylNNU
N
k
N
YuHy
yu
y
+=
(25)
A MULTI-MODEL APPROACH FOR BILINEAR GENERALIZED PREDICTIVE CONTROL
291

where:
[]
T
N
NYkyNkyNkyy
y
)(
ˆ
)1(
ˆ
)(
ˆ
11
1
++++= "
(26)
⎥
⎥
⎥
⎥
⎥
⎦
⎤
⎢
⎢
⎢
⎢
⎢
⎣
⎡
=
−−−
−+−
−−−
NUNY
k
NY
k
NY
k
NUN
k
N
k
N
k
NUN
k
N
k
N
k
k
N
HHH
HHH
HHH
H
yu
)(
2
)(
1
)(
1
)(
1
)()(
)(
2
)(
1
)(
)(
111
111
1
"
#%##
"
"
(27)
⎥
⎥
⎥
⎥
⎥
⎦
⎤
⎢
⎢
⎢
⎢
⎢
⎣
⎡
−+Δ
+Δ
Δ
=
−
−
−
)1()(
)1()(
)()(
1
1
1
NUkuq
kuq
kuq
u
p
p
p
NU
#
(28)
⎥
⎥
⎥
⎥
⎦
⎤
⎢
⎢
⎢
⎢
⎣
⎡
=
+
lNY
lN
lN
lN
Y
Y
Y
y
y
#
1
1
1
1
(29)
The objective function (23) may be rewritten of
the following form:
NUk
T
NUlNNUNk
T
lNNUN
uQuyuHRyuHJ
yyuyyu
)()(
)()(
1111
+++=
(30)
where:
],,[
)()(
1
)(
k
NYq
k
k
RRdiagR
×
= "
(31)
],,[
)(
)(
1
)(
NUp
k
k
k
QQdiagQ
×
= "
(32)
The computation of an element
)(k
i
x
of
)(k
R and
)(k
Q is given by:
∑
=
=
NOR
j
kjji
k
i
wxx
1
,,
)(
(33)
where
ji
x
,
is the i
th
element of weigthing matrix
(
)(k
R
or
)(k
Q ) for the j
th
operating regime and
ki
w
,
is the
i
th
weighting factor calculated in instant k.
The minimization of (30) produces the following
control law:
)()(
1111
1
yyuyuyu
lN
T
NN
T
N
yrRHQHHu −+=
−
(34)
Because of the receding control horizon, only the
first
p rows of (34) are computed.
3 THE PROPOSED METRIC
The proposed metric is based in a 2-norm. Norms, in
general, gives a notion of distance in a vectorial
space. In multivariable case, in a process with p-
inputs and q-outputs, the output is
q
Rky ∈)( and the
input is
p
Rku ∈)(
. In a known trajectory of process
output, the distance of the process’s output from the
first operating regime to the last operating regime is
given by:
2
1,1
yyd
NORNOR
−=
(35)
where
NOR
y is the process's output in last operating
regime and
1
y is the process's output in the first
operating regime.
To measure the distance from the current
process's output (in instant
k) to the i
th
operating
regime, we can use the expression:
NORi
yky
d
i
NOR
ki
,,1;
)(
2
,1
,
"=
−
=
δ
(36)
where
)(ky is the process's output in instant k and
i
y is the process's output to the i
th
operating regime.
The weighting factor for the
i
th
operating regime
in instant
k is given by:
NORiw
NOR
j
kj
ki
ki
,,1;
1
,
,
,
"==
∑
=
δ
δ
(37)
4 APPLICATION OF THE
MULTI-MODEL APPROACH
4.1 Distillation Column
In this paper, an application in a debutanizer
distillation column is showed. Debutaziner
distillation column is usually used to remove the
light components from the gasoline stream to
produce Liquefied Petroleum Gas (LPG). The
column is showed in Figure 1.
ICINCO 2007 - International Conference on Informatics in Control, Automation and Robotics
292
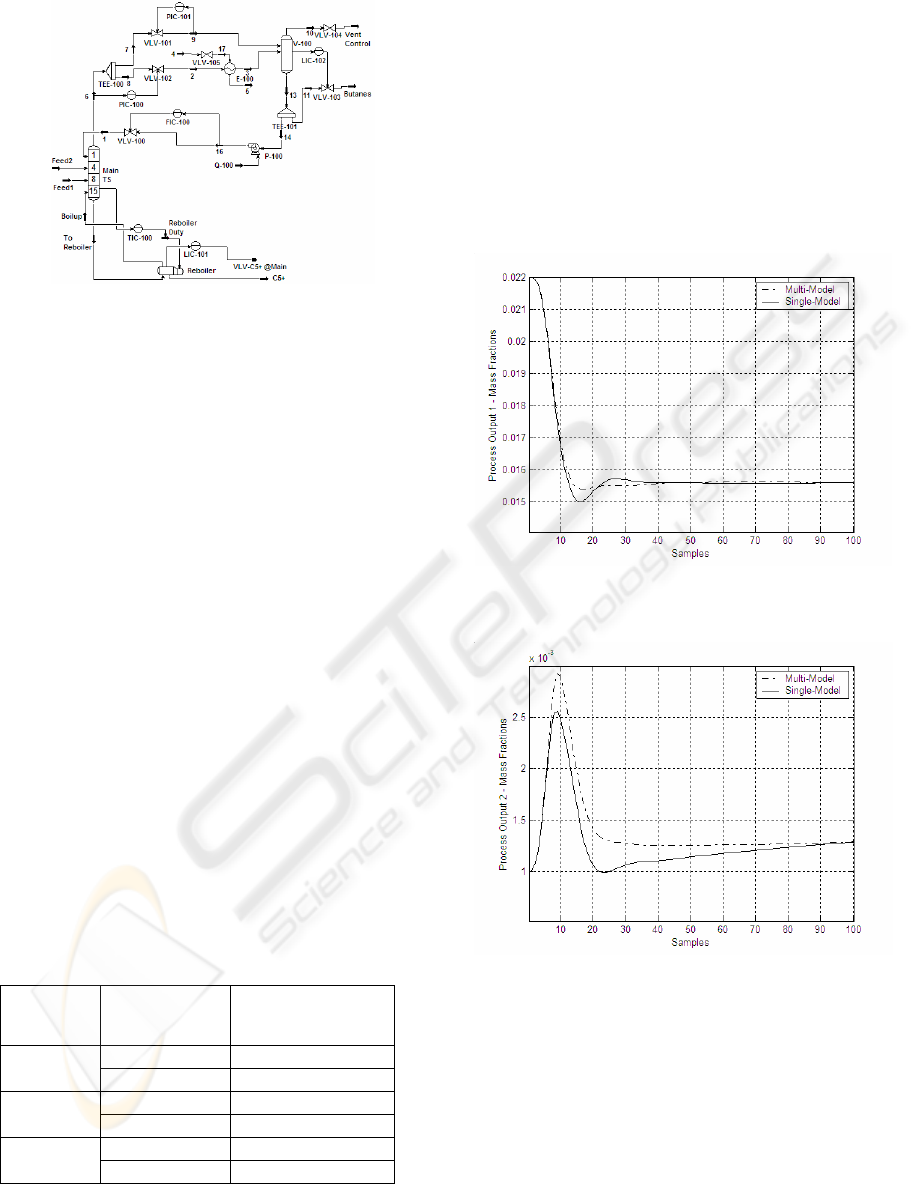
Figure 1: Distillation Column simulated in Hysys
Software.
The most common control strategy is to
manipulate the reflux flow rate and the temperature
in column's bottom and, to control the
concentrations of any product in
butanes stream and
in C5+ stream as showed in (Almeida,
et al., 2000)
and (Fontes, et al., 2006). The chosen process
variables are: concentration of i-pentane in butanes
stream (
y
1
) and concentration of i-butene in C5+
stream (
y
2
).
The reflux flow rate (
u
1
) is manipulated through
the FIC-100 controller and the temperature of
column's bottom (
u
2
) is manipulated through the
TIC-100 controller. The reflux flow rate is given in
m
3
/h and the temperature of column's bottom is
given in
o
C.
In this case study, three operation regime were
chosen, as showed in Table 1. The identified bilinear
models were obtained using the multivariable
recursive least squares algorithm and the model's
structure has been chosen by using the Akaike
criterion. In all models, the chosen sample rate is 4
minutes.
The trajectory of
1
y is monotonically increasing
and the trajectory of
2
y is monotonically
decreasing.
Table 1: Chosen Operating Regimes.
Operation
Regime
Input
Output
(Mass Fractions)
u
1
= 40 m
3
/h y
1
= 0.014413
1
u
2
= 147
o
C y
2
= 0.001339
u
1
= 37 m
3
/h y
1
= 0.017581
2
u
2
= 147.5
o
C y
2
= 0.001161
u
1
= 34 m
3
/h y
1
= 0.021994
3
u
2
= 148
o
C y
2
= 0.001004
The operating regimes must be chosen based in a
knowledge of the process.
4.2 Results
In this simulation, the process is in the 3
rd
operating
regime and a deviation in reference is applied in the
proposed controller. With this reference deviation,
the process will come to close to the 1
st
operating
regime. The proposed quasilinear multi-model is
compared with quasilinear single-model (using the
model of the 3
rd
operating regime). Figures 2 and 3
show the output comparison.
Figure 2: Process Output 1. Comparison between single-
model and multi-model approach.
Figure 3: Process Output 2. Comparison between single-
model and multi-model approach.
Figures 4 and 5 show the control effort
comparison between the quasilinear single-model
and multi-model approaches.
The figures show the better performance of
multi-model approach when compared with single-
model approach.
A MULTI-MODEL APPROACH FOR BILINEAR GENERALIZED PREDICTIVE CONTROL
293
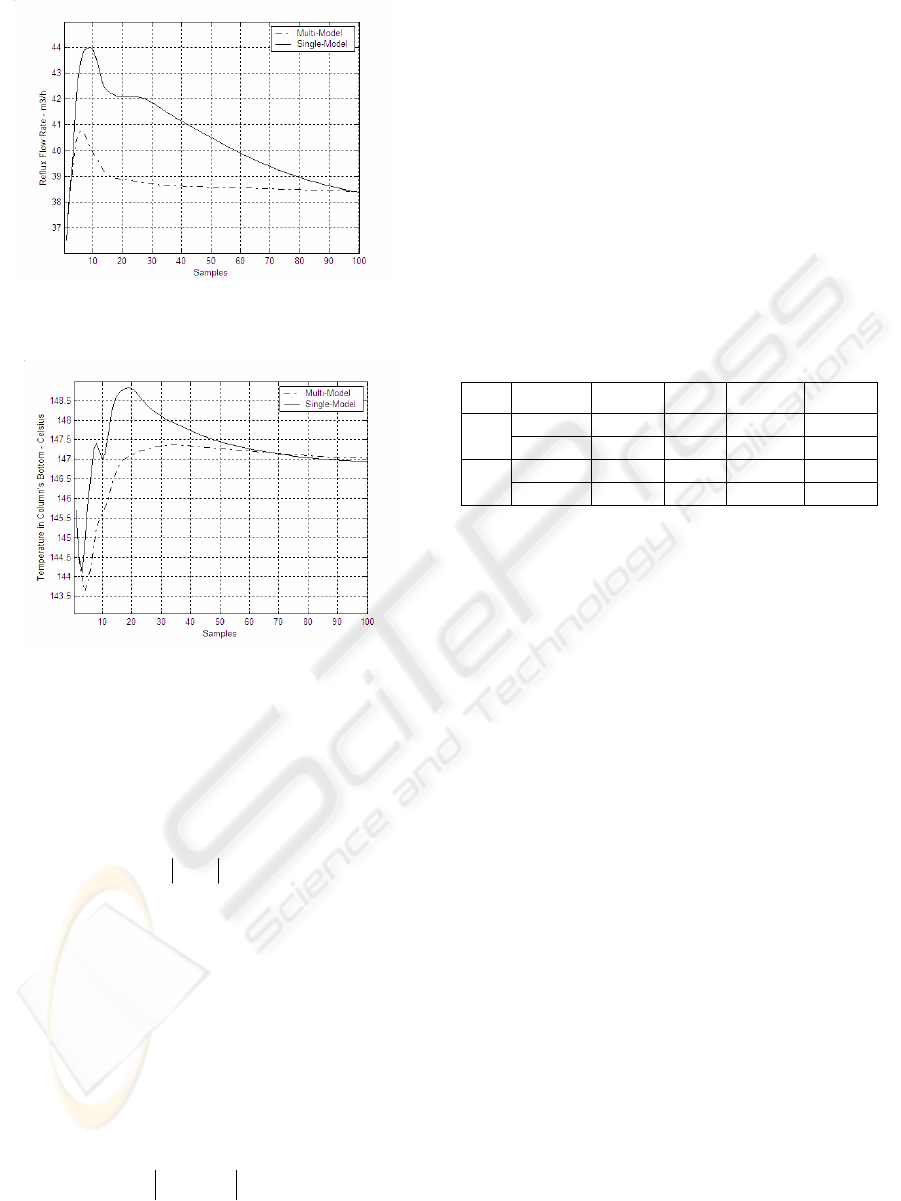
Figure 4: Reflux Flow rate. Comparison between single-
model and multi-model approach.
Figure 5: Temperature in column's bottom. Comparison
between single-model and multi-model approach.
In order to quantitatively asses the performance
of multi-model quasilinear GPC, some indices like
showed in (Goodhart,
et al., 1994) are calculated.
Theses indices may be extended to multivariable
case, of the following form:
Nku
ii
/)(
,1
∑
=
ε
(38)
where
pi ,,1 "= and N is the amount of control
effort applied in the process to achieve the desired
response. The index showed in (38) is the account of
total control effort to achieve a given response. The
variance of controlled actuators is:
Nku
iii
/))((
2
,1,2
∑
−=
εε
(39)
The deviation of the process of integral of
absolute error (IAE) is:
Nykr
jjj
/)(
,3
∑
−=
ε
(40)
where
qj ,,1 "= .
The overall measure of effectiveness is defined
as:
j
p
i
jiiiij ,3
1
,2,1
)(
ερεβεαε
∑
=
++=
(41)
where
qj ,,1 "
=
. The factors
i
α
,
i
β
and
j
ρ
are
weightings chosen to reflect the actual financial cost
of energy usage, actuator wear and product quality,
respectively. In this case, we consider
1.0
=
i
α
,
15.0
=
i
β
and 5.0
=
j
ρ
.
Table 2: Comparison of Performance indices between
Quasilinear single-model and Quasilinear multi-model
with N=100.
I/O Model
1
ε
2
ε
3
ε
ε
Single 40.47 2.61 499.46 269.00
1
Multi 38.72 0.31 486.20 261.80
Single 147.38 0.63 242.40 140.47
2
Multi 146.88 0.62 197.71 117.56
Table 2 shows the performance of quasilinear
multi-model approach in terms of less energy usage,
less actuator wear and better product quality in
relation to quasilinear single-model performance.
5 CONCLUSIONS
The multi-model approach is a good alternantive of
controller to systems that operate in a large
operation range. The indices has shown that this
approach presents better performance in relation of
quasilinear single model.
REFERENCES
Almeida, E., Rodrigues, M.A., Odloak, D., 2000. Robust
Predictive Control of a Gasoline Debutanizer Column.
Brazilian Journal of Chemical Engineering, vol. 17,
pp. 11, São Paulo.
Arslan, E., Çamurdan, M. C., Palazoglu, A. and Arkun,
Y., 2004. Multi-Model Control of Nonlinear Systems
Using Closed-Loop Gap Metric. Proceedings of the
2004 American Control Conference, Vol. 3, pp. 2374-
2378.
Azimadeh, F., Palizban, H.A. and Romagnoli, J. A., 1998.
On Line Optimal Control of a Batch Fermentation
Process Using Multiple Model Approach. Proceedings
of the 37
th
IEEE Conference on Decision & Control,
pp. 455-460.
ICINCO 2007 - International Conference on Informatics in Control, Automation and Robotics
294

Fontes, A., Maitelli, A.L., Cavalcanti, A. L. O. and
Angelo, E., 2006. Application of Multivariable
Predictive Control in a Debutanizer Distillation
Column. Proceedings of SICOP 2006 – Workshop on
Solving Industrial Control and Optimization
Problems, pp. 1-5.
Foss, B.A., Johansen, T.A. and Sorensen, A.V., 1995.
Nonlinear Predictive Control Using Local Models –
Applied to a Batch Fermentation Process. Control
Eng. Practice, pp. 389-396.
Goodhart, S. G., Burnham, K. J., James, D.J.G., 1994.
Bilinear Self-tuning Control of a high temperature
Heat Treatment Plant. IEEE Control Theory Appl.:
Vol. 141, no 1, pp. 779-783.
A MULTI-MODEL APPROACH FOR BILINEAR GENERALIZED PREDICTIVE CONTROL
295
