
ANALYZING EBAY NEGOTIATION PATTERNS
A. Pereira, L. Rocha, F. Mour˜ao, T. Torres, W. Meira Jr.
Department of Computer Science, Federal University of Minas Gerais, Brazil
P. Goes
School of Business, University of Connecticut, USA
Keywords:
Online auctions, e-business, characterization methodology, reactivity.
Abstract:
Online auctions have several aspects that violate the common assumptions made by the traditional economic
auction theory. An online auction can be seen as an interactive economic information system, where user-
system interactions are usually very complex. It is important to note that the interactions are not isolated, but
successive interactions become a loop-feedback mechanism, that we call reactivity, where the user behavior
affects the auction negotiation and vice-versa. In this paper we describe a new hierarchical characterization
model for online auctions and apply this model to a real case study, showing its advantages in discovering
some online auction negotiation patterns. The results demonstrate that our characterization model provides
an efficient way to open the auction dynamics’s “black box”. We also propose an abstraction named Auction
Model Graph (AMG) which enables the temporal analysis of the negotiation. This work is part of a research
to analyze reactivity in e-business, that may contribute to understand the business dynamics and has wide ap-
plicability to activities such as designing recommendation agents, service personalization, and site interaction
enhancement.
1 INTRODUCTION
Online auctions have several aspects that violate the
common assumptions made by the traditional eco-
nomic auction theory. The auction duration is typi-
cally much longer than in traditional auctions; bidders
may enter and exit at any time; bidders are geographi-
cally dispersed all over the world; they have very dis-
tinct backgrounds and it is hard to predict how many
bidders will end up participating in the auction.
An online auction may be seen as an interactive
economic information system, where user-system in-
teractions are usually very complex. It is important to
note that the interactions are not isolated, but succes-
sive interactions become a loop-feedbackmechanism,
which we call reactivity, where the user behavior af-
fects the auction negotiation and vice-versa.
An online auction is a rather complex e-business
application to characterize because of its many at-
tributes and dynamic aspects. It has an initial state
defined by its input parameters, such as the beginning
date and the starting bid. Its intermediary state is the
phase when the negotiation occurs through bids. The
final state occurs after the negotiation and is charac-
terized by its output parameters, such as the winning
price, the winner bidder, and the number of bids.
In this paper we describe a new hierarchical char-
acterization model for online auctions. Despite the
existence of other characterization models (Roth and
Ockenfels, 2002; Bapna et al., 2004; Easley and
Tenorio, 2004), none of them is capable of under-
standing the factors that explain the auction dynam-
ics (Achtert et al., 2005), which is the basis of our re-
search. Moreover, we apply this model to a real case
study, showing the advantages of our model in order
to discover the online auction negotiation patterns.
This work is part of a research to analyze reac-
tivity in e-business, which has wide applicability for
activities such as designing recommendation agents,
service personalization, and site interaction enhance-
ment (Chelcea et al., 2005).
The key aspect of reactivity is how users, or bid-
ders in the case of online auctions, react to system’s
or application’s behavior. The behavior may mean
84
Pereira A., Rocha L., Mourão F., Torres T., Meira Jr. W. and Goes P. (2007).
ANALYZING EBAY NEGOTIATION PATTERNS.
In Proceedings of the Third International Conference on Web Information Systems and Technologies - Society, e-Business and e-Government /
e-Learning, pages 84-91
DOI: 10.5220/0001267000840091
Copyright
c
SciTePress

Market
OutputInput
Dynamics
Auction
1
2
3 4 5
1) How the market affects the input?
2) How the market affects the dynamics?
3) How the input affects the auction dynamics?
4) How the auction dynamics affects itself?
5) How the auction dynamics affects the output?
Figure 1: Auction Dynamics - Reactivity.
the performance of the system in the case of a phys-
ical level analysis, or business rules and dynamics in
a logical level view. At the physical level, we have
modeled reactivity (Pereira et al., 2004) and quanti-
fied its impact (Pereira et al., 2006b) on the perfor-
mance of Internet services. The logical view of the
service, e.g., how the business dynamics affect the
user behavior,is the current focus of our research. We
chose online auctions as the application to analyze,
sine it is a popular, rich and complex online service.
Figure 1 shows a high-level representation of the
auction. There are five different reactivity dimensions
to analyze, as illustrated by the numbered questions.
The paper is organized as follows. Section 2 pro-
vides an overview of related work in the realm of on-
line auctions. Section 3 presents the hierarchical char-
acterization model. Section 4 describes our case study
of eBay, showing the main results through the appli-
cation of our model. Finally, Section 5 presents the
conclusions and outlines ongoing work.
2 RELATED WORK
Online auctions have been studied extensively lately.
Many studies focus on validating concepts from the
classic economic theory of auctions in the online en-
vironment. For example, Lucking-Reiley (Lucking-
Reiley, 1999) checks the validity of the well-known
results of revenue equivalence. Bajari and Hor-
tacsu (Bajari and Hortacsu, 2003) address how
the starting bid set by the seller affects the win-
ner’s course. Gilkeson and Reynolds (Gilkeson and
Reynolds, 2003) show the importance of a proper
starting bid price to attract more bidders and make an
auction successful.
The growing popularity of auction sites on the
Internet and the increasing importance of online
auctions as exchange mechanisms have attracted
the attention of academic researchers who have
studied such issues as the effect of auction for-
mats (Lucking-Reiley, 1999), the last-minute bidding
phenomenon (Roth and Ockenfels, 2002) and the
value of seller reputation (Melnik and Alm, 2002).
However, these studies are still limited to how they
explain bidding behavior over the entire sequence of
bids, as opposed to simply summary outcomes (e.g.,
final auction prices, and number of bids) in an auc-
tion (Ariely and Simonson, 2003; Chakravarti et al.,
2002).
For addressing the issue of reactivity in online
auctions, it is important to take into account the work
that has been done on analyzing bidders’ and sellers’
behavior in online environments (Easley and Teno-
rio, 2004). Roth and Ockenfels (Roth and Ockenfels,
2002) study the timing of bids, and the impact of dif-
ferent methods of specifying auction deadlines. By
comparing eBay and Amazon auctions, they find ev-
idence that auctions held with a “soft” ending time
discourage late bidding (also known as “sniping”), a
common behavior observed on eBay. Using data from
ubid.com, Bapna et al. (Bapna et al., 2004) develop
a cluster analysis approach to classify online bidders
into four categories: participators, evaluators, oppor-
tunists, and sip-and-dippers. In another paper, Bapna
et al. (Bapna et al., 2003) develop a simulation model
emulating bidders’ behavior to analyze their impact
in the outcome of the auctions.
Although there are several detailed studies of on-
line auctions, none of them deals with reactivity. We
believe that this concept will allow a better character-
ization of online auctions and other distributed appli-
cations, qualifying and quantifying temporal and se-
quencing aspects.
3 CHARACTERIZATION
METHODOLOGY
This section presents our hierarchicalcharacterization
model, which applies the concept of reactivity to gain
a better understanding of the dynamics of online auc-
tions.
ANALYZING EBAY NEGOTIATION PATTERNS
85
2 2 2 31 1
Ses 2 Ses 3
Ses 4
Ses 5
Seq 2 Seq 3
Auction 1
1
Ses 1
Seq 1
Auction2
1 14 5 4 6
Ses 1
Seq 1 Seq 2 Seq 3
Ses 2 Ses 3 Ses 4 Ses 5 Ses 6
T1
T2
T3
Market
T4
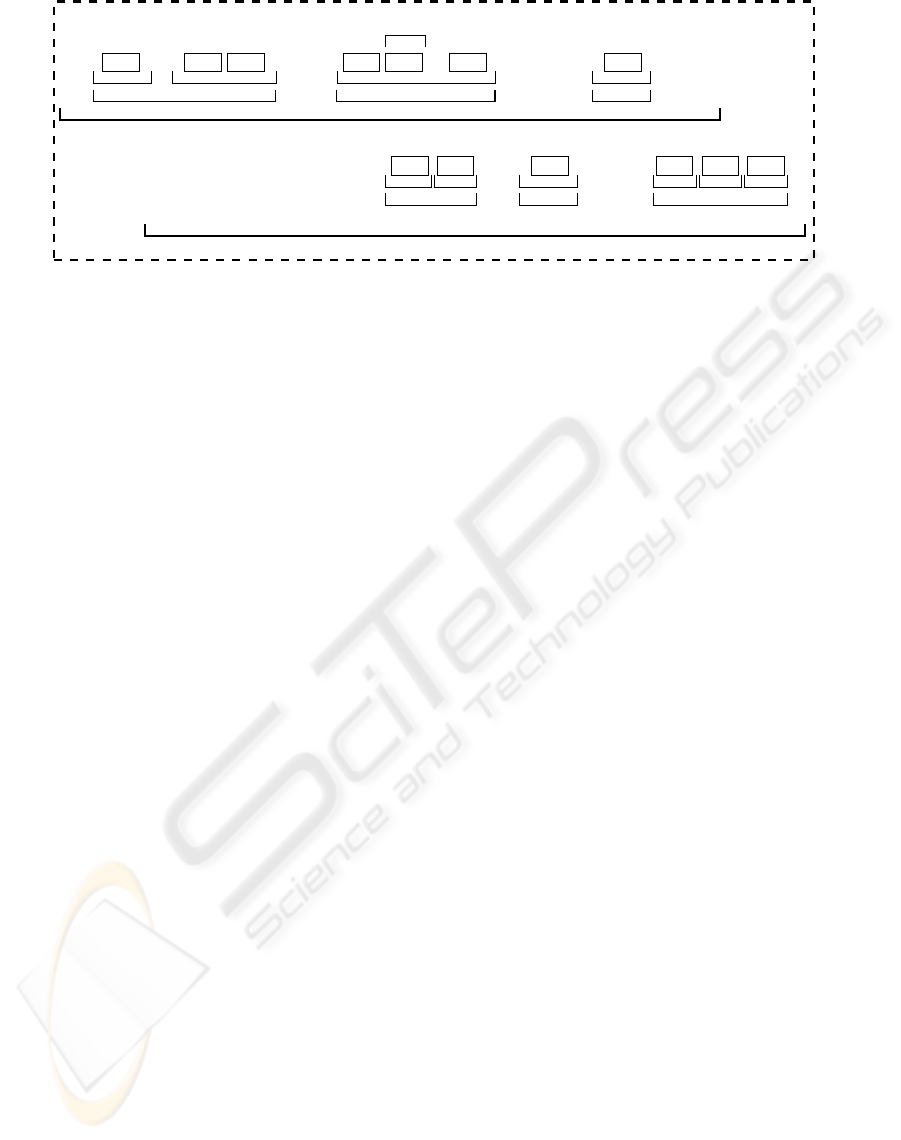
Figure 2: Auction Hierarchy.
Previous auction characterizations (Bapna et al.,
2004; Bapna et al., 2003; Roth and Ockenfels, 2002)
consider mainly the static aspects, as discussed in
Section 2. We propose a novel model that is able to
capture the relevant information about the auctionfea-
tures to understand its dynamics. These criteria ana-
lyze the auctions at various levels of granularity and
are organized in a hierarchy.
A reactivity model defines agents who react to
events through actions (Pereira et al., 2006a). In the
online auctions environment, agents are bidders, their
actions are their bids, and events are bids from other
bidders. Another important concept in the reactivity
model is the time to react. In online auctions, because
of its long duration, the intermittent nature of the bid-
ders’ visits to the sites, and their own behavior char-
acteristics, the time to react induces the occurrence
of both synchronous and asynchronous reactivity pe-
riods. Synchronous in our model means two actions
occurring during the same period of activity.
In our characterization model we have incorpo-
rated these ideas in the definition of the basic com-
ponents of the model. The important objectives are
to isolate, measure and understand periods of syn-
chronous and asynchronous reactivity, how reactivity
leads to competitiveness, and the instantaneous im-
pact on the auction winning price, and the winner.
These are basic components necessary to understand
the auction dynamics.
There are two key concepts for modeling reactiv-
ity: activity and synchronicity. One auction is active
if bid occurred within a time threshold θ
ses
. One auc-
tion is synchronous when it is active and more than
one bidder submitted a bid within θ
ses
.
As illustrated in Figure 2, our characterization
model is organized as a five-level hierarchy: bid, ses-
sion, sequence, auction, and market. The bid (repre-
sented by rectangles containing a number that identi-
fies the bidder) is the finest grain level, representing
the bidder’s action. A session is a group of one or
more bids from the same bidder, in which the time
interval between any two consecutive bids is below
a threshold θ
ses
. The session delimits activity inter-
vals for each bidder. The sequence is a group of one
or more sessions, where the inactivity period between
two consecutive sessions is below a threshold θ
seq
.
Notice that θ
ses
≤ θ
seq
. Each auction is modeled by a
group of sequences and the market is theset of all auc-
tions. In Figure 2, the labels T 1 and T 3 represent the
beginning of two auctions, and the end is defined by
T 2 and T 4. In the case study presented in this work,
we adopt θ
ses
and θ
seq
as 90 minutes. We choose this
threshold after an analysis of the inter-bidding time of
the auctions.
Table 1 shows our proposed characterization cri-
teria for sequences and sessions. According to this
sequence characterization, there are 15 valid combi-
nations to describe patterns of auction’s sequences.
Considering the session’s characterization, there are
32 valid patterns. In order to simplify the sequence
and session patterns representation, we adopt letters
(minuscule or capital) as labels, such as the sequence
pattern IZW (initial sequences, with zigzag compe-
tition and winner changing) and the session pattern
OStrW (session with one bid, serial competition, non-
trigger, non-recurrent, and winner changing). It is im-
portant to emphasize that each criterion of sequence
(e.g., Time-Locality) and session (e.g., Size) is mutu-
ally exclusive.
The next section presents a case study that applies
this characterization model to actual data.
4 CASE STUDY: eBAY
This section presents our case study. We apply
our model to an actual dataset that consists of 8855
eBay auctions comprising of 85803 bids for Nin-
WEBIST 2007 - International Conference on Web Information Systems and Technologies
86
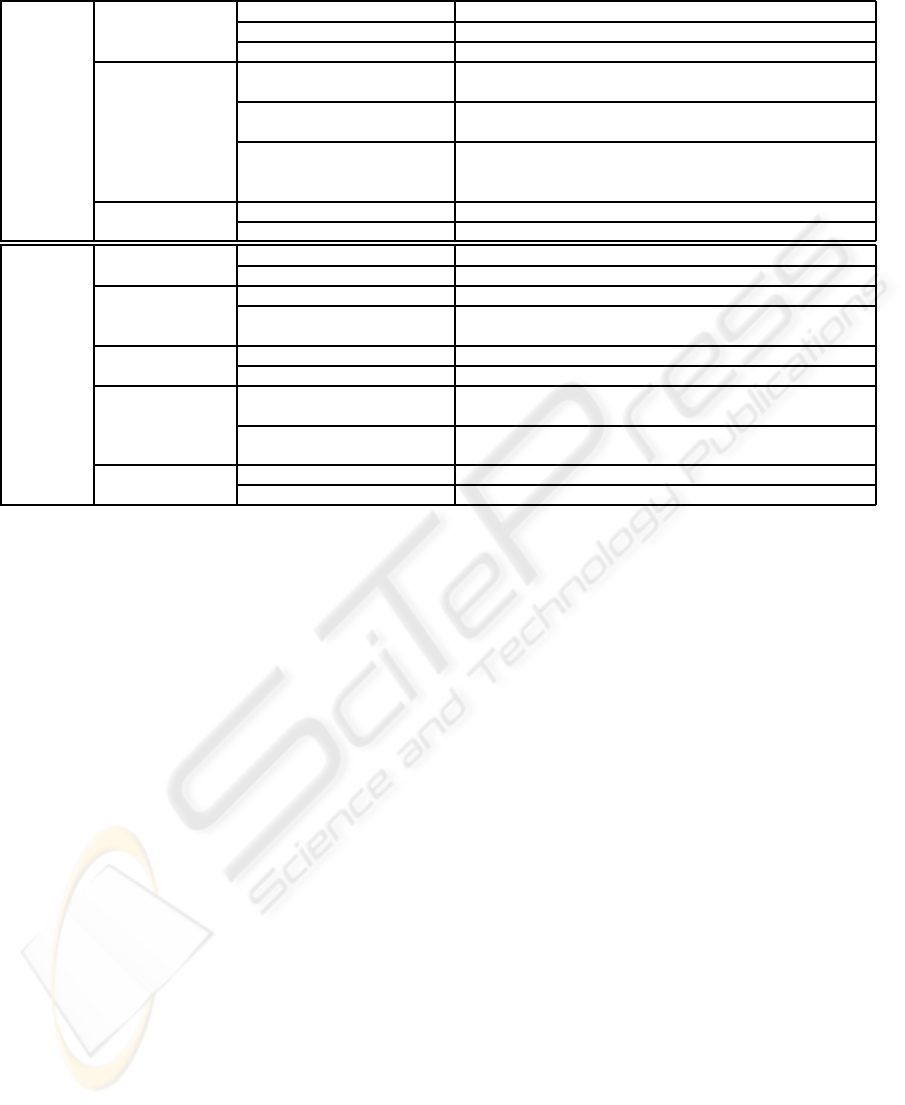
Table 1: Description of Auction Model Hierarchy- Sequences and Sessions.
Time-Locality
Initial (I) It is the first sequence of the auction.
Intermediary (M) It is an intermediary sequence of the auction.
Final (F) It is the last sequence of the auction.
No competition (N) The sequence does not present competition, only one
bidder’s session.
Sequence Competition Successive competition (S) Exists a competition, but there is no overlap between
bidders’ actions.
Zigzag competition (Z) Characterizes a more direct competition, where one or
more bidders compete with each other in more than one
occasion in the sequence.
Winner’s Impact
Do not change winner (w) The sequence does not change the last winner bidder.
Change winner (W) The sequence changes the last winner bidder.
Size
One (O) The session has just one bid.
More (M) The session has more than one bid.
Competition
Serial (S) The session does not overlap with any other one.
Parallel (P) The session is concurrent with other(s), defining a par-
allelism.
Session
Activity
Non-Trigger (t) The session does not initiate the sequence’s activity.
Trigger (T) The session initiates the sequence’s activity .
Recurrence
Non-Recurrent (r) The session is from a bidder who has not bid before in
this auction.
Recurrent (R) The session is from a bidder who has already bid in this
auction.
Winner’s Impact
Do not change winner (w) The session does not change the last winner bidder.
Change winner (W) The session changes the last winner bidder.
tendo GameCubes from 05/25/ 2005 to 08/15/2005.
eBay (EBay, 2005; Anderson et al., 2004; Bajari and
Hortacsu, 2003) employs a non-trivial mechanism of
second price auction, hidden winner, and hard auction
closing, in a typical complex online auction environ-
ment that demands characterization models that allow
more detailed analysis.
A statistical study of this dataset finds that the
number of distinct sellers is high (5453), which shows
that auctions are not concentrated among a small
number of sellers. The number of distinct bidders is
also high (18073), indicating high level of competi-
tion. On the other hand, from this set of bidders, just
very few of them become winners (735); the mean
variation of price between new and used products is
small, however the standard deviation of the prices is
very high; and there is a significant number of average
bids per auctions (11.59), which suggests the level of
competition during the negotiation. This is confirmed
by the average number of unique bidders per auction,
which is greater than 5.
Table 2 presents some auction information that is
important to better understand its dynamics. From
the original dataset, we consider auctions with bids
that achieve success in the negotiation, selling the
item. This group represents 75.7% of the complete
dataset. We can see that the average number of ses-
sions per sequence is small, just 1.53, since it is com-
mon to find one or more sequences with one session
in all auctions. On the other hand, the average num-
ber of sequences per auction shows that the dynamics
of the negotiation is rich, which motivates our analy-
sis. Another aspect we analyze is the active and inac-
tive times of the auctions. The active time is the total
time during which the auction has activity, that is the
sum of the sequence times. We expected a short active
time per auction, since there are usually long intervals
between sets of bids, but an active time of just 1.72%
is beyond our expectations.
According to our characterization model, each
auction is composed by a set of one or more se-
quences, therefore we can describe each of them as a
distribution of sequence patterns, that is, a frequency
of occurrence of each valid sequence pattern (see Ta-
ble 1). For example, if an auction has four sequences,
from which two of them are IZW and the other two
are ISw, then this auction is represented by 50% of
IZW, 50% of ISw and 0% of other sequence patterns.
Amongst the diversity of auctions observed in our
dataset, some of them exhibit similar distribution of
sequence patterns. To analyze the auction negotia-
tion patterns in our case study, we use a data min-
ing technique called clustering (Bock, 2002) which
partitions the analyzed data into clusters of similar
data. More specifically we use the clustering algo-
rithm k-means (Hartigan, 1975). This type of algo-
ANALYZING EBAY NEGOTIATION PATTERNS
87
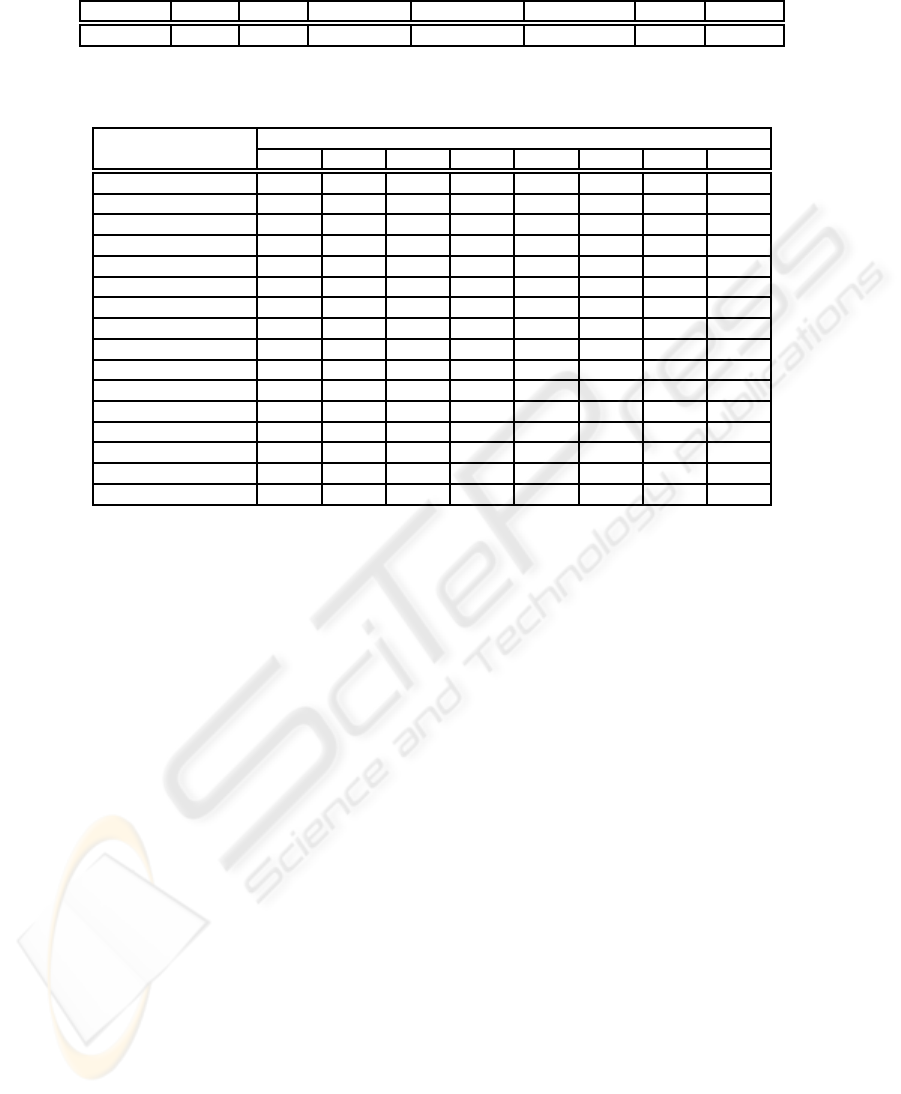
Table 2: Auction Characterization - General Statistics.
Auctions #Seq #Ses #(Ses/Seq) #(Seq/Auct) #(Ses/Auct) T
act
T
inact
6707 29575 45201 1.53 4.41 6.74 1.72% 98.28%
Table 3: Distribution of Cluster’s Sequences.
Sequence Patterns Clusters
0 1 2 3 4 5 6 7
1 (I-N-W) 17.53 0.00 18.28 0.00 47.19 0.00 0.00 21.61
2 (I-S-W) 0.12 12.85 0.19 0.00 0.00 44.74 0.00 0.02
3 (I-Z-W) 0.04 6.15 0.10 8.76 0.00 0.00 0.87 0.07
4 (M-N-w) 8.77 14.77 37.45 0.00 0.00 1.42 0.00 8.71
5 (M-S-w) 1.31 1.49 2.01 0.00 1.04 0.44 0.00 1.18
6 (M-Z-w) 0.08 0.07 0.08 0.00 0.00 0.00 0.00 0.00
7 (M-N-W) 43.10 24.12 14.99 0.00 1.15 2.94 0.00 12.65
8 (M-S-W) 7.91 13.99 5.22 0.00 0.00 3.59 0.00 31.15
9 (M-Z-W) 3.47 3.39 3.13 0.00 3.44 2.12 0.00 2.90
10 (F-N-w) 2.20 2.97 3.67 0.00 10.32 5.99 0.00 2.71
11 (F-S-w) 0.82 1.11 0.94 0.00 1.62 2.67 0.00 1.09
12 (F-Z-w) 0.13 0.15 0.12 0.00 0.32 0.44 0.00 0.33
13 (F-N-W) 5.02 3.58 4.89 0.00 16.57 11.90 99.13 5.21
14 (F-S-W) 5.66 4.97 5.28 91.24 11.72 13.94 0.00 6.92
15 (F-Z-W) 3.86 10.39 3.67 0.00 6.63 9.80 0.00 5.45
Frequency (%) 22.90 7.53 16.25 1.45 11.70 4.56 18.75 16.85
rithm is a technique well known to partition a het-
erogeneous group of entities (in the case, online auc-
tions) into clusters that have similar characteristics.
In our case study, we want to determine clusters of
auctions that present the same probability distribution
of sequence patterns. The ideal number of clusters is
determined through β-CV, as described in (Menasc´e
and Almeida, 2000; Menasc´e; et al., 1999). In our
datasets we found eight clusters.
Table 3 shows the probability distribution of se-
quences for the clusters. We have the frequency of oc-
currence for each of the 15 sequence patterns and also
the percentage of auction in each group (the last row
of the table). This result is very interesting, showing
different negotiation patterns for each group of auc-
tions. We can describe each cluster as:
• cluster 0: represents auctions with a high number
of sequences with the presence of initial (I), in-
termediary (M) and final (F) patterns. They have
only 23.5% of competition, divided in 2/3 of suc-
cessive and 1/3 of zigzag competition. Almost
87% of sequences change the winner.
• cluster 1: consists of auctions with high activ-
ity, high level of competition (54.5%) from which
37% is zigzag type. Almost 80% of the auction
sequences changes the winner.
• cluster 2: group of auctions with a large num-
ber of sequences, but with low competition level
(20.7%). It is similar to cluster 0, however the
number of sequences that changes the winner is
much smaller, just 55.7%.
• cluster 3: represents auctions with predominance
of low levelof activity (sequences). Most auctions
in this cluster have just one sequence. The com-
petition level is maximum, with 91.2% of succes-
sive and 8.8% of zigzag competition types. As
expected , all sequences change the winner.
• cluster 4: consists of auctions with medium level
of activity, most of them with two activity mo-
ments. Most sequences do not present competi-
tion (75.2%) but change the winner (86.7%).
• cluster 5: a set of auctions with similar character-
istics of cluster 4 in terms of number of auction
sequences and winner changing. However these
auctions present a high competitionlevel (77.7%),
from which 85% is successive.
• cluster 6: group of auctions with very small num-
ber of sequences, almost all of them unique and
with no competition. All of them change the win-
ner, as expected, once the first sequence always
changes the winner in eBay.
• cluster 7: has auctions with high activity, a sig-
nificative amount of competition (49%), with pre-
dominance of successive type (8 in each 10 se-
quences with competition). Moreover, 86% of
WEBIST 2007 - International Conference on Web Information Systems and Technologies
88
start
I-Z-W
0.1753
F-S-W
0.8247
end
1.0000
1.0000
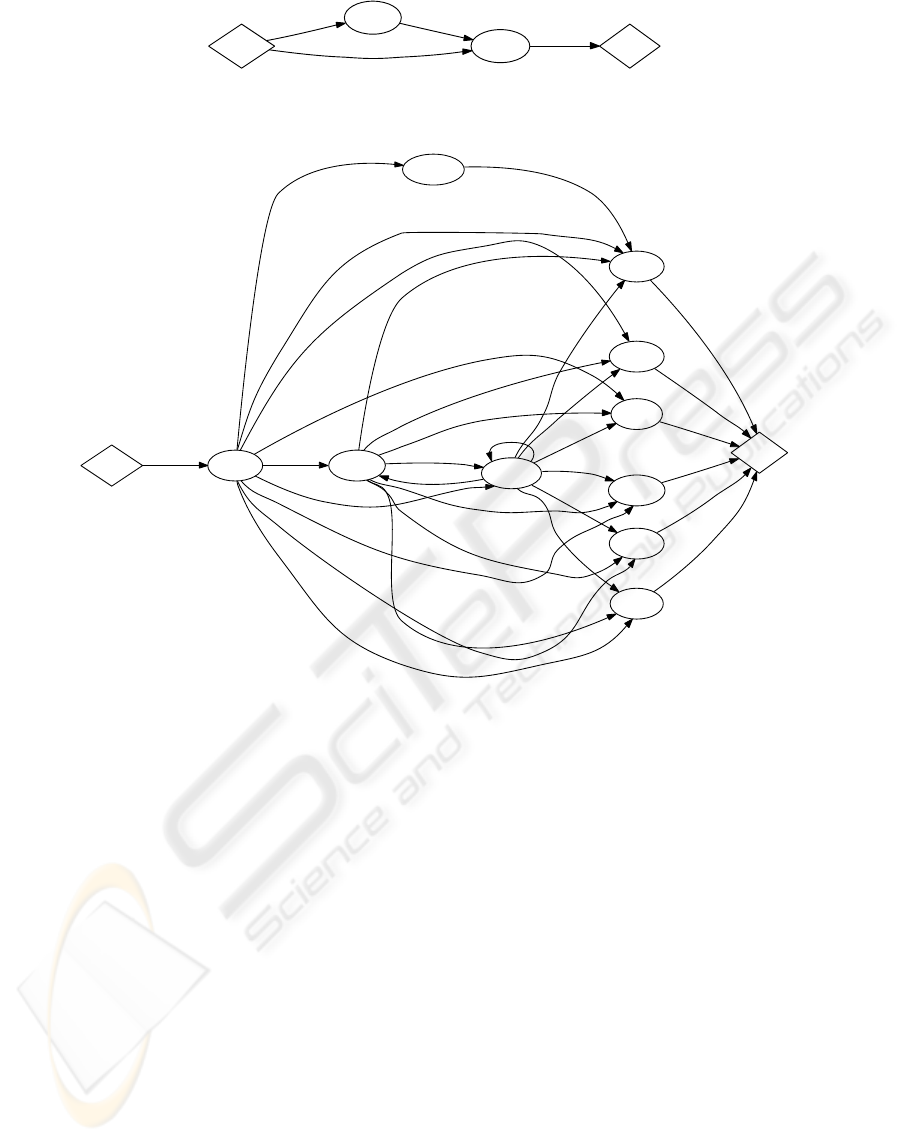
Figure 3: AMG - cluster 3.
start I-N-W
1.0000
end
M-S-w
0.0306
M-N-W
0.0344
M-Z-W
0.1006
F-N-w
0.1707
F-S-w
0.0293
F-Z-w
0.0038
F-N-W
0.3146
F-S-W
0.2025
F-Z-W
0.1134
0.0400
0.1600
0.0800
0.0400
0.2800
0.3200
0.0800
1.0000
0.0120
0.0361
0.1325
0.0241
0.0241
0.1566
0.3614
0.2530
1.0000
1.0000
1.0000
1.0000
1.0000
1.0000
Figure 4: AMG - cluster 4.
auction sequences changes the winner.
Table 4 shows some important aspects about auc-
tions for each cluster. It presents two auction negotia-
tion inputs and four outputs. AVG means the average
value of the attribute. This is an example of the re-
activity analysis introduced in Figure 1, in which we
start to explore the relationships between inputs and
reactivity and between reactivity and outputs. Cluster
1 has the lowest starting price, the highest duration,
and the highest 2nd price, that represents the auction
winner price in eBay. It is interesting to emphasize
that cluster 1 presents high competition level and ac-
tivity. Cluster 3 has an average duration of 5 days and
an average starting price of US$41.32. In these set of
auctions we identify very low activity and high com-
petition level. The mean number of bids is only 5 (as-
sociated to 3 bidders). This cluster has the lowest 2nd
price, that can be explained in part by its low activity,
that occurs mainly at the end of the negotiation. Clus-
ters 4 and 5 have similar characteristics, but different
behavior in terms of competition profile, as previous
explained. However it is very interesting to note that
they produce different results: the average number of
bids and bidders for cluster 4 are almost half of the
cluster 5, which can be explained by the competition
level. Moreover, the final negotiation price is almost
10% higher for auctions of cluster 5. Cluster 6 has
the highest starting price and the shortest duration,
that are negotiation inputs. In terms of its dynamics,
we previously identified low activity and competition.
However, it is interesting to note that these auctions
achieve a high winner price (the AVG 2nd price is
US$71.99). These can be explained by the fact that
these auction’s sellers set a very high starting price,
very close to the final price obtained. It is important to
emphasize that we do not exhaust the inumerous pos-
sibilities of analysis, however these preliminar analy-
sis shows how interesting and promising is our novel
ANALYZING EBAY NEGOTIATION PATTERNS
89

Table 4: AMG analysis.
Clusters
Aspects 0 1 2 3 4 5 6 7
Inputs
AVG Starting Price (US$) 18.78 11.91 17.39 41.32 46.92 38.55 71.4 20.27
AVG Duration (days) 5.9 4.8 5.8 5 4.9 4.5 2.7 5.3
Outputs
AVG #Bids 16.75 19.76 15.29 5.04 5.15 9.21 1.16 16.07
AVG #Bidders 7.35 8.34 6.88 2.98 2.87 4.78 1.05 7.48
AVG 1st Price (US$) 81.21 82.29 82.22 55.31 65.02 68.05 72.2 74.12
AVG 2nd Price (US$) 79.32 80.62 79.68 54.3 60.67 66.09 71.99 72.33
work.
The frequency distribution of sequence patterns
allow us to understand the overall auction negotia-
tion patterns, however it is not possible to analyze
the temporal aspects of the negotiation, that is, how
the auction develops across time. This aspect is im-
portant to complement the analysis and also to al-
low the possibility to generate an online auction syn-
thetic workload. In order to provide a way to do
this complementary analysis, for each identified clus-
ter of auctions, we create an Auction Model Graph
(AMG). AMG, that is based on Customer Behavior
Model Graph (CBMG) (Menasc´e and Almeida, 2000;
Menasc´e; et al., 1999). This is a state transition graph
that has one node for each possible sequence pat-
tern and the edges are transitions between these se-
quences. A probability is assigned to each transi-
tion between two nodes, representing the frequency
at which these two sequences occur consecutively in
a cluster.
Due to lack of space we present in this paper only
two AMGs, to illustrate the usefulness of this ap-
proach and as the wealth of details that it provides.
Figures 3 and 4 show the AMG of clusters 3 and 4,
respectively.
The AMG presented in Figure 3 is very simple.
In this cluster, 17.53% of the initial sequences of
the auction is represented by zigzag competition and
they are succeeded by final sequences with successive
competition. The other group denotes auctions with
unique sequences of type F-S-W.
The AMG of Figure 4 is more complex than the
previous AMG and through its analysis it is possi-
ble to understand details of the auction negotiation
pattern. We can realize that there is not any auc-
tion with unique sequence and that all of them be-
gins with the sequence pattern I-N-W. About 83% of
the auctions from this group has a second period of
activity where the negotiation determines the end of
the auction. In these auctions sequences, 49% has al-
ready defined their winners in the initial activity pe-
riod while 51% has determined the winner in the last
auction’s sequence. The other 17% of auctions haveat
least one more intermediary sequence before the auc-
tion resumes. Moreover, it is interesting to note that
the competition arises at the end of the auctions (final
sequences), where we observe 43% of competitivese-
quences and the predominance of zigzag competition
type.
As we can see, the details presented in these
graphs are so rich, and through them its possible to
model an online auction workload and design new
service personalization policies.
This analysis is an example of how our model can
help the understanding of the auction dynamics and is
the basis for reactivity modeling, as we explained in
Section 1.
The application of our characterization model to
an eBay dataset demonstrates that our proposal pro-
vides a way to open the auction dynamics’s “black
box”. We are aware that these results must be val-
idated against a larger dataset and realize that we
should characterize auctions using sequences, and
bidders through sessions. By doing this, we will have
a better semantic characterization, since the current
work shows that it is difficult to explain some specific
behavior through a general data analysis. In the next
section we present our conclusion and ongoing work.
5 CONCLUSION
This work presents a new hierarchical characteriza-
tion model for online auctions, which provides novel-
ties in order to model and understand the factors that
characterize and explain the auction dynamics, differ-
ently of other characterizationmodels (Roth and Ock-
enfels, 2002; Bapna et al., 2004; Easley and Tenorio,
2004). Moreover, we apply this model to an actual
dataset that consists of 8855 eBay auctions, showing
the advantages of our model in order to discover the
online auction negotiation patterns.
Applying a data mining technique called cluster-
ing, which sorts the analyzed data into clusters of sim-
ilar data, we found out eight clusters in our datasets.
This result is very interesting, showing different ne-
WEBIST 2007 - International Conference on Web Information Systems and Technologies
90

gotiation patterns for each group of auctions consid-
ering not only static and aggregated measures, but the
auction dynamics, a novelty for online auctions re-
search. We also introduce the Auction Model Graph
(AMG) to analyze the temporal aspect of the nego-
tiation. This aspect is important to complement the
analysis and can also be used to generate an online
auction synthetic workload.
This work is part of our ongoing research to ana-
lyze reactivity in e-business. We hope that, by under-
standing the reactivity patterns in relation to the ne-
gotiation features and specific business rules that gov-
ern the auction environment, we will be able to con-
ceptualize and design a comprehensive framework to
model reactivity. Also, studying reactivity may bene-
fit the economicanalysis of Web-based environments,
such as marketplaces.
As future work we are going to characterize the
bidders. Characterizing both bidders and auctions
will allow us to conduct in-depth analysis of reactivity
patterns that emerge in auction negotiations.
REFERENCES
Achtert, E., Kriegel, H., Pryakhin, A., and Schubert,
M. (2005). Hierarchical density-based clustering
for multi-represented objects. In First International
Workshop on Mining Complex Data MCD, Houston,
Texas. IEEE.
Anderson, S., Friedman, D., Milam, G., and Singh, N.
(2004). Seller strategies on ebay. Industrial Orga-
nization 0412004, Economics Working Paper Archive
EconWPA.
Ariely, D. and Simonson, I. (2003). Buying, bidding, play-
ing, or competing? value assessment and decision dy-
namics in online auctions. Journal of Consumer Psy-
chology, 13(1):113–123.
Bajari, P. and Hortacsu, A. (2003). The winner’s curse,
reserve prices, and endogenous entry: Empirical in-
sights from ebay auctions. RAND Journal of Eco-
nomics, 34(2):329–55.
Bapna, R., Goes, P. B., and Gupta, A. (2003). Replicat-
ing online yankee auctions to analyze auctioneers’ and
bidders’ strategies. Information Systems Research,
14(3):244–268.
Bapna, R., Goes, P. B., Gupta, A., and Jin, Y. (2004).
User heterogeneity and its impact on electronic auc-
tion market design: An empirical exploration research
essays. MIS Quarterly, 28(1).
Bock, H.-H. (2002). Data mining tasks and methods - clas-
sification: the goal of classification. pages 254–258.
Chakravarti, D., Greenleaf, E. A., Sinha, A., Cheema, A.,
Cox, J. C., Friedman, D., Ho, T. H., Isaac, R. M.,
Rapoport, A. A. M. A., Rothkopf, M. H., Srivastava,
J., and Zwick, R. (2002). Auctions: Research oppor-
tunities in marketing. Marketing Letters, 13(3):279–
293.
Chelcea, S., Silva, A. D., Lechevallier, Y., Tanasa, D., and
Trousse, B. (2005). Pre-processing and clustering
complex data in e-commerce domain. In First Inter-
national Workshop on Mining Complex Data MCD,
Houston, Texas. IEEE.
Easley, R. F. and Tenorio, R. (2004). Jump bidding strate-
gies in internet auctions. Manage. Sci., 50(10):1407–
1419.
EBay (2005). eBay, Inc. http://www.ebay.com/.
Gilkeson, J. H. and Reynolds, K. (2003). Determinants
of internet auction success and closing price: An ex-
ploratory study. Psychology & Marketing, 20(6):537–
566.
Hartigan, J. (1975). Clustering Algorithms. John Wiley and
Sons, Inc.
Lucking-Reiley, D. (1999). Using field experiments to test
equivalence between auction formats: Magic on the
internet. American Economic Review, 89(5):1063–
1080.
Melnik, M. I. and Alm, J. (2002). Does a seller’s e-
commerce reputation matter? evidence from ebay
auctions. Journal of Industrial Economics, 50(3):337–
349.
Menasc´e, D. A. and Almeida, V. A. F. (2000). Scaling for
E Business: Technologies, Models, Performance, and
Capacity Planning. Prentice Hall PTR, Upper Saddle
River, NJ, USA.
Menasc´e;, D. A., Almeida, V. A. F., Fonseca, R., and
Mendes, M. A. (1999). A methodology for work-
load characterization of e-commerce sites. In EC ’99:
Proceedings of the 1st ACM conference on Electronic
commerce, pages 119–128, New York, NY, USA.
ACM Press.
Pereira, A., Franco, G., Silva, L., Meira, Jr., W., and Santos,
W. (2004). The USAR characterization model. In Pro-
ceedings of the IEEE 7th Annual Workshop on Work-
load Characterization (WWC-7), Austin, Texas, USA.
IEEE Computer Society.
Pereira, A., Mourao, F., Goes, P., and Meira, Jr., W. (2006a).
Reactivity in online auctions. In et al., T. G., edi-
tor, Workshop Reactivity on the Web at the Interna-
tional Conference on Extending Database Technol-
ogy - EDBT 2006, volume 4254 of Lecture Notes
in Computer Science, pages 909–918, Munich, Ger-
many. Springer.
Pereira, A., Silva, L., Meira Jr., W., and Santos, W. (2006b).
Assessing the impact of reactive workloads on the per-
formance of web applications. In ISPASS-2006: IEEE
International Symposium on Performance Analysis of
Systems and Software, Austin, TX, USA. IEEE Com-
puter Society.
Roth, A. and Ockenfels, A. (2002). Last-minute bidding
and the rules for ending second-price auctions: Evi-
dence from ebay and amazon auctions on the internet.
American Economic Review, 92(4):1093–1103.
ANALYZING EBAY NEGOTIATION PATTERNS
91
