
User Specific Parameters in One-class Problems:
The Case of Keystroke Dynamics
Sylvain Hocquet
1
, Jean-Yves Ramel
1
, Hubert Cardot
1
1
Université François-Rabelais de Tours, Laboratoire d'Informatique (EA 2101),
64 Avenue Jean Portalis, 37200 TOURS,
Abstract. In this paper, we propose a method to find and use user-dependant
parameters to increase the performance of a keystroke dynamic system. These
parameters include the security threshold and fusion weights of different classi-
fiers. We have determined a set of global parameters, which increase the per-
formance of some keystroke dynamics methods. Our experiments show that pa-
rameter personalization greatly increases the performances of keystroke dy-
namics systems. The main problem is how to estimate the parameters from only
a small user training set containing ten login sequences. This problem is a
promising way to increase performance in biometric but is still open today.
1 Introduction
Since a few years, the need of more security level for every day life has greatly in-
creased. The biometric is a promising solution to answer to this challenge. Biometric
is divided into two fields: the physical biometric and the behavior biometric. The
physical biometric methods (fingerprint, hand recognition...) are usually more accu-
rate than those based on the study of the behavior (signature, voice, gait…). But in
some case it’s seem that the behavior biometric can be better to solve some security
problem. The problem of this kind of methods is the great variability in the user be-
havior. In the case of an authentication problem, this variability implies to set a
threshold, used to separate authentic users from impostors. The threshold is often the
same for all the users. This choice results in a great disparity of performances be-
tween users. The variability of some user profiles implies to accept everybody includ-
ing impostors and at the opposite side, for some users with specific practice, all at-
tempts including authentic ones are refused. So, the automatic determination of a
threshold for each user seems to be a way to solve this problem. In this paper, we
have tried a few methods to compute automatically the threshold on the case of key-
stroke dynamics. We have also studied the possibility to adapt to each user the
weights used during a fusion of classifiers step.
Hocquet S., Ramel J. and Cardot H. (2006).
User Specific Parameters in One-class Problems: The Case of Keystroke Dynamics.
In 6th International Workshop on Pattern Recognition in Information Systems, pages 127-135
DOI: 10.5220/0002485901270135
Copyright
c
SciTePress
2 Keystroke Dynamics
Keystroke dynamics is the field of biometrics that studies the way a user interacts
with a keyboard. To extract data from the striking of a user, the times between key-
board events are used. A keyboard event can be the pressure or the release of a key.
For the same couple of successive keys, we are able to extract several different times
as presented in
Fig. 1.
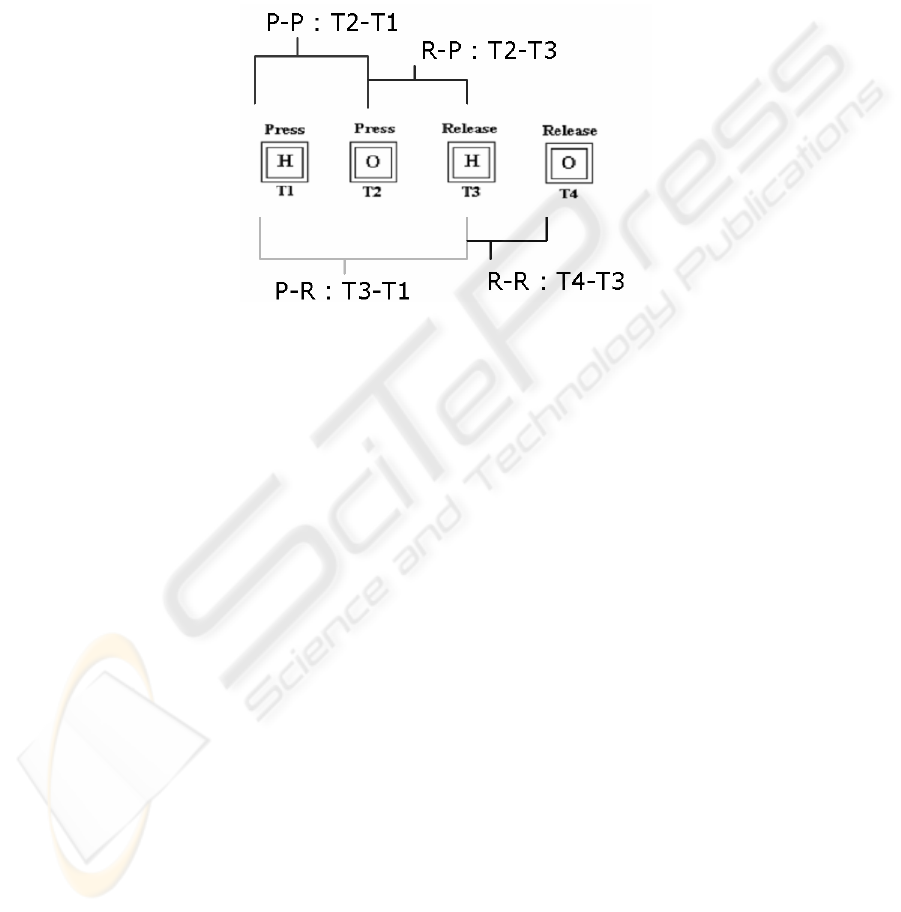
Fig. 1. Times extracted from the strike of HO.
• P-P (Press - Press) : time between two key pressures (T2-T1)
• P-R (Press - Release) : time between the pressure and the release of a key
(T3-T1 et T4-T2)
• R-P (Release - Press) : time between the release of a key and the press on the
next key (T3-T2)
• R-R (Release - Release) : time between the pressure of two successive keys
(T4-T3)
For a sequence of stroke, we extract a feature vector for each type of times, to finally
obtain one vector composed of four type of features (PP, PR, RP, RR). The first test
to differentiate people using the keystroke dynamics were carried out by Gaines et al.
[1] in 1980. The first results were encouraging but inapplicable in real cases because
of the low number of involved people and because of the length of the text used. In
the five last years, many studies took place on this subject, a summary of many of
them are presented in [2] and a more recent review has been conducted in [3]. In our
study, we restrict our investigations to the authentication or verification problem. Our
goal is to compare a new observation with features vector associated to only one
profile and then to decide if the observation is from the same user or not. Therefore,
we are limited to only a few observations from only one user in the learning process.
No impostor’s data are available. A great number of methods has been used to solve
this problem by using similarity measures [5], one class support machine, genetic
algorithm [6], or hidden markov model [7]…
128

3 Improvement of Some Proposed Methods
We have chosen to use a fusion of three different methods [8] to decide if a new ob-
servation is corresponding or not to a user. The first one is an adaptation of a statisti-
cal method and uses the average and the standard deviation of each feature. The sec-
ond is based on a measure of disorder between two feature vectors, and the third one
uses a discretization of the time.
3.1 The Statistical Method
This method uses statistical measures; that is to say the average and standard devia-
tion. A profile is computed with the ten logins acquired during enrolment process.
This profile contains the average and standard deviation for all times extracted from
the striking sequences. In [9], the authors simply propose to count the number of
times ti in the observation vector that are in the interval [μ
i
- σ
i
, μ
i
+ σ
i
] and to com-
pare this number with a threshold. We propose to improve the method by computing
a global score.On a feature vector of the length N, with t
i
the ith time, μ
i
and σ
i
the
average and standard deviation stored in the profile, we use equation 1 to compute the
score.
∑
=
−
−
−=
n
i
statiscal
e
i
ii
t
N
score
1
1
1
σ
μ
(1)
3.2 Time Discretization Method
The second method uses a time discretization. The time is divided in interval. Each
time is associated to an interval according to its duration. To compare an observation
with a profile, we choose to take the difference between the indexes of the interval.
For example, if a time is classified in interval four whereas it was in the second in the
profile, the difference value is two. In our experiment the number of interval is set to
5.
3.3 Ranks of Time Method
The third method studies the variation between ranks associated to different times, i.e.
to identify which times are lower than the others. A measurement of disorder between
two vectors is realized to take the final decision. This method is based on a work
presented in [10] and developed in [11]. To measure the difference between the ranks
of the times, times of each observation are sorted from the longest to the shortest.
The profile is composed of the averages of the ranks for each time calculated on the
logins in the training set. To compute the score of an observation, there are several
methods: the first (and simplest) uses the Euclidean distance between the profile and
an incoming observation. The second method consists in calculating the Spearman
129

coefficient, which is very often associated with the ranks in the literature. With ri1
the rank of time i in the observation I and N the number of equation 2 gives the final
score.
)1(*
)(*6
1
2
1
221
−
−
−=
∑
=
nn
rr
r
n
i
ii
Sp
(2)
None of these methods appeared to be entirely acceptable to us. In the keystroke
dynamics, there is frequently a time that is much longer in the observation than in the
profile because of a user hesitation. Such problem changes not only one rank, but also
the rank of all the times following. To solve this problem, we have decided to de-
crease by one the all concerned times in the observation. The sum of the difference of
times rank in the profile and in the observation provides a score of better quality.
3.4 Fusion of the Method
Each one of these three methods gives a score or a decision, score can be normalized
between 0 and 1 (Near 0: genuine user, near 1: impostor). Then, a fusion of the three
methods can be done by combining the scores or by selecting a decision based on a
vote. A score combination method, is chosen to introduce easily weight in the fusion
step. The problem is that the distribution of the scores is very dissimilar along the
used method with an average and a standard deviation very different. It is necessary
to normalize the scores before being able to combine them. Previous experiments
using fusion in biometric have shown that good results are obtained with a sum rule
[10] and a z-score normalization [11].
4 Adaptation to User
4.1 Hypothesis
In behavior biometrics, our hypothesis is that a user cannot be defined only by a set of
feature vectors. We think that the parameters of the authentication system itself
should be adapted to each user in order to improve performances. Some tests already
exist on adaptative biometric systems. For example in [12] and [13], the thresholds
and weights for the fusion are set in the objective to decrease the classification error.
The problem of these methods is the need to use information about impostors or other
data to optimize the classification error rate. In real application this kind of informa-
tion is not available. So we have decided to stay in the field of the one-class problem,
that is to say it is forbidden to use impostor data. This limitation is not only present in
keystroke dynamics but can be also found in other problems as for example the hand
draw signature verification. Our approach is to estimate the security thresholds and
other parameters with only the help of the information acquired during the enrolment
process for one person.
130

4.2 Available Data and Parameters to Estimate
After a brief state of the art on fusion methods, we have decided to use the sum rules
on normalized scores to fusion our three methods. In order to obtain a more flexible
system, weight have been added behind the score given by the three methods. So, the
final score is as equation 3.
Final score(FSC) = Σw
i
*score
i
(3)
In addition, for each method the score for each of the four time vectors (PP, PR, RP,
RR) are fusioned with the same rule. We called score
i,xy
the score computed with the
method i on the feature vector from the XY times
w
i,xy
the associated weight. Then,
score of method i is compute according equation 4.
Score
i
= w
i,pp
*score
i,pp
+
w
i,rp
*score
i,rp
+
w
i,pr
*score
i,pr
+
w
i,rr
*score
i,rr
(4)
We have normalized every set of weights to make their sum equal to 1. At the end, 15
weights and one threshold have been estimated for each user. Our objective is to
estimate the optimum set of values for the parameters using only the learning se-
quences. To achieve this goal we extract a maximum of feature from the learning set.
Then, we have tested different methods of analysis to find a relation between thresh-
old and parameters to estimate and all the available features in the user profile. These
features include the average and standard deviation of the four extracted time vectors,
the total duration of the striking sequences and some other information. We also in-
clude the average and standard deviation of scores computed by the three methods on
feature vectors. In order to compute these scores, we use the leave-one-out method:
we include in the profile nine sequences and compute the score with the last, and we
repeat the process with the other combinations of sequences. Finally, we have 35
characteristics at our disposal.
4.3 Preliminary Analysis
In the field of the authentication or identity verification, three error rates are usually
used to define the performances of a system:
• The False Rejection Rate (FRR)
• The False Acceptation Rate (FAR)
• The Equal Error Rate (EER) the rate where FRR = FAR
We use a database of 38 users, composed of user names and passwords of different
lengths (between 8 and 30 characters for the total sequence) and impostors attacks for
each user. Each user has given between 20 and 110 logins sequences and has been
attacked between 20 and 100 times. To estimate the optimum values of the 15 pa-
rameters plus the threshold, we have divided our 38 user’s database into two bases.
The first one is used to estimate the optimal values for all parameters. The second one
131

is kept for testing purpose. In order to find the best recognition rates that can be ob-
tained we have also computed the optimal parameters values by using an exhaustive
search in order to minimizing the sum of the FRR (False Rejection Rate) and the FAR
(False Acceptance Rate). To compute the FRR we have used all the login sequence of
a user and to compute the FAR we have used impostor attacks. It gives us an concern-
ing performances. The great majority of errors come from a few users. 3 users have
catastrophic performances with global parameters: an EER (Equal Error Rates) upper
10%.Two of these three users obtain bad results even with specific parameters. The
other users reach an EER of 5% with specific parameters. Next, a test of Fisher shows
that the optimum length of the stroke sequences is between 20 and 30 characters
including user name and password. The worst case is obtained with a length inferior
to 10 characters.
4.4 Estimation of the Decision Threshold
To automatically estimate the decision threshold, we have tried different methods.
First, we have tried to find a multi-linear regression between the optimum threshold
and 10 characteristics (Table 1 : 3). These 10 characteristics were selected to be those
with the greatest correlation coefficient with the optimal threshold. A second method
was to select the maximum threshold starting from the ten learning sequences (Table
1 : 3). In the last third method, we have see with the help of the optimum threshold
value, that users can be divided into three groups of equal importance around three
threshold values (0.8, 1, and 1.2). Then, when a new user arrived, we tried to class
him in one of the three classes. Then we take authentication decision by using the
threshold adapted to the class in which the user has been put. Unfortunately, we have
not found a classifier able to classify correctly a new user. We compare the perform-
ance of our two methods of threshold estimation, with a global threshold method
(Table 1 : 1) and the user specific optimum threshold (Table 1 : 2). Results are pre-
sented in Table 1.
Table 1. Threshold estimation.
Average
FRR
Average FAR Max FAR Max FRR
Global threshold (1) 3.0% 3.1% 11% 12%
Optimum threshold (2) 1.5% 2.2% 6.0% 12%
Linear regression (3) 5.4% 5.5% 20% 30%
All learning sequences accepted
(4)
14.6% 2.2% 55% 4.0%
132

Table 1 shows a great improvement of the performance with the local optimum
threshold. However, the experiments to achieve an estimation of this optimal thresh-
old are not a success. The problem comes from a few users who obtain inadequate
thresholds due to their profile variability: if a user produces once a set of quasi-
constant sequences, the threshold will be too hard and prohibited further evolutions.
In addition, if the profile varies a lot, the threshold will be too tolerant and impostors
will pass easily.
4.5 Estimation of the Fusion Weights
Once we have adapted the threshold, our objective is to adapt the weights associated
to each method in order to privilege the best method for each user. As for the thresh-
old, we have tried a few methods to estimate the optimal set of weights. First, we
have tried to make a linear estimation of the weight starting from the available fea-
tures as for the threshold. However, the obtained results were not significant. We
have not found any feature with a correct correlation with the weights and the linear
regression was very poor in quality. Our next try was to use an heuristic to minimize
the average final score (FSC) on learning sequences of a user (Table 2 : 3). We com-
pare this method, with the use of global equal weights (Table 2 : 1), and then with
global weights defined as the average of user specific optimal weights (Table 2 : 4).
Results of the fusion weights estimation are presented in
Table 2.
Table 2. Fusion weights evaluation.
Average FRR Average FAR Max FAR Max FRR
Equal Weights (1) 3.0% 3.1% 11% 12%
Optimal Weights(2) 2.1% 1.9% 8.0% 8.0%
Minimization of
total score(3)
4.0% 5.0% 20% 30%
Global weight(4) 3.2% 2.1% 12% 12%
The first thing to notice is that the use of local optimal weights (Table 2 : 1). greatly
improves the performance. The performances of the total score minimization method
are worst than those with equal weights. We interpret this result, as the fact that mini-
mizing average of the score for each user i.e., the intra-class variation cannot help the
method in order to separate authentic users from impostors. The study of the average
optimum weights first shows that we improve slightly the performance compared to
the equal weights, but we are still far away from the performance of optimal ones.
133

The detailed study of the optimum weights shows that the method based on time
ranks orders seems to be the more robust because it obtains the greatest weight with
an average optimum weight of 0.6. The two others methods have near the same aver-
age weight around 0.2. For problematic users, the weight of the statistical method rise
to the [0.6, 0.8] interval. It may show that these users keep high average typing speed,
but have great variation in the time ranks.
4.6 Estimation of Characteristic Weights
Finally, we have studied if it is useful to determine a local weight for each time fea-
ture vector (PP, PR, RP, RR). We have compared the user specific optimum weights
performance (Table 3 : 2) with the performance of the global average one(Table 3 :
3). We have observed just a little difference between the two possibilities (Table 3).
Therefore, with the experience of previous estimations, we have decided to use only
global average weights for each method.
5 Conclusion
In this paper, we have studied the influence of the personalization of some parameters
on the performances of a behavior biometric system. These parameters are the deci-
sion threshold and the weights associated to different classifiers during a fusion step.
The use of optimal personal parameters improves a lot the performances. We have
tried to estimate these values only from the data at disposal in each user training set. It
is a hard problem because we place ourselves in the case of a one class problem with
few learning sequences. For the moment, we have not found a sufficient relation
between available data and classifier parameters. We will continue to work on the
problem of adaptation of threshold and parameters to each user because we think, it is
a promising way to improve significantly the performances in the case of behavior
biometric systems.
Table 3. Weight for features vectors.
Average FRR Average FAR Max FAR Max FRR
Equal weights (1) 3.0% 3.1% 11.0% 12.0%
Optimal weights
(2)
2.8% 1.9% 10.0% 8.4%
Average weights
(3)
3.0% 2.5% 14.0% 12.8%
134

References
1. R.S. Gaines, W. Lisowski, S. J. Press, N. Z. Shapiro Authentication by Keystroke Timing:
Some Preliminary Results, Rand Report R-256-NSF, Rand Corporation, 1980.
2. J. Ilonen, Keystroke dynamics, Advanced Topics in Information Processing 1 – Lecture,
2003.
3. A. Peacock, X. Keand, M. Wilkerson, Typing Patterns: A Key to User Identification, IEEE
Security and Privacy, Vol 2, pp. 40-47, 2004
5. F. Monrose, A.D. Rubin, Keystroke dynamics as a biometric for authentication, Future
Gener. Comput. Syst., Elsevier Science Publishers, Vol 16, Num 4, pp 351-359, 2000
6. E. Yu, S.Cho, Keystroke dynamics identity verification—its problems and practical solu-
tions, Computers & Security, Vol. 23, Num. 5, pp. 428-440, 2004.
7. W. Chen, W. Chang, Applying Hidden Markov Models to Keystroke Pattern Analysis for
Password Verification, IRI, pp. 467-474, 2004
8. S. Hocquet, J.Y. Ramel, H. Cardot, Fusion of Methods for Keystroke Dynamic Authentica-
tion, Fourth IEEE Workshop on Automatic Identification Advanced Technologies, pp. 224-
229 2005
9. J. Leggett, G. Williams, M. Usnick, M. Longnecker, Dynamic identity verification via
keystroke characteristics, Int. J. Man-Mach. Stud., Academic Press Ltd, Vol 35, pp. 859-
870 , 1991
10. J. Kittler, M. Hatef, R.P.W. Duin, J. Matas On Combining Classifiers, IEEE Trans. Pattern
Anal. Mach. Intell., IEEE Computer Society, Vol. 20, pp. 226-239, 1998
11. A.K. Jain, K. Nandakumar, A. Ross, Score Normalization in Multimodal Biometric Sys-
tems, Department of Computer Science, Michigan State University, Vol. 38 ,pp 2270-2285,
2005
12. A.K. Jain, A.A. Ross, Learning user-specific parameters in a multibiometric system, ICIP,
pp. 57-60, 2002
13. J. Fierrez-Aguilarand, D. Garcia-Romero, J. Ortega-Garcia, J. Gonzalez-Rodriguez,
Adapted user-dependent multimodal biometric authentication exploiting general informa-
tion, Pattern Recognition Letters, Vol 26, pp 2628-2639 , 2005
135
