
SEMI INTERACTIVE METHOD FOR DATA MINING
Lydia Boudjeloud-Assala, François Poulet
ESIEA Pôle ECD
38, rue des docteurs Calmette et Guérin
Parc Universitaire de Laval-Changé, 53000 Laval, France
Keywords: Data Mining, interactive genetic algorithm, high dimensional data, data visualization.
Abstract: Usual visualization techniques for multidimensional data sets, such as parallel coordinates and scatter-plot
matrices, do not scale well to high numbers of dimensions. A common approach to solve this problem is
dimensionality selection. We present new semi-interactive method for dimensionality selection to select
pertinent dimension subsets without losing information. Our cooperative approach uses automatic
algorithms, interactive algorithms and visualization methods: an evolutionary algorithm is used to obtain
optimal dimension subsets which represent the original data set without losing information for unsupervised
tasks (clustering or outlier detection) using a new validity criterion. A visualization method is used to
present the user interactive evolutionary algorithm results and let him actively participate in evolutionary
algorithm search with more efficiency resulting in a faster evolutionary algorithm convergence. We have
implemented our approach and applied it to real data set to confirm it is effective for supporting the user in
the exploration of high dimensional data sets and evaluate the visual data representation.
1 INTRODUCTION
The data stored in the world are rapidly growing.
This growth of databases has far outpaced the
human ability to interpret these data creating a need
for automated analysis of databases. Knowledge
Discovery in Databases (KDD) is the non-trivial
process of identifying valid, novel, potentially
useful, and ultimately understandable patterns in
data (Fayyad & al., 1996). The KDD process is
interactive and iterative, involving numerous steps.
Data mining is one step of the KDD process. In most
existing approaches, visualization is only used
during two particular steps of the data mining
process: in the first step to view the original data or
data distribution and in the last step to view the final
results. Usual visualization techniques for
multidimensional data sets, such as parallel
coordinates (Inselberg, 1985) and scatter-plot
matrices (Carr & al., 1987) do not scale well to high
dimensional data sets. With large number of axes
representing dimensions, the user cannot detect any
pertinent information about items or cluster details.
Even with low numbers of items, high
dimensionality is a serious challenge for current
display techniques. To overcome this problem, one
promising approach is dimensionality selection (Liu
and Motoda, 1998). The first idea is to select some
pertinent dimensions without losing information in
the original data set and then visualize the data set in
this subspace. Most of these methods focus on
supervised classification and evaluate potential
solutions in terms of predictive accuracy. Few works
(Dash and Liu 2000) deal with unsupervised
classification where we do not have prior
information to evaluate potential solution. Another
promising approach focusing on unsupervised
classification is subspace clustering. Subspace
clustering methods must evaluate features in only a
subset of the data and dimensions, representing a
cluster. A survey of subspace clustering algorithms
can be found in (Parsons & al., 2004). The main idea
presented in this paper is inspired by the feature
selection, we use a filter method for clustering and
outlier detection with a new validity index combined
with a visual interactive validation. Furthermore,
some new methods called Visual data mining have
recently appeared (Poulet, 2004), trying to involve
more significantly the user in the data mining
process and using more intensively the visualization
(Aggarwal, 2002). We think it is important to
consider user perception in the dimension selection
process, according to his choice for unsupervised
learning problem. We propose semi-interactive
algorithm combining automatic algorithm,
interactive evolutionary algorithm and visualization
3
Boudjeloud-Assala L. and Poulet F. (2006).
SEMI INTERACTIVE METHOD FOR DATA MINING.
In Proceedings of the Eighth International Conference on Enterprise Information Systems - AIDSS, pages 3-10
DOI: 10.5220/0002454600030010
Copyright
c
SciTePress

methods. First evolutionary algorithm generates
pertinent dimension subsets, using a new validity
index for the two problems (clustering or outlier
detection) without losing information. Some of these
dimension subsets are then visualized using parallel
coordinates for example. The user can interactively
choose the data representation that seems significant
according to his problem and the selected dimension
subsets are then in input of the next evolutionary
algorithm generation and so on until having optimal
data representation. We have applied our method to
several high dimensional data sets and found this
approach is helpful in exploring high dimensional
data sets. This paper is organized as follows. The
next section describes related works in interactive
evolutionary algorithm, methods using visualization
in the data mining process and dimensionality
selection methods. Then we present our semi-
interactive Genetic Algorithm and details about our
evaluation function for outlier detection and
clustering. In section 4 we present the current
prototype of Viz-IGA (Visual Interactive Genetic
Algorithm) before the conclusion and future work.
2 RELATED WORKS
2.1 Interactive Evolutionary
Algorithm
There are two types of target systems for
optimization system: system whose optimization
performances are numerically defined as evaluation
functions and systems whose optimization indexes
are difficult to specify. Most engineering research
uses several optimization methods based on
minimizing error criteria and focus on the former,
including auto-control, pattern recognition,
engineering design and so on. However, to obtain
the most favourable outputs from interactive systems
that create or retrieve graphics or music, such
outputs must be subjectively evaluated. It is difficult,
or even impossible, to design human evaluation
explicit functions. Generally, the best system outputs
such as images, acoustic sound, and virtual realities
can be detected by the human senses and be
evaluated by the user impressions, preferences,
emotions and understanding. There are many
systems, not only in the artistic or aesthetic fields,
but also in the engineering, education fields and
recently in data mining field where we have
difficulties to model and evaluate problem solution.
Their system parameters or structures must be
optimized based on the user's subjective evaluation.
Since we cannot use the gradient information of our
mental psychological space, we need another
approach different from conventional optimization
methods. (Takagi, 2001) defines Interactive
Evolutionary Algorithm (IEA) as an optimization
method that adopts evolutionary algorithm (EA)
among optimization system based on subjective
human evaluation. It is simply an EA technique
whose fitness function is replaced by human user.
IEAs have been successfully applied to several
domains like for instance image synthesis where the
user evaluates images, face recognition and
knowledge discovery in databases. (Venturini& al.,
1997) present GIDE (Genetic Interactive Data
Explorer) where the main idea is to provide the user
new variables (attributes) and the corresponding 2D
graphical representations. An individual of GIDE
represents a couple of function of the initial
variables combined with different mathematical
operators which can also be viewed as a couple of
axes of the 2D graphical representation. The user is
involved to select which operators or mathematical
functions may appear in the individual. For the
evaluation, the user has an interactive process where
the individual is presented in 2D graphical form
where the two functions correspond to the two axes.
2.2 Visual Data Mining
For data mining to be effective, it is important to
include the human in the data exploration process
and combine the flexibility, creativity and general
knowledge of the human with the enormous storage
capacity and the computational power of today’s
computers. The basic idea of visual data exploration
is to present the data in some visual form, allowing
the human to get insight into the data, draw
conclusions and directly interact with the data.
Visual data mining techniques have proven to be of
high value in exploratory data analysis and they also
have a high potential for exploring large databases.
Visual data exploration is especially useful when
little is known about the data and the exploration
goals are vague. Since the user is directly involved
in the exploration process, shifting and adjusting the
exploration goals is automatically done if necessary
(Keim, 2002). The visual data exploration process
can be seen as hypothesis generation process: the
visualizations of the data allow the user to gain
insight into the data and come up with new
hypotheses. The verification of the hypotheses can
also be done via visual data exploration but it may
also be accomplished by automatic techniques from
statistics or machine learning. In addition to the
direct involvement of the user, the main advantages
of visual data exploration over automatic data
mining techniques are:
ICEIS 2006 - ARTIFICIAL INTELLIGENCE AND DECISION SUPPORT SYSTEMS
4

- visual data exploration can easily deal with
highly heterogeneous and noisy data,
- visual data exploration is intuitive and requires
no understanding of complex mathematical or
statistical algorithms or parameters.
As a result, visual data exploration usually
allows a faster data exploration and often provides
better results, especially in cases where automatic
algorithms fail. This fact leads to a high demand for
visual exploration techniques and makes them
indispensable in conjunction with automatic
exploration techniques. In data mining, some new
methods have recently appeared (Poulet, 2004),
trying to involve more significantly the user in the
process and using more intensively the visualization
(Aggarwal, 2002). We think it is important to
consider user perception to overcome the drawbacks
of dimension selection process and propose new
approach where the user choice is combined with
automatic fitness function. These automatic fitness
functions are applied to eliminate a great part of
redundant and noisy solutions and the interactive
fitness is applied to evaluate the visual interpretation
as understandable or not.
2.3 Dimensionality Selection
Dimension selection attempts to discover the
attributes of a dataset that are the most relevant to
the data-mining task. It is a commonly used and
powerful technique for reducing the dimensionality
of a problem to more manageable levels. Feature
selection involves searching through various feature
subsets and evaluating each of these subsets using
some criterion (Liu and Motoda, 1998). The
evaluation criteria follow one of the two basic
models, the wrapper model and the filter model. The
wrapper model techniques evaluate the dataset using
the data-mining algorithm that will ultimately be
used. Algorithms based on the filter model examine
intrinsic properties of the data to evaluate the feature
subset prior to data mining. Much of the work in
feature selection has been directed at supervised
learning. The main difference between feature
selection in supervised and unsupervised learning is
the evaluation criterion. Supervised wrapper models
use classification accuracy as a measure of
goodness. The filter-based approaches almost
always rely on the class labels, most commonly
assessing correlations between features and the class
labels. In the unsupervised clustering problem, there
are no universally accepted measures of accuracy
and no class labels. However, there are a number of
methods that adapt feature selection to clustering.
The wrapper method proposed in (Kim & al., 2000)
forms a new feature subset and evaluates the
resulting set by applying a standard k-means
algorithm. The EM clustering algorithm can also be
used in the wrapper framework (Dy and Brodley,
2000). Hybrid methods have also been developed
that use a filter approach as a heuristic and refine the
results with a clustering algorithm. In addition to
using different evaluation criteria, unsupervised
feature selection methods have employed various
search methods in attempts to scale to large, high
dimensional datasets. With such datasets, genetic
searching becomes a viable heuristic method and has
been used with many of the aforementioned criteria
(Boudjeloud and Poulet, 2005a). Another promising
approach focusing on unsupervised classification is
subspace clustering. A survey of subspace clustering
algorithms can be found in (Parsons & al., 2004).
The two main types of subspace clustering
algorithms can be distinguished by the way they
search for subspaces. A naive approach might be to
search through all possible subspaces and use cluster
validation techniques to determine the subspaces
with the best clusters. This is not feasible because
the subset generation problem is intractable. More
sophisticated heuristic search methods are required
and the choice of a search technique determines
many other characteristics of an algorithm. (Parsons
& al., 2004) divide subspace clustering algorithms
into two categories based on how they determine a
measure of locality used to evaluate subspaces. The
bottom-up search method takes advantage of the
downward closure property of density to reduce the
search space, using an APRIORI style approach. The
top-down subspace clustering approach starts by
finding an initial approximation of the clusters in the
full feature space with equally weighted dimensions.
For the subspace clustering methods many
parameters tuning are necessary in order to get
meaningful results. The most critical parameters for
top-down algorithms are the number of clusters and
the size of the subspaces, which are often very
difficult to determine a priori. Since subspace size is
a parameter, top-down algorithms tend to find
clusters in the same or similarly sized subspaces. For
techniques that use sampling, the size of the sample
is another critical parameter and can play a large role
in the quality of the final results.
3 SEMI INTERACTIVE GENETIC
ALGORITHM
The large number of dimensions of the data set is
one of the major difficulties encountered in data
mining. We use genetic algorithm (Boudjeloud and
Poulet, 2004), (Boudjeloud and Poulet, 2005a) for
dimension selection with the individual represented
SEMI INTERACTIVE METHOD FOR DATA MINING
5

by a small subset of dimensions. The different
parameters used in the genetic algorithm are
described in (Boudjeloud and Poulet, 2004).
(Boudjeloud and Poulet, 2005b) report in their paper
that to obtain ideally an understandable data
visualization, we have to visualise data with about
some tens dimensions using standard visualization
methods (the value is user-defined). We choose to
represent a small subset of dimensions to obtain an
understandable data representation. The population
of the genetic algorithm is first evaluated by new
index validity for the two problems (outlier detection
or clustering) and then some data visualizations are
proposed for user validation. The originality of our
approach is to combine both user interactive
validation and automatic validation to increase
algorithm convergence. The advantage is the
proposed solutions are not biased by the user choice
or automatic fitness function, but both are
considered to generate next evolutionary algorithm
generation.
3.1 Attribute Subset Evaluation
The main idea of our method is to measure the
adequacy of the attribute subset with the original
dataset in terms of cluster structure without losing
information. Let T be a set of N feature vectors with
dimensionality D, T (N*D). Let A = {a
1
, a
2
, …, a
D
}
be the set of all attributes a
i
of T. Any subset S ⊂ A,
is a subspace or attribute (dimension) subset. The
goal of clustering is to partition datasets into
subgroups such that objects in each particular group
are similar and objects in different groups are
dissimilar. Our objective is to select an attribute
subset with few or no loss of information for high
dimensional data clustering and to obtain the same
distribution in the subspace as the one obtained in
the whole dataset.
Clustering quality. (Milligan and Cooper, 1985)
compared thirty methods for estimating the number
of clusters using four hierarchical clustering
methods. The criteria that performed the best in
these simulation studies with a low level of error in
the data was (CH) a pseudo F-statistic developed by
(Calinski and Harabasz, 1974). This index is based
on clusters’ compactness in term of intra-cluster
variance and separation between clusters in term of
inter-cluster variance.
CH = (SSB/(k-1))/(SSW/(N-k)),
()
,
2
k
k
k
mmcSSB −=
∑
∑∑
∈
−=
kCx
k
ki
mxSSW ,)(
2
where k represents the cluster number, N the
whole dataset cardinality, |C
k
| cardinality of the
cluster k, m
k
the centre of the cluster k and m the
centre of the dataset. SSW refers then to the within
group sum of squares and SSB refers to the between
group sum of squares. The Calinski and Harabasz
index is generally used to set the number of clusters
(k), the highest CH value corresponds to the optimal
cluster number. We use this measure to first
determine the optimal cluster number without
requiring the user to specify parameter and then as
clustering quality criterion (in term of compactness
and separation) for data subspace. When we
maximize the CH value, we obtain the optimal
compactness and separation between clusters in the
dataset or subspace. However, if we use only this
measure to evaluate attribute subsets, we must verify
the point distribution in the clusters, for this purpose
we introduce a measure for the distribution quality.
Distribution quality. We introduce a distribution
quality measure to evaluate the adequacy between
the whole dataset (T) and the subspace (S) according
to the data distribution in the different clusters. Let
R
S
and R
T
measures represent the inverse of the
harmonic mean of the data point distribution in
different clusters (
S
i
N
) in the subspace S and (
T
i
N
)
in the whole dataset T. R
T
has a fixed value and we
search the subspace S that obtains the best R
S
value
according to the user task (clustering or outlier
detection).
As shown in left part of the figure 1, if R
S
/R
T
=1,
we obtain the same data distribution in the clusters
in T and S, when R
S
/R
T
is around 1, only some
elements (they are near the frontiers) swap between
clusters. In this case, S is the optimal attribute subset
that represents (T) the whole dataset in term of
clustering. This subspace represents more clearly the
data distribution. As shown in the right part of the
figure 1, when we search the maximal value of
R
S
/R
T
we obtain clusters that can contain outliers.
Four outliers are detected and we visualize the
corresponding data projection.
⎩
⎨
⎧
≈
===
∑∑
==
OutliersMax
cluster
s
Same
R
R
N
N
R
N
N
R
T
S
k
i
i
T
k
i
i
S
TS
)1(1
,,
11
ICEIS 2006 - ARTIFICIAL INTELLIGENCE AND DECISION SUPPORT SYSTEMS
6
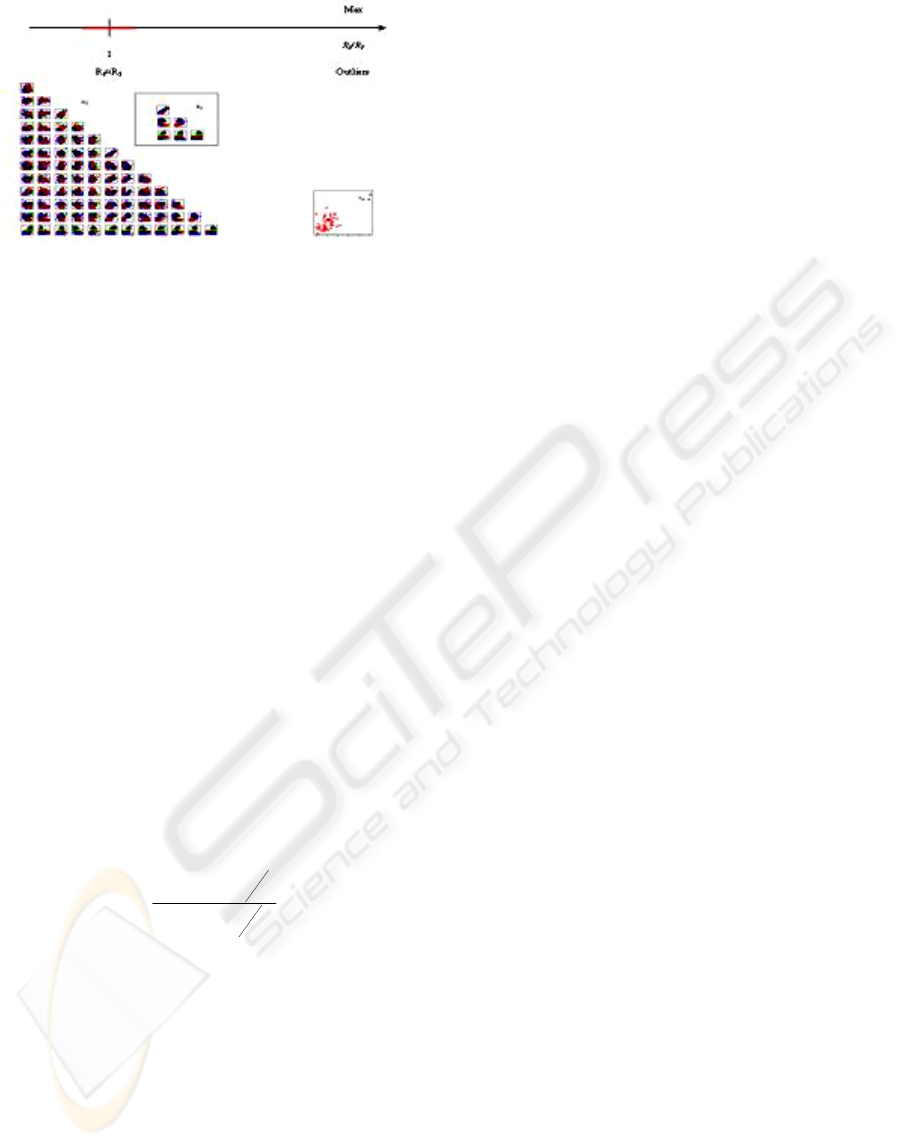
Figure 1: Distribution quality evolution.
Combination. Our problem is to maximize the
clustering quality and according to the user choice
maximize R
S
/R
T
to detect outliers or find R
S
/R
T
=1 to
respect the original distribution of the dataset. We
have two quality criteria to simultaneously optimize.
(Freitas, 2004) presents a review of three different
approaches where two or more quality criteria must
be simultaneously optimized. The first approach is
to transform the original multi-objective problem
into a single-objective problem by using a weighted
formula. The second solution is a lexicographical
approach, where the objectives are ranked in order
of priority. The last solution is the Pareto approach,
which consists in finding as many non-dominated
solutions as possible and returns the set of non-
dominated solutions to the user. The conclusion is
the weighted formula is far the most used in data
mining. We choose to combine our two measures
through the F-measure defined by (Van Rijsbergen,
1979) and classically used in the information
retrieval field to combine recall and precision. The
F-measure is considered as a weighted formula, we
apply it to CH and R
S
/R
T
which have both to be
maximized (according to the user problem choice).
We define the global criterion SE to maximize.
where b is a weighting parameter controlling the
relative importance of the two aims in the
evaluation. If b=1 for instance, SE gives same
weight for a good clustering and distribution data.
3.2 Attribute Subset Search
When we are searching for the best attribute subset,
we must choose the same number of clusters as the
one used when we run clustering in the whole
dataset, because we want to obtain a subset of
attributes having the same information (ideally) as
the one obtained in the whole dataset. We first use
the described measure (CH) to find the best number
of clusters for the whole dataset. The method is to
find the maximum value max
k
of CH
k
(where k is the
number of clusters and CH
k
the Calinski index value
for k clusters) (Boudjeloud and Poulet, 2004). For
this purpose, we use the k-means algorithm. Our
algorithm computes all CH index values where k
takes values in the set (2, 3, …, a maximum value)
and selects the maximum value max
k
of the CH
measure and the corresponding value of k. Then we
try to find an optimal combination of attribute
subsets with a genetic algorithm having SE value as
fitness function. Our objective is to find a subset of
attributes that best represents the configuration of
the dataset and discover the same configuration of
the clustering (number, contained data, …) for each
cluster. The number of clusters is the value obtained
for the whole dataset and we search the attribute
subset that has the optimal SE value according to the
user choice: clustering or outlier detection. Using
this approach of cluster validity our goal is to
evaluate the clustering results or outlier detection in
the attribute subset selected by the genetic
algorithm.
3.3 Some Results
We applied our method on several datasets: Colon
tumor (62 elements, 2000 attributes), Lung cancer
(32 elements, 12533 attributes) and Ovarian tumor
(253 elements, 15154 attributes) from the Kent
Ridge Biomedical dataset repository (Jinyan and
Huiqing, 2002) and Vehicule (946 elements, 18
attributes) from the UCI Machine Learning dataset
repository (Blake and Merz, 1998). The results are
presented as follows: k Opt (optimal number of
clusters) and Rp opt (optimal cluster data
distribution) are obtained in the whole dataset with
an optimization search. We have applied a genetic
algorithm to obtain an attribute subset that best
represents the whole dataset in clustering and the
attribute subset where we can clearly detect outliers.
In table 1 we present corresponding results obtained
in different subspaces: Rp sub (subspace data
distribution), R
S
/R
T
and SE corresponding values of
the attribute subset. We present the optimal results
for clustering (where R
S
/R
T
=1), and results obtained
for outlier detection (where we maximize R
S
/R
T
).
We run our genetic algorithm with SE values as
fitness function. For outlier detection we search for
the maximal SE value. For clustering we add the
constraint R
S
/R
T
=1 and we search the optimal
subspace (S). We obtain with R
S
/R
T
=1, the same
clustering schema as obtained in the whole dataset
(figure 2a Ovarian dataset with scatter-plot matrices
visualization) and outlier detection when we
,
)(
)1(
2
2
T
S
T
S
R
R
CHb
R
R
CHb
SE
+⋅
⋅⋅+
=
SEMI INTERACTIVE METHOD FOR DATA MINING
7
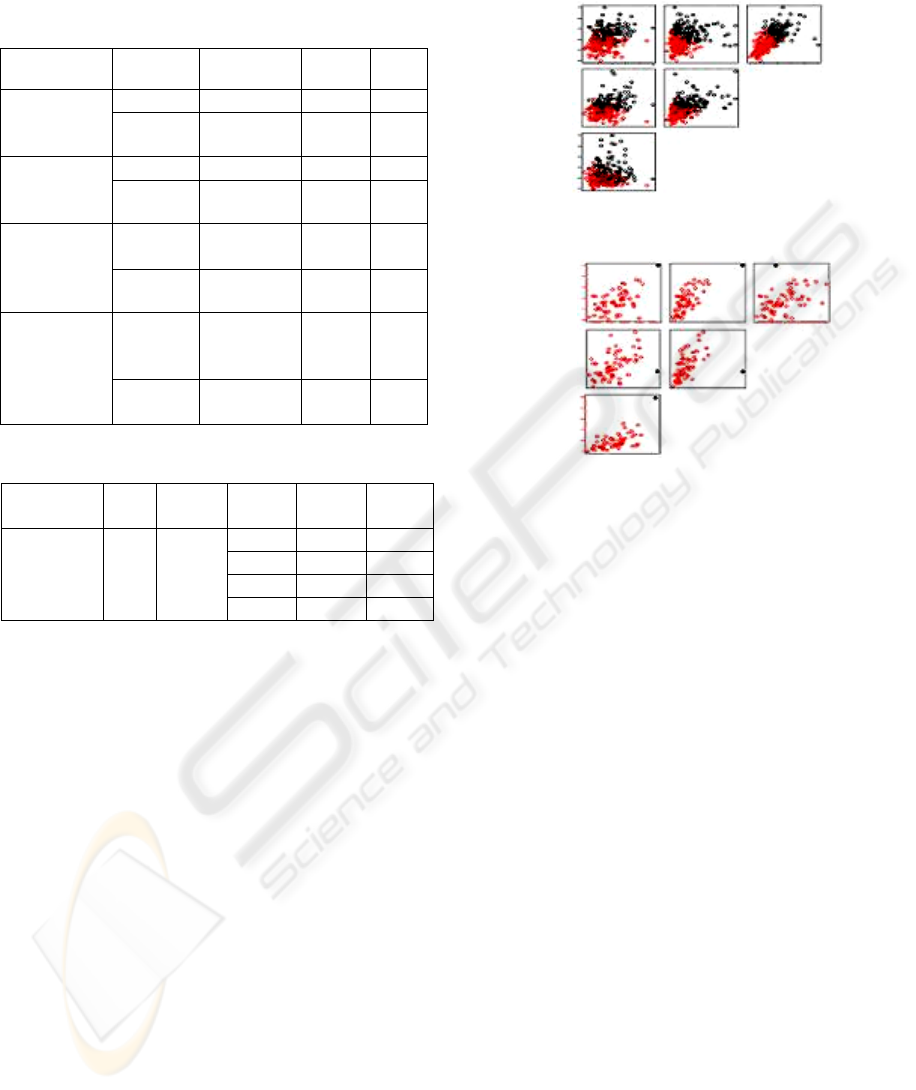
maximize SE as shown in the figure 2b (Lung
dataset).
Table 1: Dataset results.
Dataset R
P
Opt R
P
Sub R
S
/R
T
SE
11-21 11-21 1 1.94 Lung
32*12533
k Opt = 2
outlier 1-31 7.45 13.8
18-44 18-44 1 1.95 Colon
62*2000
k Opt = 2
outlier 5-57 2.77 5.06
117-
136
117-136 1 1.98 Ovarian
253*1515
4
k Opt = 2
outlier - - -
3-13-
16-23-
39
3-13-16-
23-39
1 1.95 Vehicule
946*18
k Opt = 5
outlier 1-1-22-
27-43
3.87 7.31
Table 2: Lung cancer dataset results.
Dataset k
Opt
Rp
Opt
Rp
Sub
R
S
/R
T
SE
5-27 1.71 3.35
11-21 1 1.94
2-30 3.85 7.22
Lung
32*12533
2 11-21
1-31 7.45 13.82
We also present different results obtained
according to SE values in table 2 for the Lung
cancer dataset. When we apply our method to obtain
optimal cluster number with the k-means algorithm
in the whole dataset we obtain the optimal cluster
number equal to 2 and the optimal data distribution
is 11 elements in the first cluster and 21 elements in
the second cluster. In one hand, when we search the
optimal value of SE adding the constraint of
R
S
/R
T
=1, we find the same data distribution with 11
elements in the first cluster and 21 elements in the
second cluster and when we visualize the data in the
subspace, we note that we obtain exactly the same
clusters ( figure 2a for the Ovarian dataset). In other
hand, when we search the optimal value of SE
without any constraint, we find one cluster with only
one element: it is the outlier and when we visualize
the data (figure 2b) we see clearly it is different from
other elements. We can also obtain clusters
(according to SE value - in table 2) having 2 or 5
elements that can be considered as outliers. For all
datasets we obtain the same results (clusters and
outlier element) in the different subsets selected by
our method as in the whole dataset. For Ovarian
dataset we don’t obtain cluster having only few
elements for this reason we do not describe outlier
results in the table 1.
Figure 2a: Subset clustering for the Ovarian dataset.
Figure 2b: Outlier detection in the Lung dataset.
4 VIZ-IGA SYSTEM
In this section, we describe Viz-IGA, a system
which explores different attribute combinations in
interaction with the domain expert. The algorithm
chooses randomly 9 individuals that are proposed to
the user as we can see in the figure 3 and the user
can choose the data visualizations that seem
significant for his problem. In our example the
problem is outlier detection, we want to find data
visualization where we can see element that is
different from the whole data set.
Before this, the first initialisation of evolutionary
population is the following: we represent the
individual by a combination of different dimensions
that are picked in the whole set of dimensions. At
this step, the first population is ready; it is evaluated
by the validity measure described in section 3.1.
Once the population is evaluated and sorted we
propose them for the user appreciation. Figure 3
shows data representation of some evolutionary
individuals proposed for outlier detection problem
(our example).
ICEIS 2006 - ARTIFICIAL INTELLIGENCE AND DECISION SUPPORT SYSTEMS
8
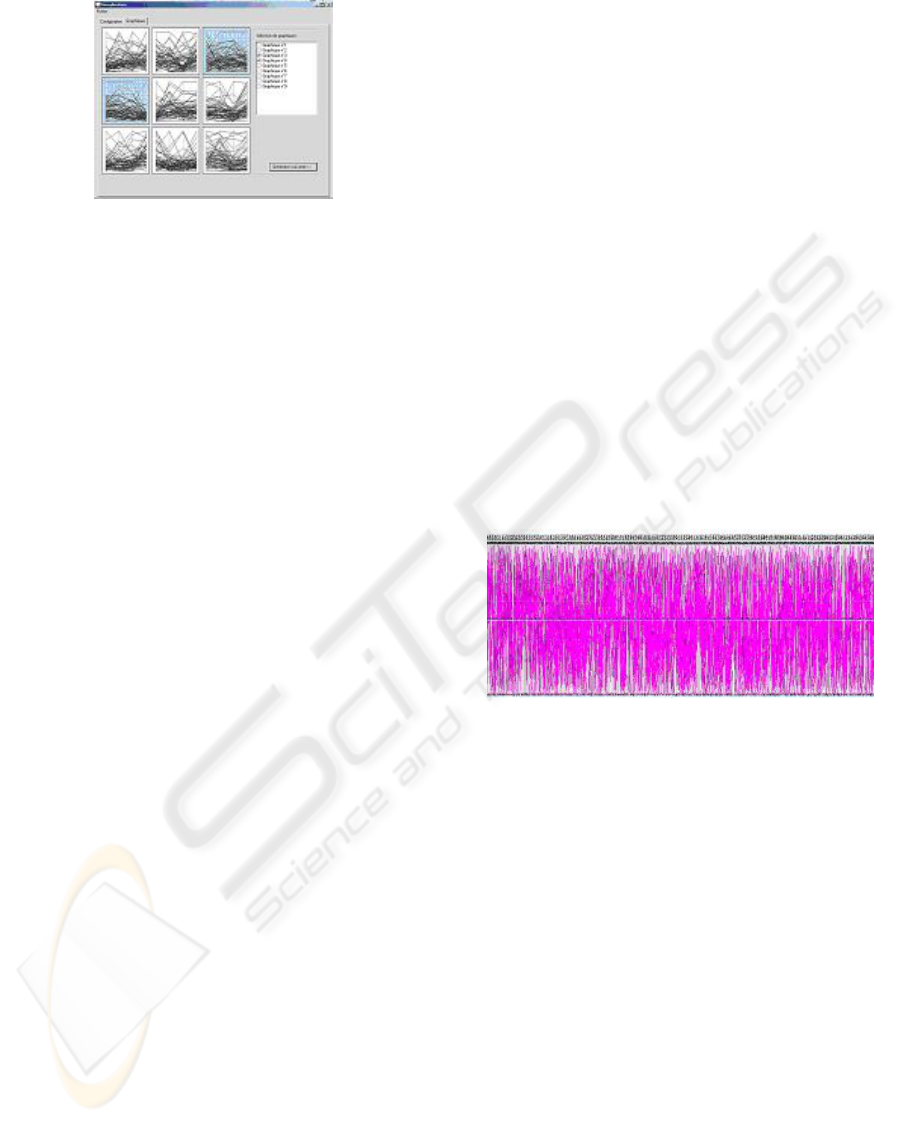
Figure 3: Visualized generations and selected individuals.
Once the initial population has been seen, we
observe different data visualizations and we note the
third and fourth ones contain element that has
extreme values and can be outlier. We select these
data visualizations with a mouse click or by
selecting them in the right part of the screen near
their identifications and they appeared different from
others (as shown in the figure 3). Genetic algorithm
considers the dimension subsets that correspond to
these selected visualizations and are then in input of
the next genetic algorithm generation. The user can
choose the size of the attribute subset and the
different visualization display: scatter-plot matrices,
parallel coordinates or star plot. He can also choose
the order of the attributes in the visualization. We
evaluate how human involvement speeds up the
convergence of the EA search. Since our approach
deals with subjective fitness value combined with
black box fitness depending on the application task
(clustering or outlier detection), we compare
convergence of the evolutionary algorithm described
in (Boudjeloud and Poulet, 2004) and Viz-IGA. The
role of human in Viz-IGA is to select the best
candidates in the d-D visualization (d is user-
defined), while in the GA, the user only validates the
final result. We obtain the same outlier in the
attribute subset as in the whole data set and we
obtain the same selected attributes subset with less
generation with Viz-IGA than the standard GA.
5 CONCLUSION AND FUTURE
WORK
We propose in this paper to use user perception to
overcome drawbacks of dimension selection process
for two unsupervised learning problems. We have
developed a semi-interactive algorithm, integrating
automatic algorithm, interactive evolutionary
algorithm and visualization methods. First
evolutionary algorithm generates pertinent
dimension subsets using our new criterion,
according to user choice (clustering or outlier
detection) without losing information. Some of these
dimension subsets are then visualized using parallel
coordinates or scatter-plot matrices. The user can
interactively choose the representation that seems
the most significant and select dimensions in input
of the next evolutionary algorithm generation and so
on until having optimal data visualization. We
introduce a new criterion flexibly combining in an
F-measure a clustering quality index with
distribution quality for subspace clustering and
outlier detection. The numerical experiments and
visualizations show it is an efficient tool to evaluate
subspace clustering and outlier detection. Its main
advantage lies in its flexibility which makes it
possible for the user to find in a subset of
dimensions same clusters or to detect same outliers
as in the whole dataset. Furthermore the number of
dimensions used being low enough this allows the
user to explicitly understand clustering or outlier
detection results with the final visualization. We
must keep in mind that we work with high
dimensional datasets. This step is only possible
because we use a subset of dimensions of the
original data as we can see in the figure 4.
Figure 4: 100 dimensions of the Lung cancer data set
displayed with parallel coordinates
.
We have tested our methods on different high
dimensional biomedical datasets where our criterion
selects the best subspace of dimensions. We have
used the k-means clustering algorithm, the new
validity criterion SE and a genetic algorithm (for the
attribute selection) having the value of the SE
validity criterion as fitness function. Our first
objective is to obtain subsets of attributes that best
represent the dataset distribution (number, contained
data). This kind of approach is only suitable for
numerical datasets (if some attributes are categorical
they must be transformed into numerical values).
Our criterion needs the computation of R
T
(mean of
the dataset point) we intend to overcome this
problem by another criterion requiring no
computation on the whole dataset. We also obtain
some local optima, we think to improve this part by
tuning some parameters of the genetic algorithm.
SEMI INTERACTIVE METHOD FOR DATA MINING
9

REFERENCES
Blake C.L., Merz C.J. 1998, UCI Repository of Machine
Learning Databases Irvine, CA: University of
California, Department of Information and Computer
Science. [http://www.ics.uci.edu /~mlearn/MLR
epository.html] .
Boudjeloud L., Poulet F. 2004, A Genetic Approach for
Outlier Detection in High Dimensional Data Sets, in
Modelling, Computation and Optimization in
Information Systems and Management Science, Le
Thi H.A., Pham D.T. Eds, Hermes Sciences
Publishing, pp 543-550.
Boudjeloud L., Poulet F. 2005a, Attributes selection for
high dimensional data clustering, in proc. of XI
th
International Symposium on Applied Stochastic
Models and Data Analysis, ASMDA'05, pp 387-395.
Boudjeloud L., Poulet F. 2005b, Visual Interactive
Evolutionary Algorithm for High Dimensional Data
Clustering and Outlier Detection, in Advances in
Knowledge Discovery and Data Mining, T.B. Ho, D.
Cheung, and H. Liu (Eds.), LNAI 3518, Springer-
Verlag, PAKDD 2005, pp 426 – 431.
Calinski R.B. and Harabasz J., 1974. A dendrite method
for cluster analysis. In Communication in statistics,
volume 3, pages 1–27.
Carr D. B., Littlefield R. J., Nicholson W. L. 1987,
Scatter-plot matrix techniques for large N, Journal of
the American Statistical Association, 82(398), pp 424-
436, Littlefield.
Dash M., Liu H. 2000, Feature selection for clustering. In
Proc. Pacific-Asia Conf. on Knowledge Discovery and
Data Mining, pp 110-121.
Dy J. G., Brodley C. E. 2000, Feature subset selection and
order identification for unsupervised learning. In
Proceedings of the Seventeenth International
Conference on Machine Learning, pp 247-254.
Fayyad U., Piatetsky-Shapiro G., Smyth P. 1996, The
KDD process for extracting useful knowledge from
volumes of data, Communications of the ACM, 39(11),
pp 27-34.
Freitas A. A. 2004, A Critical Review of Multi-Objective
Optimization in Data Mining: A Position Paper, ACM-
SIGMOD’04, pp 77-87, vol. 6, n° 2.
Inselberg A. 1985, The Plane with Parallel Coordinates,
Special Issue on computational Geometry, vol 1, pp
69-97.
Jinyan L., Huiqing L. 2004, Kent ridge bio-medical data
set repository, http://sdmc.-lit.org.sg/GEDatasets.
accede in December 2004.
Keim D.A. 2002, Information visualization and visual data
mining, IEEE transaction on visualization and
computer graphics, 7(1), pp 100-107.
Kim Y., Street W., Menczer F. 2000, Feature selection for
unsupervised learning via evolutionary search. In
Proceedings of the Sixth ACM SIGKDD International
Conference on Knowledge Discovery and Data
Mining, pp 365-369.
Liu H., Motoda H. 1998, Feature detection for knowledge
discovery and data mining, Kluwer Academic
Publishers.
Milligan G., Cooper M. 1985, An examination of
procedures for determining the number of classes in a
data set, Psychometrika, vol.52, n°2, pp 159-179.
Parsons L., Haque E., Liu H. 2004, Subspace clustering
for high dimensional data: a review, Special issue on
learning from imbalanced datasets, ACM SIGKDD
Explorations Newsletter, vol 6, n° 1, pp 90-105, 2004.
Poulet F. 2004, SVM and Graphical Algorithms: a
Cooperative Approach, in proc. of IEEE ICDM, the
4th International Conference on Data Mining, pp 499-
502.
Takagi H. 2001, Interactive Evolutionary Computation:
Fusion of the Capacities of EC Optimization and
Human Evaluation, Proceedings of the IEEE, Vol.89,
No.9, pp1275-1296.
Van Rijsbergen C.J. 1979, Information retrivial,
Butterworth, London.
Venturini G., Slimane M., Morin F., Asselin de Beauville
J.P. 1997, On Using Interactive Genetic Algorithms
for Knowledge Discovery in Databases, in 7th
International Conference on Genetic Algorithms, pp
696-703.
ICEIS 2006 - ARTIFICIAL INTELLIGENCE AND DECISION SUPPORT SYSTEMS
10
