
A SEMI-AUTOMATED QUALITY ASSURANCE TOOLBOX FOR
DIAGNOSTIC RADIOLOGICAL IMAGING
Christodoulos Constantinou
1
, Andreas Grondoudis
2
, Andreas Christoforou
2
Christakis Constantinides
1,3
, Andreas Lanitis
2
1
CNC Medical Physics Limited, 14 E. Loizidou, Strovolos, Nicosia, Cyprus
2
School of Computer Science and Engineering, Cyprus College,P.O. Box 22006, Nicosia, Cyprus.
3
Department of Mechanical and Manufacturing Engineering, , University of Cyprus, 75 Kalipoleos, Nicosia, Cyprus,
Keywords: Automated Quality Assurance, Diagnostic Radiology, Image Processing, Data Management System.
Abstract: Magnetic Resonance (MRI), Computed Tomography (CT) and Ultrasound (US) are three of the most
commonly used clinical imaging modalities. The aim of this study was to establish a Quality Assurance
program for MRI, CT and US scanners. A well-designed quality assurance program is of utmost importance
in the clinical setting, because it indicates whether diagnostic imaging modalities meet the minimum criteria
of acceptable performance and because it helps determine those scanner parameters that need adjustment in
order to ensure optimum performance. Quality assurance programs that rely on manual data collection and
analysis are tedious and time consuming and are often abandoned due to the significant workload required
for their implementation. In this paper we describe an integrated software system for automating the process
of data collection and management in Quality Assurance for diagnostic radiological imaging. The developed
system is comprised of two main units: The Image Processing Unit (IPU) and the Data Management Unit
(DMU). The IPU is used for analysing images from different diagnostic modalities in order to extract
measurements. The IPU is dynamically linked to the DMU so that measurements are transferred directly to
the DMU. This process allows the generation of quality assurance reports for all such modalities.
1 INTRODUCTION
Quality assurance (QA) programs are essential for
diagnostic radiological modalities. Apart from their
intended purposes to detect changes in the
equipment’s performance, they allow early
identifications of deviations from pre-determined
accuracy limits, and reduce unnecessary radiation or
radiofrequency exposure to patients. Early on, Task
Groups (Och1992) were formed for safety and QA
for various diagnostic modalities, both in the USA
and Europe. Price et. al. (Price1990) developed basic
algorithms and procedures for Magnetic Resonance
Imaging (MRI), but Bourel et. al. (Bourel1999) was
the first to present automatic quality assessment
software. A more elaborate effort was the recent
work of McRobbie et. al. (McRobbie2002) that
summarized results over a period of 8 years, for 17
MRI scanners, and recommended standards for
corrective action.
In this work we take advantage of prior efforts
for developing QA programs and protocols for
diagnostic radiological equipment using
methodology and guidelines proposed by the
American College of Radiology (Radiology1996),
the American Association of Physicists in Medicine
(AAPM) and the Eurospin tests (Lerski1993), to
develop algorithms and semi-automated procedures
to perform QA in MRI, Computed Tomography
(CT), and Ultrasound (US). No prior work has been
reported that involves a generalised and
comprehensive approach for QA for all these
modalities, that uses fast, semi-automated
procedures, employing basic and advanced image
processing for data analysis and generation of
results, as proposed in this work. Such effort is
realised by developing an Image Processing Unit
(IPU) that provides all the necessary functionalities
required for assessing the quality of medical images.
The IPU is integrated with a Data Management Unit
216
Constantinou C., Grondoudis A., Christoforou A., Constantinides C. and Lanitis A. (2006).
A SEMI-AUTOMATED QUALITY ASSURANCE TOOLBOX FOR DIAGNOSTIC RADIOLOGICAL IMAGING.
In Proceedings of the Eighth International Conference on Enterprise Information Systems - AIDSS, pages 216-221
DOI: 10.5220/0002445802160221
Copyright
c
SciTePress

(DMU) in order to allow data transfer and provide a
data repository for longitudinal serial measurements
and results from diagnostic equipment.
The main focus and value of this work relates to
the development of an integrated software system
that deals effectively with the application of
systematic quality control and quality assurance
control programs for diagnostic radiological imaging
equipment. The development of such a system will
contribute towards the enforcement of systematic
quality control in diagnostic centres in order to
ensure optimum performance of imaging equipment.
The QA methodology adopted in our work
involves phantom tests and measurements on an
MRI, a CT, and an ultrasound scanner. A typical
phantom used for MRI quality control is shown in
figure1. The general procedure of the QA process is
as follows:
a. The parameters of the scanner unit are determined.
Recorded parameters include demographic details
and data acquisition parameters.
b. Once the scanner is in operation a number of
measurements using electronic instruments are
performed. In the case of MRI scanners for
example, the intensity and uniformity of the
magnetic field is measured.
c. Images of dedicated phantoms are generated.
d. Measurements related to the appearance of
phantoms in the images obtained in step (c) are
extracted. This process usually involves manual
inspection of the images and/or the use of image-
processing packages.
e. All parameters derived from the previous steps are
used to calculate various quantities required for
assessing the diagnostic quality of the images.
Such quantities assess discrepancies between the
expected and actual features.
f. Based on the results obtained from step (e), a QA
report is generated.
Significant workload is required for carrying out
the method outlined above which justifies our effort
for automating this process. Considering that
effective quality control procedures involve periodic
inspection for each scanner unit, automation of the
QA process becomes an essential and integral part of
a QA program. With this work, we aim to automate
processes in steps d, e and f, and to provide an
effective system for managing the application of
periodic QA control to a large number of MRI, CT
and US scanners.
Figure 1: ACR phantom used for MRI QA (left), and a
typical sagital MRI image (right).
2 SYSTEM DESCRIPTION
The system is divided into two main components –
the Data Management Unit (DMU) and the Image
Processing Unit (IPU). The IPU is used to allow the
user to perform QA related measurements on
medical images. Such measurements can then be
transferred to the DMU for further processing and
storage.
2.1 Data Management Unit
The data engine of the project is a relational
database. It relates clients that own specific imaging
units (modalities) with their modalities, and links
modalities with periodic QA tests and their results.
QA test results are determined based on user-defined
parameters and image measurements from analysed
images generated from the scanner unit under
inspection. The DMU also allows generation of
basic reports summarising the QA results based on
the information that is stored in the database tables.
The Database Model: The model relates three
primary entities as part of the system: the clients, the
modalities (that each client owns), and the QA tests
that are performed on these modalities. Figure 2
depicts these entities together with their
interrelations and some of the secondary tables and
entities of the model.
The information stored for every client includes
the primary demographic information, such as the
owner name and basic contact details. The data
collected for each modality is more elaborate. The
unit is documented with respect to its name,
modality type, client, manufacturer, model, and
serial number. Included in the modality are also
details on the purchased date and the date the
equipment was last-serviced, with related comments.
We refer to a test as a collection of smaller, more
specific, individual tests that can be run for the unit.
These tests (collectively referred to as sub-tests for
clarity) focus on specific areas/aspects of the
A SEMI-AUTOMATED QUALITY ASSURANCE TOOLBOX FOR DIAGNOSTIC RADIOLOGICAL IMAGING
217
modality under inspection and vary depending on
the modality type.
Secondary entities that are part of the database
model include users and user types, acceptance
criteria, forms of the interface, images and imaging
fields, lookups (for standard lookup values) and
lookup types, manufacturers, modality types, units
and testing tools.
Database Functionality: The database itself and the
interface are custom-built software components.
Their functionality is unique, defined by the
interdependence of the database and the imaging
engine. The results from measurements and
calculations must conform and comply with required
standards but their representation, manipulation and
eventual reporting will be unique. The
functionalities of database and interface software are
outlined in the following:
a. Generation of quality assurance results: Each of
the subtests conducted has been programmed to
produce a pass/fail result. The outcome of the
criterion depends on either one or more (or a
combination of) pre-determined factors. These
factors include measurements on images, values
depending on the imaging unit, standard lookup
values, parameters entered by the user etc.
b. Inter-operability with the imaging engine: The
database’s interface can, on demand start the IPU (if
it is not already running), and communicate certain
sub-tests to be performed by the imaging engine. On
returning from completing those tests, the database
interface is able to import the resulting
measurements and update the relevant tables with
the recently acquired/calculated values.
Figure 2: Database Model entities.
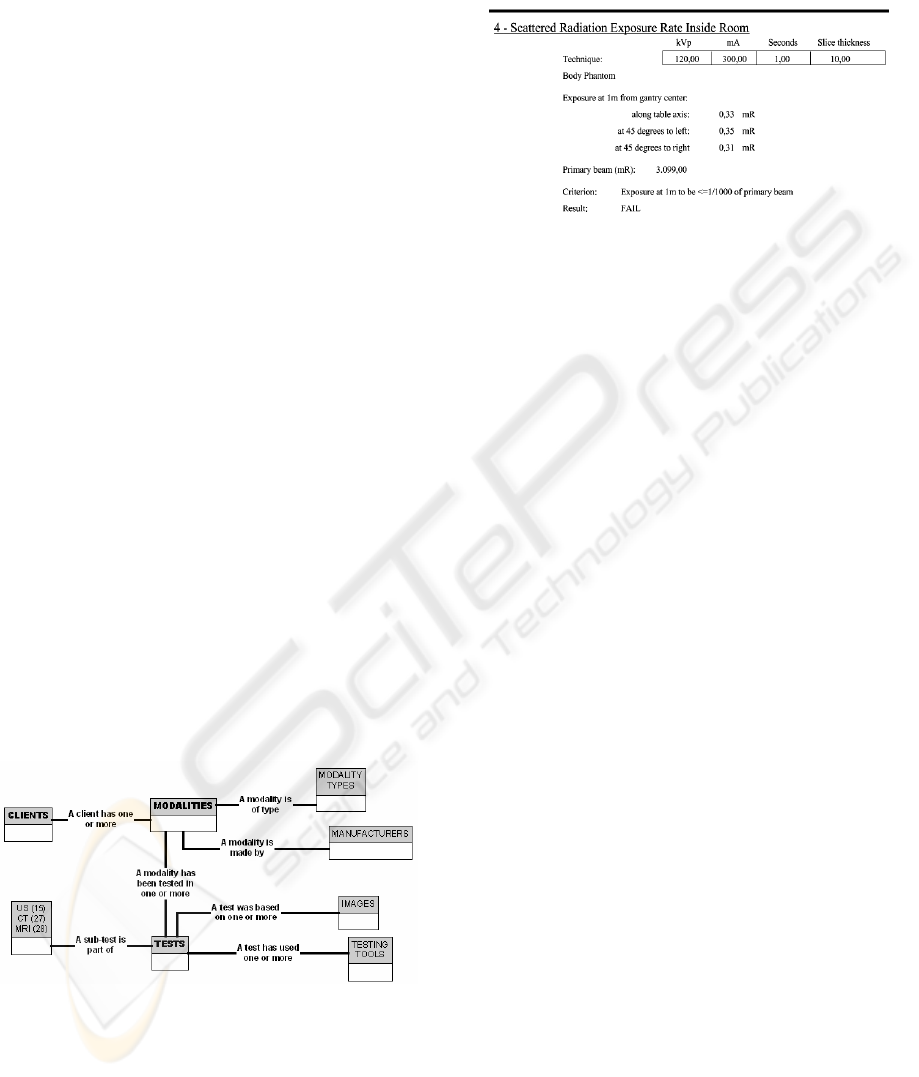
c. Report generation capabilities: The interface can
generate reports that will output the information in
the database. There are standard printout reports, for
clients, modalities etc., and there are test and sub-
test reports that can be customised to include certain
parts of a test. An example of a typical excerpt from
a report is shown in Figure 3.
Figure 3: Excerpt from a QA CT report.
d. Database maintenance and interface
customisation: The database’s interface is an integral
part of the developed software. All details of most
primary and all secondary tables and entities can be
edited and manipulated by the users if the system.
e. Dynamic features of the interface. The database-
interface setup is dynamic. The database or the
server can be changed from within the interface with
no service disruption. The location of the imaging
engine software and the location of the report files
are also set dynamically.
2.2 Image Processing Unit
We have developed a dedicated image-processing
tool that provides the required functionality for a QA
program in diagnostic radiology. In summary, the
developed image-processing tool includes the
following (region specific or image specific)
features:
• Loads and saves images of any format including
the DICOM format.
• Allows image data visualisation in different ways
(i.e Histogram Viewer, Profile Viewer, 3D viewer,
contour plots viewer) and provides tools for
windowing and levelling options.
• Includes basic algorithms for image operations,
such as thresholding, linear and non-linear
filtering, morphological operations, Fourier
transformations, histogram equalization and
others.
• Includes basic image segmentation techniques
such as border extraction methods.
• Allows the user to define regions of interest in an
image of any shape or size.
ICEIS 2006 - ARTIFICIAL INTELLIGENCE AND DECISION SUPPORT SYSTEMS
218
• Performs customised measurements on images, in
order to support the determination of the quality of
MRI, CT and US images.
• Allows data transfer to and from the DMU, so that
the results of the measurements are stored in the
database.
The quality of images can be assessed based on
dedicated measurements/tests carried out on images
of specially designed phantoms. In total, 26 different
image tests are supported by the IPU, 13 of which
refer to MRI images, eight refer to CT images and
the remaining five refer to US images. In all cases
the test results are transferred to the DMU, so that
appropriate calculations are performed in order to
assess compliance with preset standards.
In the following sections we describe typical
techniques used as the basis for implementing
complete test measurement procedures for each of
the 26 tests.
2.2.1 Texture Measurements
In several occasions we wish to obtain
measurements that relate to the mean signal
intensity, the standard deviation and the signal-to-
noise ratio (SNR) in a region of interest (ROI). For
this purpose, we have implemented algorithms for
obtaining first order texture measurements in an
image region. Texture measurements are carried out
in a semi-automatic way, since the user is required
to specify and/or modify the ROI. Texture
measurements are usually used for assessing the
homogeneity of image regions, calculating
differences in signal strength in image areas
corresponding to different materials in phantoms and
assessing the contrast between bright and dark tissue
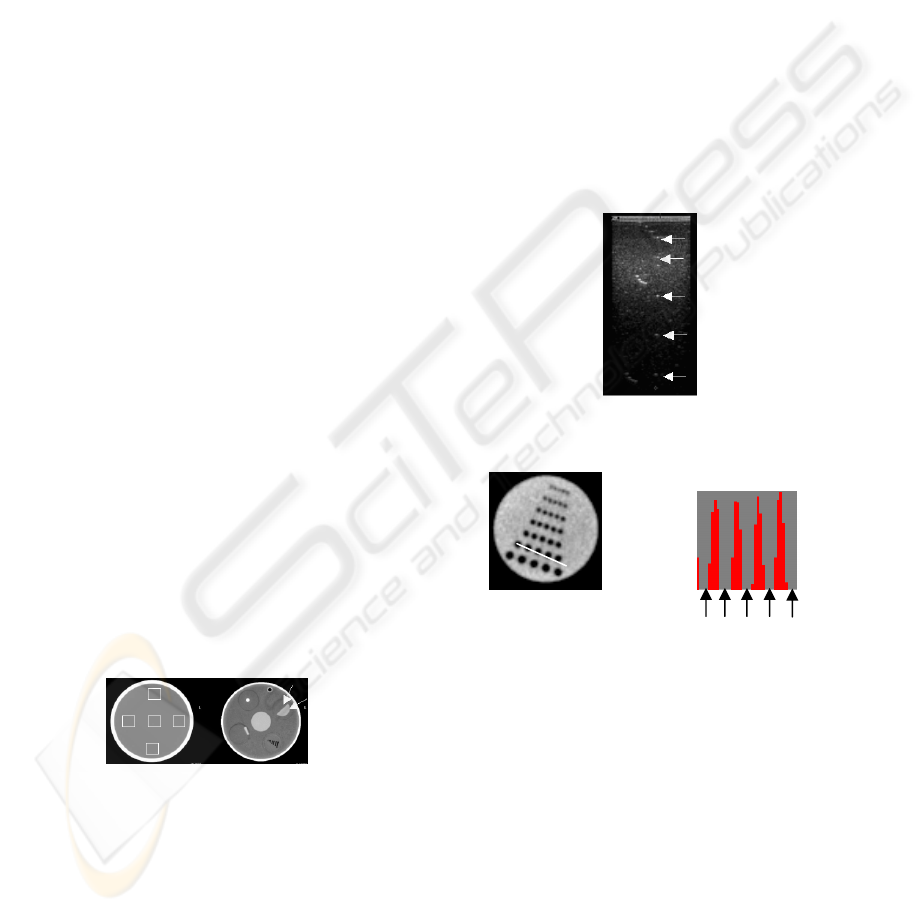
regions. Figure 4 shows typical image examples
where texture measurements are performed.
Figure 4: Typical Regions-of-Interest (ROI’s) on CT
images where texture measurements are performed.
(ROI’s are indicated by the squares and arrows overlaid on
the images).
2.2.2 Locating Points of Reference
On various occasions, phantoms contain objects
used as reference points for a number of
measurements. Examples of such reference points
are shown in Figure 5. To automate the process of
analysing test images, the user must be able to locate
reference points in images. To achieve this in the
developed system we employed either a
convolution-based approach or a profile-based
approach.
The convolution-based approach is used in noisy
datasets (a preferred approach for US images).
Based on this approach profiles are extracted in the
ROI that contains the points of reference; the
extracted profiles are then convolved with a one-
dimensional Gaussian function. The resulting vector
indicates the positions of the points of reference.
Figure 5 shows an example of reflectors in a US
image, which are automatically located using the
convolution-based approach.
The profile-based approach is used in low noise
images. Using this approach the locations of the
reference points are determined by detecting the
minima loci in the profile data (Figure 6).
Figure 5: A typical ultrasound (US) phantom image with
point-reflector sources, indicated by the arrows.
Figure 6: Locating reference points on a CT image of a
resolution phantom, using the profile-based method. (a)
Axial image of a resolution CT phantom (b) One-
dimensional profile from the second row of air holes
drilled in an epoxy resin-based insert of the CT phantom;
the arrows point to locations of minima.
2.2.3 High Contrast Spatial Resolution
High contrast spatial resolution is the ability of an
image device, to produce images where adjacent
high contrast objects are distinguishable. In order to
assess the ability of imaging equipment to produce
acceptable high contrast spatial resolution, a series
of high contrast circular objects of varying size and
separation is studied. The aim in such cases is to
define whether the circular objects are
distinguishable at a particular size and separation
(a)
(b)
A SEMI-AUTOMATED QUALITY ASSURANCE TOOLBOX FOR DIAGNOSTIC RADIOLOGICAL IMAGING
219
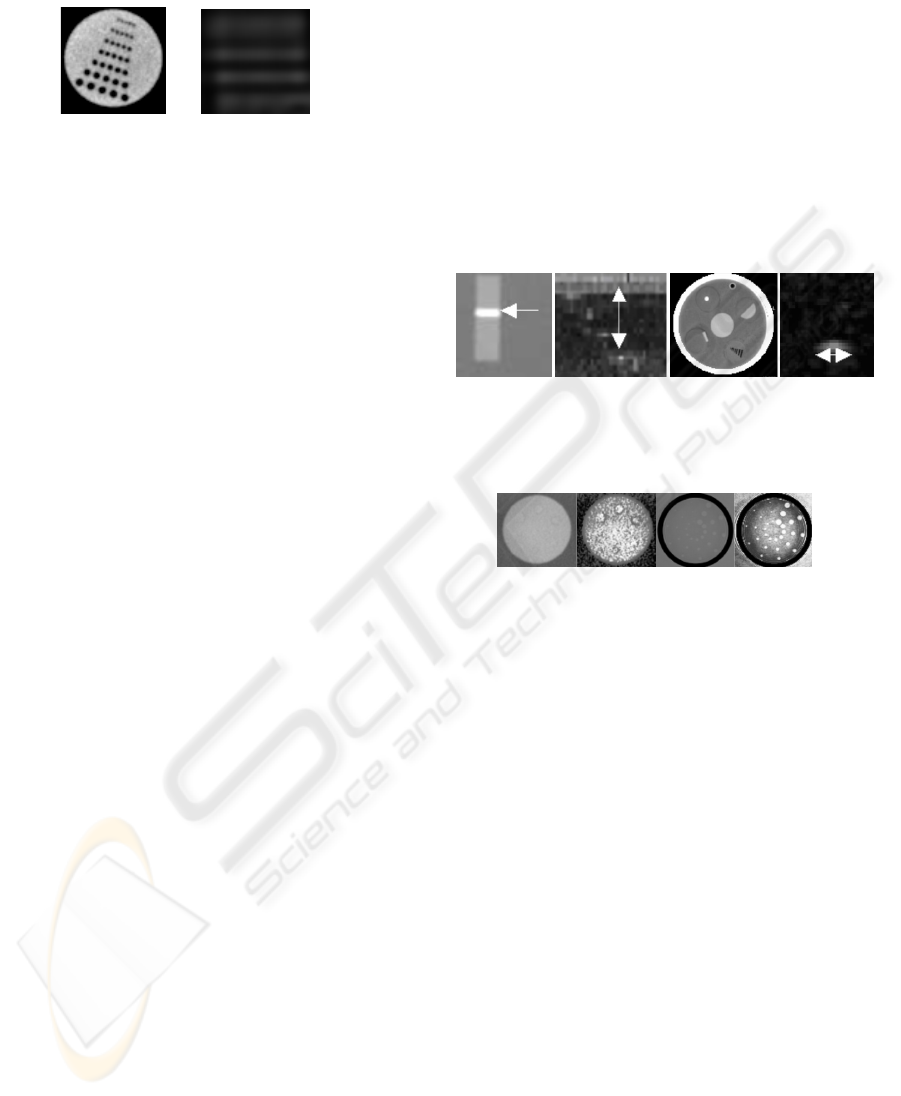
level. Examples of high contrast circular objects
considered for this test are shown in figure 7.
Figure 7: Details of a CT (left) and zoomed MRI image
(right) showing the spots used for computing the high
contrast spatial resolution. In the case of the MRI image
the spots are not distinguishable.
Techniques developed for detecting points of
reference in images (see section 2.2.2) were
employed in this case, to count the number of
objects detected in each region of interest.
2.2.4 Distance Measurements
In several occasions it is necessary to measure
distances between structures and/or the dimensions
of image objects. To perform distance
measurements, the user defines the ROI containing
the structure of interest and the required
measurements are performed automatically. Typical
cases where distance measurements involved
include:
• Measuring the width of image structures. The user
draws a profile across the image structure and
based on the extracted profile data, the width of
the structure is calculated (Figure 8a).
• Measuring the distance between reflectors.
Reflectors in an image region are automatically
located (see figure 5 and figure 8b) and the
distances between them are calculated.
• The calculation of the distances and dimensions of
circular structures (see figure 8c). In this case we
extract the boundaries of a circle and then
establish the attributes of the circle (i.e height,
width, center).
• Measuring the width of reflectors in noisy images
(see figure 8d). The reflector is first located and
then a profile is extracted across the center of the
reflector. Gaussian functions of different standard
deviations are convolved with the extracted profile
– the standard deviation value that produces the
best fit is used for estimating the width of the
reflector.
2.2.5 Low Contrast Detectability
In order to assess the ability of diagnostic equipment
to produce images where low contrast objects are
visible, procedures have been developed to detect
the presence of low contrast image objects in image
regions. For this purpose, an automated and a
manual method were implemented. In the automated
method a convolution-based approach is used for
detecting the presence of low-contract objects. In
several occasions, however, low contrast image
objects are dominated by noise, causing failures to
the automatic object detection algorithms. As an
alternative, a manual method was implemented for
low contrast object detection; in that case, the
system performs histogram equalization in the
region of interest and the user indicates the presence
of low contrast objects in the enhanced image
regions (Figure 9).
(a) (b) (c) (d)
Figure 8: Typical examples of distance measurements in
CT (a and c) and US (b and d) images.
Figure 9: Examples of image regions containing low
contrast objects (a and c) and the corresponding
histogram-equalized image regions (b and d).
3 SYSTEM IMPLEMENTATION
The database back-end has been implemented using
the Microsoft Database Engine, Desktop Edition of
SQL Server 200 including Service Pack 3. The
database front-end has been implemented using
Microsoft Visual Basic .NET 2003 on the .NET
Framework v1.1. The front-end is a stand-alone
application utilising the Windows Application
Programming Interface (API) and connecting to the
locally installed and running SQL server. The
database has been created and maintained by using
the ‘server explorer’ interface of the Microsoft
Development Environment. Reports generated
utilise Crystal Reports capabilities provided by the
Microsoft Development Environment.
The image processing tool has been implemented
using the Microsoft Visual C# .NET 2003 on the
.NET Framework v1.1. Dedicated image processing
routines have been implemented using the
MATLAB R13 programming environment and the
(
a
)
(
b
)
(
c
)
(
d
)
ICEIS 2006 - ARTIFICIAL INTELLIGENCE AND DECISION SUPPORT SYSTEMS
220

MATLAB Image Processing Tool Box. We have
exploited the MATLAB Com Builder to convert
MATLAB applications (routines and functions) to
Component Object Model (COM) objects. These
objects can be immediately integrated with any
COM-based application, such as Visual C#
applications.
4 CONCLUSIONS
We have presented a custom-made system for
managing quality control measurements and quality
assurance program for diagnostic radiological
imaging equipment. The proposed system uses an
Image Processing Unit for image analysis, and a
Database Management Unit to deposit all the data
that relates to the Quality assurance process. Reports
describing the performance of specific imaging units
are generated based on the Data Management Unit.
The main value of this paper is the design of a
system that supports the automation of the
application of systematic quality assurance programs
for diagnostic radiological imaging equipment in
compliance with International Regulatory
Committees and standards. Our study presents
original work in the particular application domain
since:
• There is support for the three main imaging
modalities (MRI, CT, US)
• Measurements on images are carried out using
dedicated image analysis algorithms rather than
relying on manual measurements
• Measurements derived from images and user
defined analyses are stored in a database so that
quality assurance reports are automatically
generated.
An important issue in the development of quality
assurance programs is the reliability in reported
measurements. In the case of the IPU, additional
user visual checks served as an independent method
of correctness of the software measurements.
Additionally, for measurements that may fail in the
case of using low image quality datasets, we have
incorporated secondary methods that depend on
human intervention.
The end result of this work is being used for re-
enforcing the efforts of staging proper and effective
Quality Assurance programs for medical imaging
equipment, both at national and international level.
The system has been tested extensively on real
images produced by MRI, CT and US scanners and
the system performance has proved to be
satisfactory. Since the system developed is unique it
is not possible to compare it directly with other
systems in this category. Initial feedback received by
potential users of the system, proves the value of our
approach for dealing effectively with QA control of
medical images in real applications.
ACKNOWLEDGEMENTS
The work presented was supported by the Cyprus
Research Promotion Foundation (project NEPRO-
0204).
REFERENCES
Bourel P, Gibon D, Coste E, Daanen V, Rousseau J. 1999.
Automatic quality assessment protocol for MRI
Equipment. Med. Phys. 26(12):2693-700.
Lerski RA, de Certaines JD. 1993. Performance
assessment and quality control in MRI by Eurospin
test objects and protocols. Magn. Reson. Imaging
11(6):817-33
McRobbie DW, Quest RA. 2002. Effectiveness and
relevance of MR acceptance testing: results of an 8-
year audit. Br. J. Radiology 75(894):523-31.
Och JG, Clarke GD, Sobol WT, et. Al , 1992 Acceptance
testing of Magnetic Resonance Imaging systems:
report of AAPM Nuclear Magnetic Resonance Task
Group No. 6. Med. Phys. 18:217-229.
Price RR, Axel L, Morgan T, et. al. 1990. Quality
assurance methods and phantoms for magnetic
resonance imaging:report of the AAPM Nuclear
Magnetic ResonanceTask Group No. 1. Med. Phys. 17
(Mar/Apr):2.
Radiology Centennial Inc., 1996, “A HISTORY OF THE
RADIOLOGICAL SCIENCES 1996 3 Volumes,
(American College of Radiology group)
A SEMI-AUTOMATED QUALITY ASSURANCE TOOLBOX FOR DIAGNOSTIC RADIOLOGICAL IMAGING
221
