
USING ATTACK GRAPHS IN AD HOC NETWORKS
For Intrusion Prediction Correlation and Detection
Marianne Azer
National Telecommunication Institute, Cairo, Egypt
Sherif El-Kassas
Department of computer science, American University in Cairo, Cairo, Egypt
Magdy El-Soudani
Department of Electronics and Communications,Faculty of Engineerin, Cairo University, Cairo, Egypt
Keywords: Anomaly detection, attack graphs, intrusion detection, security in ad hoc networks.
Abstract: Ad hoc networks have lots of applications; however, a vital problem concerning their security aspects must be
solved in order to realize these applications. Hence, there is a strong need for intrusion detection as a frontline
security research area for ad hoc networks security. Among intrusion detection techniques, anomaly detection
is advantageous since it does not need to store and regularly update profiles of known attacks. In addition the
intrusion detection is not limited to the stored attack profiles, which allows the detection of new attacks.
Therefore, anomaly detection is more suitable for the dynamic and limited resources nature of ad hoc
networks. For appropriately constructed network models, attack graphs have shown their utility in organizing
combinations of network attacks. In this paper, we suggest the use of attack graphs in ad hoc networks. As an
example, we give an attack graph that we have created for the wormhole attack. For anomaly prediction,
correlation, and detection in ad hoc networks, we suggest the use of two methods that rely basically on attack
graphs. The first method is based on the attack graph adjacency matrix and helps in the prediction of a single
or multiple step attack and in the categorization of intrusion alarms’ relevance. The second method uses the
attack graph distances for correlating intrusion events and building attack scenarios. Our approach is more
appropriate to ad hoc networks’ collaborative and dynamic nature, especially at the application level.
1 INTRODUCTION
Mobile ad hoc networks security has recently been
the topic of extensive research. Intrusion detection is
considered as a frontline security research area under
the umbrella of ad hoc networks security. Intrusion
detection techniques can be classified into misuse
detection and anomaly detection. In this paper we
focus on the anomaly detection. Among the anomaly
detection techniques are the ones suggested in
(Zhang,
Lee, and Huang, 2003
) and (Yi et al., 2005).
Attack graphs have shown their utility in organizing
combinations of network attacks. We suggest the use
of attack graphs in ad hoc networks and give as an
example an attack graph that we created for the
wormhole attack. For intrusion correlation,
prediction and detection in ad hoc networks, we
present two methods that rely basically on attack
graphs. The first is based on the attack graph
adjacency matrix and helps in the prediction of a
single or multiple step attack and in the
categorization of intrusion alarms' relevance. The
second method uses the attack graph distances for
correlating intrusion events and building attack
scenarios.
The remainder of this paper is organized as
follows. In section 2, we give a brief introduction to
the concept of attack graphs and adjacency matrices;
the attack graph of the wormhole attack is given as an
example. Section 3 discusses the possible use of
attack graph adjacency matrices and attack graph
distances for intrusions prediction and correlation.
Finally, in section 4 we conclude this paper and
discuss some future work.
63
Azer M., El-Kassas S. and El-Soudani M. (2006).
USING ATTACK GRAPHS IN AD HOC NETWORKS - For Intrusion Prediction Correlation and Detection.
In Proceedings of the International Conference on Security and Cryptography, pages 63-68
DOI: 10.5220/0002097700630068
Copyright
c
SciTePress

2 ATTACK MODELS
In this section we give some background about the
attack graphs, adjacency matrices, and risk
management. Section 2.1 introduces the concept of
attack graphs and adjacency matrices; section 2.2
explains the risk management for ad hoc networks
using the vulnerability attack graph.
2.1 Attack Graphs and Adjacency
Matrices
Network attack graphs represent a collection of
possible penetration scenarios in a computer network.
The graph can focus on the extent to which an
adversary can penetrate a network to achieve a
particular goal, given an initial set of capabilities.
They represent not only specific attacks but
categories of attacks. They can detect previously
unseen attacks which have common features with
attacks in graphs.
Graphs can also be represented in the form of
adjacency matrices or adjacency lists. We will focus
on adjacency matrices. The relationship between a
graph and its adjacency matrix is studied in spectral
graph theory.
If A is the adjacency matrix of the directed or
undirected graph G, then the matrix A
n
, i.e. the matrix
product of n copies of A, has an interesting
interpretation: the entry in row i and column j gives
the number of directed or undirected paths of length n
from vertex i to vertex j. In general, to generate the
matrix of path of length n, take the matrix of path of
length n-1, and multiply it with the matrix of path of
length 1 (Cormen et al., 2001).
2.2 Risk Management
A five step procedure was given in (Dantu,, Loper
and Kolan, 2004) to calculate vulnerabilities and
risks of a critical network resource. The same
procedure could be customized and applied for ad
hoc networks. The risk management method for ad
hoc networks, using attack graphs is illustrated in
Figure 1 and has the following steps:
Step 1->Creation of an attacker Profile: The
profile gives the expendable resources associated
with the attacker. Creating an attack profile would
help in identifying the probable attacks and the
probable network resources that can be compromised
by the attacker. An attacker may be classified
depending on: his effects to active and passive, his
source to external and internal, depending on his
capabilities to mote and laptop-class and finally
based on the target operation of the attack to routing
and packet forwarding attacker.
Step 2->Creation of Attack Graph: Attack graphs
depict ways in which an adversary exploits system
vulnerabilities to achieve a desired state. System
administrators use attack graphs to determine how
vulnerable their systems are and to determine what
security measures need to be deployed in order to
defend their systems. Using this graph, we can learn
how intruders culminate sequence of state transitions
for achieving an attack. To build an attack graph, the
ad hoc network should be modeled as a finite state
machine, where state transitions correspond to atomic
attacks launched by the intruder. Also a desired
security property could be specified and the
intruder’s goal generally corresponds to violating this
property more details for building and analyzing
attack graphs could be found in (Sheyner, and Wing,
2003), (Sheyner et al., 2003), and (Swiler, Phillips
and Gaylor, 1998). Attack graphs construction
depends on the knowledge of different types of
attacks to which the network is vulnerable. In ad hoc
networks, there are two main types of passive attacks;
the eavesdropping and the traffic analysis attack.
Active attacks can be subdivided into the following
categories: impersonation, masquerade, replay,
modification of messages, and denial of service.
Step 3-> Labeling Attack Paths with Behavior
Attributes: Based on the type of the attacker, the
attack paths are considerably different depending on
the type of quantifying variable in consideration. This
helps us in deducing all the vulnerable resources in a
network for a given attack profile.
Step 4->Risk Computation: In this step, a risk
level for all the critical resources is calculated based
on the set of paths, attributes and attacker type.
Bayesian networks-based estimation is used for
calculating the aggregated risk value of the resource.
Next, a resource is marked as attack prone if this
value is more than a threshold. Bayesian networks
encode the probability relationships between various
random variables or nodes in a causal graph and
therefore we can model the attack trees by reducing
them to causal graphs and associating the nodes or
random variables with probabilities. Therefore, we
document all the attack paths for a given resource and
calculate the Bayesian probabilities of the root nodes
of each attack path when the evidence regarding the
leaf is available.
Step 5->Optimizing the risk level: In a typical
network, patching vulnerability may impact other
network elements. Steps 1-4 need to be performed
SECRYPT 2006 - INTERNATIONAL CONFERENCE ON SECURITY AND CRYPTOGRAPHY
64
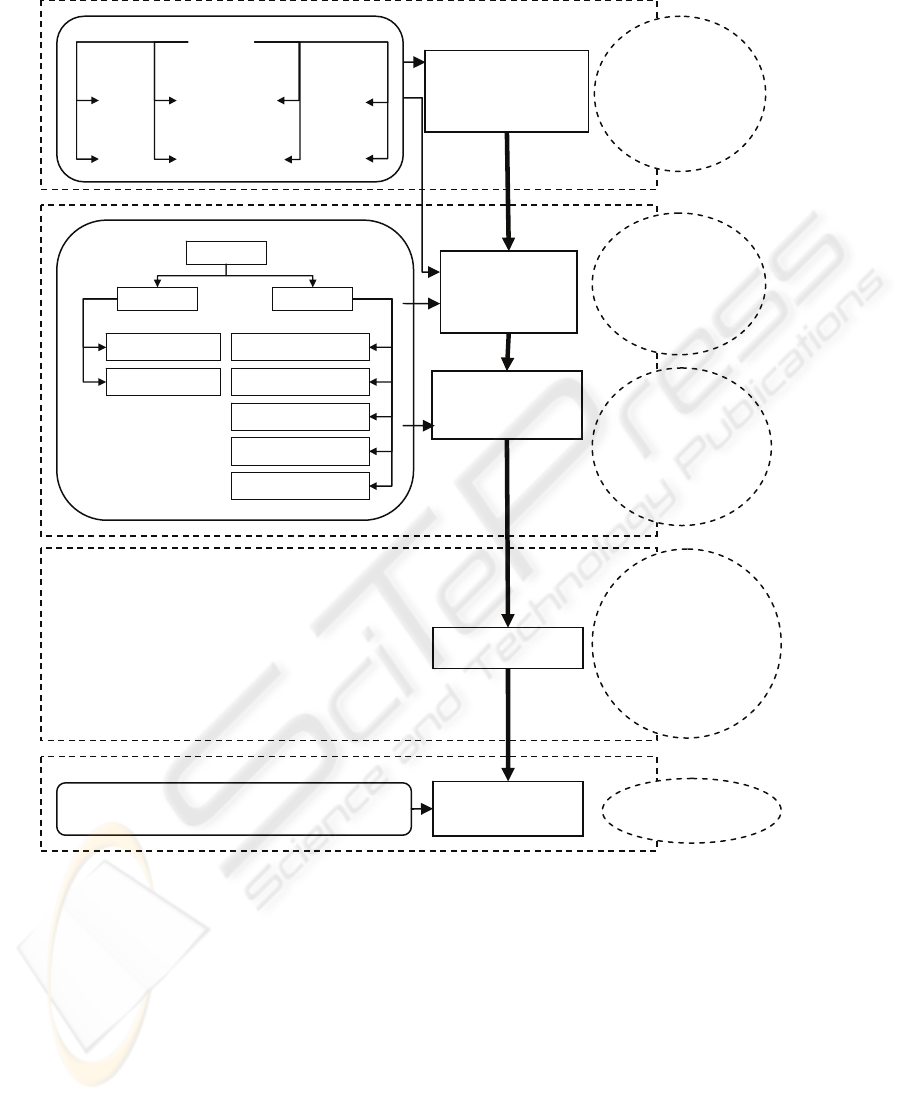
Figure 1: Risk management for ad hoc networks using behavior based attack graphs.
repeatedly for an optimum risk value.
3 ATTACK MODELS
There are lots of anomaly detection approaches for ad
hoc networks, such as using classifiers, finite state
machines and game approach. Those techniques are
more suitable for well understood protocols such as
routing protocols. However, since self contained
protocols are very limited in ad hoc networks, these
approaches might not be appropriate in some cases.
For example, it is very difficult to model attacks on
ad hoc networks collaborative applications as one
state machine or to use a classifier or the game
approach. In addition, the use of attack graphs in
intrusion detection will not add an additional burden
since it must be constructed, anyway, for risk
assessment.
A particularly severe security attack, called the
wormhole attack has recently been introduced in the
context of ad hoc networks (Karlof and Wagner,
2003), (Hu, Perrig, and Johnson, 2003), (Hu, and
Evans, 2004). During the attack (Khalil, Bagchi, and
Shroff, 2005), a malicious node captures packets
from one location in the network, and “tunnels” them
Create attack
graph
Input
Risk management step
Attackers
Active
Passive
External
Internal
Mote
Laptop
Packet
Routing
Create an attacker
profile and see attacker
resources
Attacks
Active Passive
Eavesdropping
Traffic Analysis
Impersonation
Masquerade
Replay
Modification
Denial of service
Label attack paths
with behavior
attributes
Risk Computation
Patching vulnerabilities and repeating previous steps
Optimizing risk level
Identify probable
attacks and
network
resources that
can be
com
p
romised
Learn sequence
of state
transitions for
achieving an
attac
k
Deduce all
vulnerable
resources in the
network for a
given attack
p
rofile
Risk level for
critical resources is
computed.
If risk level
>threshold,
resource is attack
prone
Optimum risk
value
Benefit form risk
management
USING ATTACK GRAPHS IN AD HOC NETWORKS - For Intrusion Prediction Correlation and Detection
65
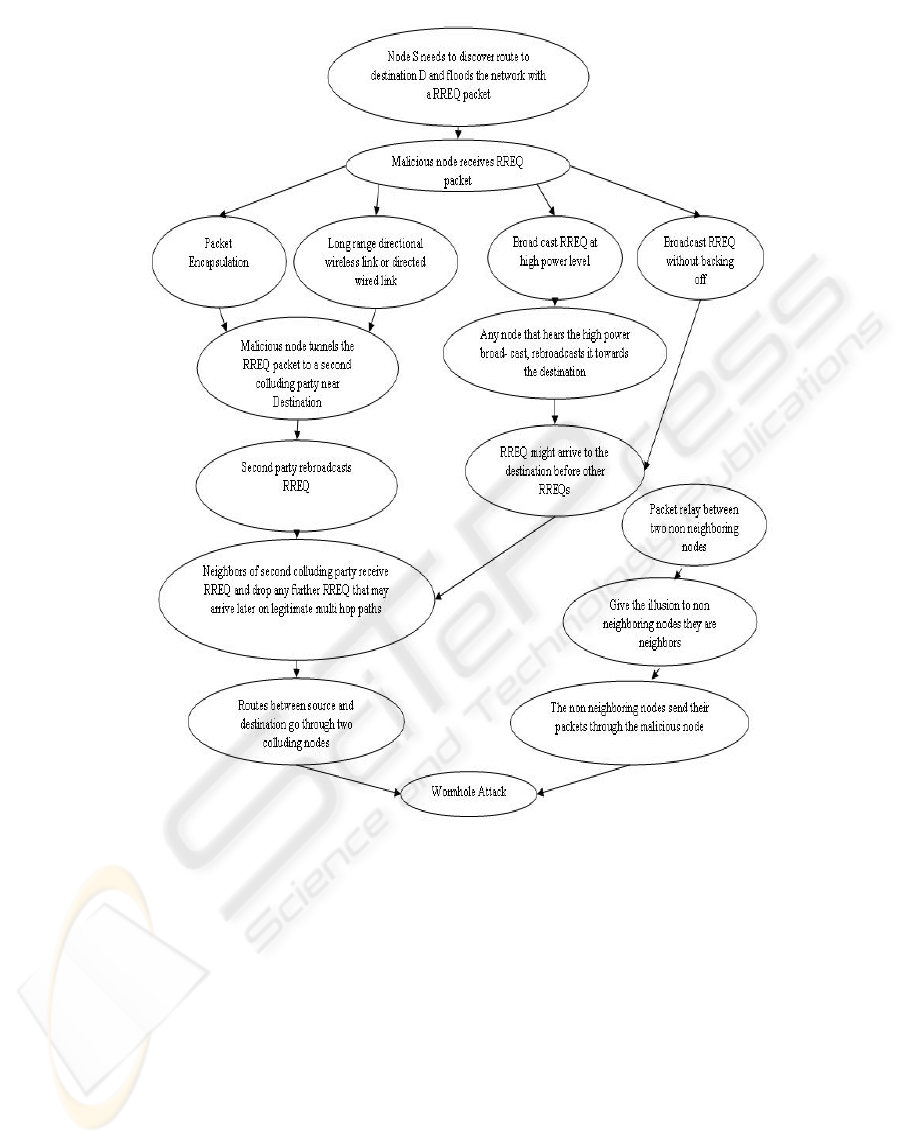
Figure 2: The Wormhole attack graph.
to another malicious node at a distant point, which
replays them locally. Figure 2 depicts the attack
graph that we have created for the wormhole attack
using the attack modes described in (Khalil, Bagchi,
and Shroff, 2005).
In section 3.1 the use of the attack graph adjacency
matrix for intrusion prediction and intrusion alarms
categorization is suggested, whereas section 3.2 is
concerned with the correlation of intrusion events and
building attack scenarios through attack graph
distances.
3.1 Use of the Adjacency Matrix
For n vertices in the attack graph, the adjacency
matrix A is an n ×n matrix where element a
ij
of A
indicates the presence of an edge from vertex i to
vertex j. A particular matrix clustering algorithm
(Chakrabarti et al., 2004) is designed to form
homogeneous rectangular blocks of matrix elements
such that the clusters form regions of high and low
densities. As it was suggested in (Noel and Jajodia,
2005), the adjacency matrix, if taken directly, shows
every possible single-step attack. Also if A
p
is
calculated, using the transitive closure of A, it tells
whether there is at least one p- step attack from one
vertex to another. A multi-step reachability matrix
can be computed form the adjacency matrix and it
helps to identify the minimum number of steps
required to reach each pair of attack vertices. A
method for attack prediction and alarm categorization
SECRYPT 2006 - INTERNATIONAL CONFERENCE ON SECURITY AND CRYPTOGRAPHY
66

using the adjacency matrix A, the computed transitive
closure, and the multi-step reachability matrix after
having applied the clustering algorithm is explained
in (Noel and Jajodia, 2005). When an intrusion alarm
is generated, it can be associated with the adjacency
matrix for single step reachability, with the multi-step
reachability matrix for multi-step reachability, or
with the transitive closure of A for all step
reachability. From this, the intrusion alerts can be
categorized based on the number of associated attack
steps. If an attack occurs within a zero-valued region
of the transitive closure, it might be concluded as a
false alarm, or if an alarm occurs within a single step
region of the reachability matrix, it is indeed one of
the single-step attacks in the attack graph.
Somewhere in between, if an alarm occurs in a p-step
region, the attack graph predicts it takes a minimum
of p-steps to achieve such an attack. By associating
intrusion alarms with a reachability graph, the origin
and impact of the attack can also be predicted. This
general approach, in (Noel and Jajodia, 2005) for
different network security situations can be applied to
our wormhole attack graph and generalized to ad hoc
networks after creating network attack graphs for the
different attacks, knowing the special vulnerabilities
of this type of networks.
3.2 Use of Attack Graph’s Distances
In (Noel, Robertson, and Jajodia, 2004) an idea for
correlating intrusion events and building attack
scenarios through attack graph distances was
suggested. This idea could be applied as well in our
case for the wormhole attack detection and in general
for any ad hoc network’s attack graph. To determine
the degree of correlation, the graph distance between
corresponding exploits is measured. Two events that
fall on a connected path in an attack graph are
considered correlated, at least to some extent. The
graph distance between a pair of exploits is the
minimum length of paths connecting them, as the
shortest path is the best assumption for event
correlation and the most efficient to compute. The
graph distances are unweighted, i.e. no weights are
applied to graph edges between exploits. Once the
exploit distances are computed for an attack graph,
they are applied continuously for real time stream of
intrusion events. The inverse of the events distance is
computed and applied to an exponentially weighted
moving average filter, used to provide resiliency
against detection errors, to obtain the filtered version
of the original sequence of event distances. These
filtered inverse events distances constitute the basic
measure of event correlation in that model; a proper
threshold is applied to the filtered distances to
separate event paths into highly correlated attack
scenarios. An overall relevancy score is also
computed for each attack scenario as a function of the
number of events in the scenario. This relevance
score is the proportion of the attack paths actually
occupied by an attacker scenario’s intrusion events.
This same idea could be applied for ad hoc networks
intrusion correlation after having assessed all the
vulnerabilities and created the network attack graph.
In our approach, we will assume that there are
central distributed authorities responsible of building
the attack graphs, calculating their corresponding
adjacency matrix, and computing the attack graph
distances. They should also be responsible of
distributing this data to the nodes and informing the
nodes of the current status whenever there is an attack
so that nodes could locate the most recent event on
their attack graphs. This is not our ultimate goal, but
we shall start our work based on this assumption and
then enhance our approach. Figure 3 summarizes the
suggested anomaly detection technique for ad hoc
networks using attack graphs.
4 CONCLUSIONS AND FUTURE
WORK
In this paper we focused on the anomaly detection
approach for intrusion detection in ad hoc networks.
Some anomaly detection methods such as classifiers,
state machines, and game approach are suitable for
well understood protocols such as routing protocols.
However, since self contained protocols are limited
in ad hoc networks, these approaches might not be
appropriate in some cases. Also, since the risk
assessment methodology described in this paper uses
attack graphs anyway, we suggested the use of attack
graphs for ad hoc networks. As an example for attack
graphs, we created an attack graph for the wormhole
attack. Based on this attack graph we discussed two
methods for anomaly detection that rely basically on
the constructed attack graph for intrusion detection.
The first was based on the attack graph adjacency
matrix and helped in the prediction of a single or
multiple step attack and in the categorization of
intrusion alarms’ relevance. The second method used
the attack graph distances for correlating intrusion
events and building attack scenarios. Therefore, our
approach is more appropriate to ad hoc networks’
collaborative and dynamic nature, especially at the
application level. In the future we intend to build a
full ad hoc network environment and use the
suggested anomaly detection approach to evaluate it
USING ATTACK GRAPHS IN AD HOC NETWORKS - For Intrusion Prediction Correlation and Detection
67
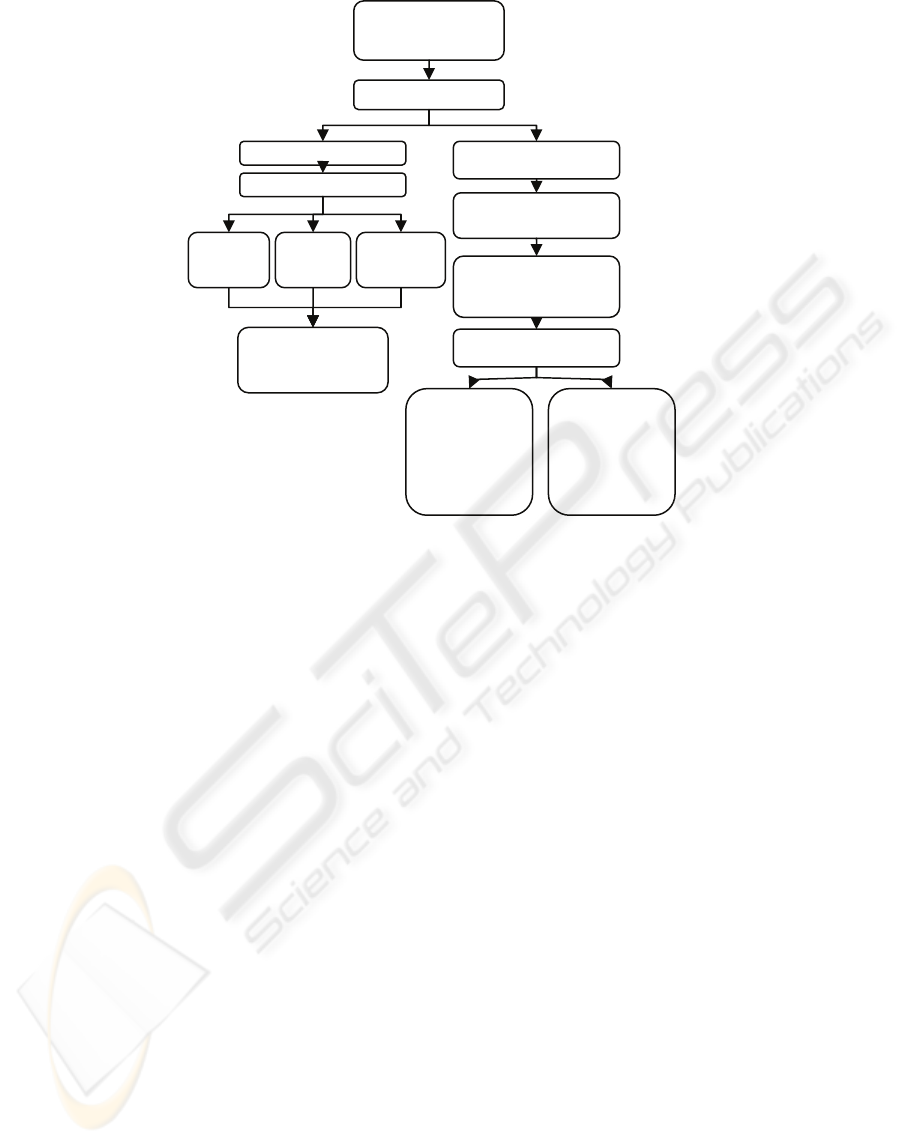
Figure 3: Suggested anomaly detection.
and compare it with other anomaly detection
techniques.
REFERENCES
Zhang, Y., Lee, W., and Huang, Y. 2003. Intrusion
Detection Techniques for Mobile Wireless Networks,
ACM WINET.
Yi, P., et al.2005. Distributed Intrusion Detection for
Mobile Ad hoc Networks, Proceedings of the 2005
Symposium on Applications and the Internet
Workshops (SAINT-W’05), 94-97.
Cormen, T., et al. 2001. Introduction to Algorithms,
Second Edition. MIT Press and McGraw-Hill, Section
22.1: Representations of graphs, 527–531.
Dantu, R., Loper, K., Kolan, P., 2004. Risk Management
using Behavior based Attack Graphs, International
Conference on Information Technology: Coding and
Computing (ITCC'04) Volume 1.
Sheyner, O., and Wing, J.,2003. Tools for Generating and
Analyzing Attack Graphs, FMCO 2003, 344-372.
Sheyner, O., Haines, J., Jha, S., Lippmann, R., and Wing, J.,
2002, Automated Generation and Analysis of Attack
Graphs, IEEE Symposium on Security and Privacy
2002, 273-284.
Swiler, L., Phillips, C., and Gaylor, T., 1998. A
Graph-Based Network-Vulnerability Analysis System,
tech. report, Sandia National Labs.
. Karlof, C., and Wagner, D., 2003. Secure Routing in
Sensor Networks: Attacks and Countermeasures, at the
1st IEEE International Workshop on Sensor Network
Protocols and Applications.
Hu, Y., Perrig, A., and Johnson, D., 2003. Packet leashes: a
defense against wormhole attacks in wireless networks,
in Proceedings of the 22nd Annual Joint Conference of
the IEEE Computer and Communications Societies
(INFOCOM), 1976-1986.
Hu, L., and Evans, D., 2004. Using Directional Antennas to
Prevent Wormhole attacks, in Network and Distributed
Systems Security Symposium.
Khalil, I., Bagchi, S., and Shroff, N., 2005. LITEWORP: A
Lightweight Countermeasure for the Wormhole Attack
in Multihop Wireless Networks, DSN 2005, 612-621.
Chakrabarti, et al., 2004. Fully Automatic
Cross-Associations, in Proceedings of the 10th ACM
International Conference on Knowledge Discovery &
Data Mining, Seattle, Washington, August 2004.
Noel, S., Jajodia, S., 2005. Understanding Complex
Network Attack Graphs through Clustered Adjacency
Matrices, acsac, 21st Annual Computer Security
Applications Conference (ACSAC'05), 160-169.
Noel, S., Robertson, E., and Jajodia, S., 2004. Correlating
Intrusion Events and Building Attack Scenarios
through Attack Graph Distances," acsac, 20th Annual
Computer Security Applications Conference
(ACSAC'04), 350-359.
Assess ad hoc network
vulnerabilities and
possible attacks
Construct attack graph
Com
p
ute ad
j
acenc
y
matrix
A
pp
l
y
matrix clusterin
g
Single step
reachability
matrix
Transitive
Closure
p-step
reachability
matrix
Intrusion alarm
categorization and
intrusion prediction
Calculate unweighted graph
distances
Calculate the inverse of
events distances
Apply the sequence to an
exponentially weighted
moving average filter
Obtain filtered inverse
eve
nt
s
d
i
s
t
a
n
ces
Apply filtered
distances to a
threshold to
separate event
paths to highly
correlated attack
scenarios
Calculate
relevancy score for
each attack
scenario
SECRYPT 2006 - INTERNATIONAL CONFERENCE ON SECURITY AND CRYPTOGRAPHY
68
