
USE OF AGPS CALL DATA RECORDS FOR NON-GPS TERMINAL
POSITIONING IN CELLULAR NETWORKS
Semun Lee, Jeongkeun Lee, Taekyoung Kwon and Yanghee Choi
School of Computer Science & Engineering, Seoul National University
San 56-1 Shilim-dong, Kwanak-gu, Seoul, South Korea
Tae Joon Ha and Tae-il Kim
Radiant Technologies, Inc.
Il-yang Bldg 206, Nonhyeon 1-dong. Gangnam-gu, Seoul, South Korea
Keywords:
Positioning, Pattern Matching, AGPS CDRs, cellular network.
Abstract:
This paper presents a novel method of user terminal positioning in cellular networks. A pattern matching
technology based on received-signal-strength (RSS) from the pilot channels of cell towers has been the most
popular network-based positioning method. In response to a position request, a terminal measures RSSs of
pilot channels from surrounding cell towers and then the terminal’s RSS pattern is compared with a pattern
database to find the most correlated one which indicates the position of the terminal. Although the pattern
matching method can provide accurate positioning, its database construction and maintenance require a high
overhead of periodic labor-intensive pattern collection. In this paper, we propose to exploit the call data records
(CDRs) that are uploaded by Assisted Global Positioning System (AGPS) terminals as inputs to the pattern
database, which removes or reduces the pattern collection overhead. In AGPS systems, terminals measure
satellite signals and cellular network parameters (such as RSS) and relay them to the cellular infrastructure,
which in turn calculates the terminal position using both that satellite and cellular network data. The proposed
AGPS CDR based pattern matching method takes advantage of the increasing number of AGPS terminals in
service: non-AGPS terminals can obtain more precise positioning results in areas where more AGPS calls are
generated (e.g. hotspots). To do so, we analyze the characteristics of RSS patterns and AGPS CDRs. Based
on the analysis, a pattern-distance metric and an AGPS CDR based pattern matching system are proposed and
their performances are evaluated by examining field data of several urban downtown areas of Seoul, Korea. We
obtain promising results: the position of the user terminal can be estimated with the accuracy (or, positioning
error) at the level of 96.5m and 149.8m for the 67% and the 95% confidence interval, respectively.
1 INTRODUCTION
1
The geographic position of a user terminal is valu-
able and critical information to provide ubiqui-
tous/intelligent services such as location-based emer-
gency terminal service. Many researchers and engi-
neers have made great efforts to obtain accurate user
terminal position information with or without Global
Positioning System (GPS).
Although GPS is able to provide excellent position
accuracy, position fixes require lines of sight (LOS)
to multiple satellites, long first fix time (at least 30s),
and high processing power. Assisted GPS, or AGPS
(Djuknic, 2001), is a technology that uses an assis-
tance server in a cellular infrastructure to cut down
the time needed to fix the position. In AGPS sys-
tems, the terminal, being limited in processing power,
1
Korea patent pending.
communicates with the assistance server that has high
processing power. In response to position queries,
AGPS terminals measure satellite signals and cellu-
lar network parameters (such as RSS) and relay them
to the assistance server. The server uses those data
to calculate the position of the terminal and send the
calculated position back to the terminal. In urban ar-
eas, however, AGPS does not work (like GPS) under
heavy tree cover or indoors where the terminal cannot
receive a sufficient number of satellite signals. More-
over, equipping a terminal with AGPS module raises
terminal production cost. That’s why some proposed
positioning technologies exploit the inherent radio pa-
rameters of the cellular network rather than relying on
GPS technologies.
The network parameters open up several possibili-
ties for positioning methodology. Simply, every cel-
lular system provides some information identifying
the serving cell (Cell-ID) enabling a coarse-grained
242
Lee S., Lee J., Kwon T., Choi Y., Joon Ha T. and Kim T. (2006).
USE OF AGPS CALL DATA RECORDS FOR NON-GPS TERMINAL POSITIONING IN CELLULAR NETWORKS.
In Proceedings of the International Conference on Wireless Information Networks and Systems, pages 242-249
Copyright
c
SciTePress

position estimate. For more accurate positioning, a
number of proposed solutions have utilized the prop-
agation delay, time-difference-of-arrival (TDOA), an-
tenna orientation or received-signal-strength (RSS).
The propagation time (or time-of-arrival) to the cell
tower is only available in TDMA systems and UMTS.
And in cases without LOS view between the transmit-
ter and the receiver, the distance from the propagation
time is overestimated. TDOA among several cell tow-
ers could be measured and the terminal position can
be obtained by solving the hyperbolic system. Hy-
perbolic systems require time synchronization among
cell towers, which is feasible not in GSM and UMTS
but in only CDMA networks. Additional hardware
can compensate for the time asynchronity but raises
costs. The hyperbolic systems also suffer from the in-
accurate TDOA measurements mainly caused by the
near-far problem: Idle Periods in Downlink (IPDL)
is proposed to mitigate the problem while it costs
downlink capacity and additional complexity (3GPP,
2002). The information of sector antenna orientation
and angle opening can be used to increase the posi-
tioning accuracy. Many service providers, however,
do not maintain the information of each sector an-
tenna. And radio waves may arrive from outside the
opening angle due to antenna side lobes, reflections,
and diffractions especially in dense urban areas.
Compared to the above-mentioned parameters,
RSS is the commonly available basic parameter for
all types of wireless cellular systems. Shadow-
ing and multipath fading, however, make RSS an
unreliable metric to estimate the exact transmitter-
receiver distance. Moreover, the RSS-to-distance
function (propagation model) is highly affected by en-
vironment/system specific factors such as height of
surrounding buildings, walls and operation RF fre-
quency. Thus, rather than RSS-based triangulation,
RSS database pattern matching algorithm is in use. It
overcomes the above-mentioned problems by using a
database built from measurements or predictions. The
position of the terminal is then determined by com-
paring the terminal’s RSS measurements to the data-
base entries and finding the best-matching position.
Making appropriate measurements over wide cellu-
lar network areas is very expensive and therefore not
considered applicable. Moreover, the change of cell
towers’ locations, antenna angles, and surrounding
buildings mandates frequent update of the database.
Thus, the pattern matching approach is more practical
by wireless LAN based small-area/indoor positioning
services. Prediction data, on the other hand, can be
obtained from wave propagation simulation tools and
remove the database maintenance overhead. Accu-
rate prediction, however, requires precise 3-D maps
over large areas and accurate/detailed network para-
meters including antenna loss, height, tilt, transmis-
sion power, etc., which are not commonly and easily
obtained. And the maps and parameters also require
frequent update.
In this paper, we propose to exploit the call data
records (CDRs) uploaded by Assisted Global Posi-
tioning System (AGPS) terminals as inputs to the pat-
tern database, which removes or reduces the pattern
collection overhead. The characteristics of RSS pat-
terns and AGPS CDRs are analyzed and reflected
in designing a pattern-distance metric and pattern
matching system, respectively. The main contribu-
tions of this paper are:
• Database cost reduction: we show that the AGPS
CDRs can be utilized to build and maintain a pat-
tern database for positioning of non-AGPS termi-
nals.
• Pros and cons of the use of the AGPS CDRs
– As the number of AGPS users increase, non-
AGPS terminals obtain more accurate position
results. It means that non-AGPS terminals can
obtain more accurate positioning results in the
area where more AGPS calls are generated (po-
sition information of non-AGPS terminals will
be requested much more frequently).
– Absence of AGPS CDRs in indoor areas may re-
duce the coverage of pattern matching position-
ing area. However, we show that indoor posi-
tioning by the proposed method is possible even
with outdoor AGPS CDRs.
• The analysis of RSS pattern characteristics: we de-
sign a pattern-distance metric based on the analy-
sis.
The performance of the pattern-distance metric and
the AGPS CDRs based pattern matching system are
evaluated by examining the field data of urban down-
town area of Seoul, Korea. Field trials provide
promising results: the position of a user can be es-
timated with the accuracy at the level of 96.5m and
149.8m for the 67% and the 95% confidence interval,
respectively.
The remainder of this paper is organized as follows.
In the next section, we present related work. Section
3 introduces the proposed pattern matching localiza-
tion, and Section 4 details the proposed pattern dis-
tance metric. In Sections 5 and 6, experimental results
and concluding remarks are given.
2 RELATED WORK
Cell-ID, time-difference-of-arrival (TDOA), GPS are
the traditional localization methods in cellular net-
works (3GPP, 2002), (Djuknic, 2001),(Zhao, 2002).
In Cell-ID systems, the position of user terminal is
determined as the position of serving cell tower. This

method is simple and applicable to every cellular net-
work, but it offers only coarse-grained position infor-
mation because the cell area is typically wide. TDOA
uses the time difference of the radio signal propaga-
tion to estimate the distance between the user terminal
and the adjacent cell towers. By using these distance
data, TDOA triangulates the position of the user ter-
minal. This method can provide a more accurate po-
sition than the Cell-ID method, but its application is
limited to synchronized networks or it introduces an
additional hardware cost to measure the asynchronity.
GPS provides specially coded satellite signals that can
be processed in a GPS receiver, enabling the receiver
to calculate the position, the velocity and the time;
accuracy of GPS is fairly high. By attaching a GPS
receiver on a user terminal, GPS can be employed in
cellular networks. However, GPS is not available in
indoors or deep urban canyons, because it requires
LOS to satellites. In cellular networks, on the other
hand, AGPS is used to reduce the time required to
find the position of the user terminal.
Pattern matching localization method is proposed
to overcome the limitations of traditional methods
(Bahl, 2000), (Laitinen, 2001), (Ahonen, 2003),
(Borkowski, 2005). Under the pattern matching
method, a user terminal measures the radio signal pat-
tern, and then, seeks for the most similar pattern in the
pattern database, which consists of the radio signal
patterns gathered at the specified positions a priori. In
this way, the position of the user terminal is estimated.
(Bahl, 2000) proposes a pattern matching method for
wireless local area networks, while (Laitinen, 2001),
(Ahonen, 2003), (Borkowski, 2005) employ the pat-
tern matching in cellular networks.
Under the pattern matching method, because the
signal pattern database should be updated periodically
in order to adapt to the ever-changing radio environ-
ment, the maintenance cost is significant. Accord-
ingly, a number of research efforts have been made
to reduce the maintenance cost. (Zhu, 2005), (Roos,
2002) employ the radio signal propagation model to
predict the radio signal patterns at the specific posi-
tions. Measured field data can complement the radio
signal propagation model: it therefore reserves accu-
racy of the signal pattern database with a low pattern
database maintenance cost. This prediction method is
orthogonal to our proposed AGPS CDR base method,
thus, they can be used together with our method. Ac-
curate propagation modeling, however, requires pre-
cise 3-D maps over large areas and detailed network
parameters including antenna loss, height, tilt, trans-
mission power, etc. (Smailagic, 2002), (Lim, 2006)
propose special algorithms exploiting spatial correla-
tion of patterns in wireless LAN environments. Al-
though they are proved to work well in indoor wire-
less LAN systems, we observed that it is inappropri-
ate to apply them to cellular network systems because
of cellular systems’ larger cell coverage and more
dynamic radio environment than those of small-area
wireless LAN systems.
3 PATTERN MATCHING
LOCALIZATION
3.1 Basic Pattern Matching System
Figure 1 depicts the basic pattern matching system ar-
chitecture. In basic pattern matching systems, opera-
tors use dedicated measurement terminals and collect
signal patterns at positions (whose positions are al-
ready known) in advance. And the patterns are stored
in the signal pattern database. Signal patterns at a po-
sition may vary with the change of radio propagation
environment or cell planning. Therefore, operators
are required to periodically measure signal patterns to
maintain the signal pattern database up-to-date. We
call a collected signal pattern stored in signal pattern
database as a seed. That is, the seed is the entry in the
signal pattern database. On the other hand, we call a
signal pattern in a position request from a terminal as
a sample.
In order to determine the position of a user termi-
nal, the user terminal first measures the signals from
surrounding cell towers, and sends the sample pattern
to the infrastructure to find the most correlated pat-
tern which is used to estimate the position where the
terminal’s pattern is measured.
Collecting seed patterns over the wide area of the
cellular network is labor-intensive work. Suppose we
collect seeds at every 50 m grid point in 1km
2
range,
400 times of measurement are needed, and in case of
5km
2
urban area range, 10,000 times. Furthermore,
operators should measure seed patterns periodically
to maintain the database up-to-date. Moreover, in or-
der to obtain the more accurate position fix, the more
and the denser seed patterns are needed. Therefore,
we propose a novel pattern matching system to auto-
mate the construction of the signal pattern database.
3.2 Proposed Pattern Matching
System
The proposed AGPS CDR based pattern matching
architecture is illustrated in Figure 2. In the pro-
posed system, we make use of the CDRs uploaded
by AGPS terminals as seed patterns for positioning
non-AGPS terminals. In general, AGPS is accurate
within 50 meters when users are indoors if GPS sig-
nals are received and 15 meters when they are out-
doors (Djuknic, 2001), so that we can leverage the
AGPS result as the actual position of a terminal. An
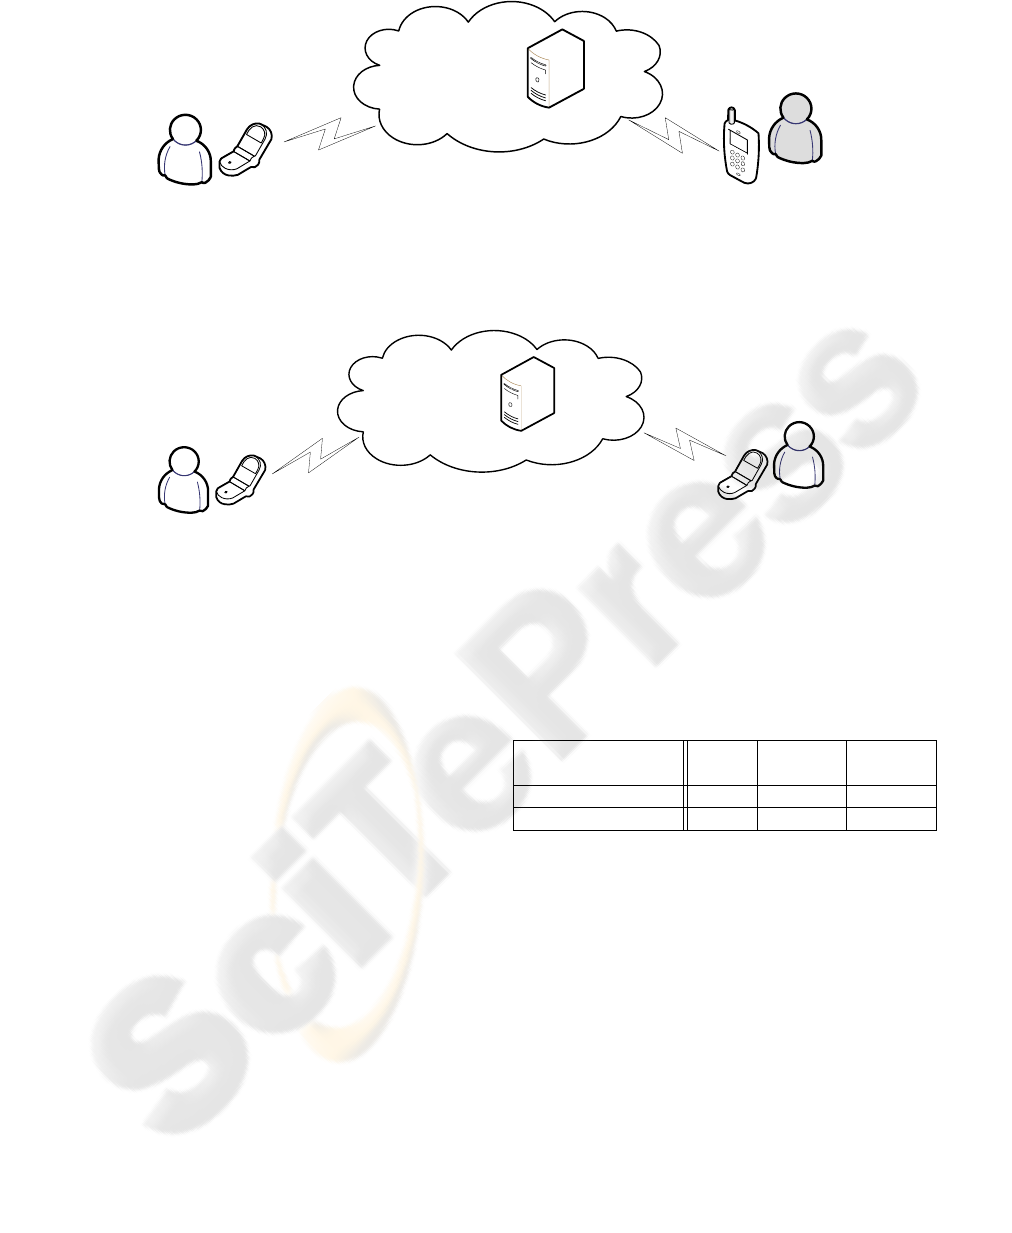
Seed Pattern
DB
Terminal
User
B1. In response to a
position request, a
sample pattern is
measured and sent to
the cellular
infrastructure.
B2. Find the most
correlated seed in the
pattern DB, and reply
with the position of the
most correlated pattern
B3. User gets the fixed
position.
Measurement
Terminal
Operator
A1. Operators collect
signal patterns and
store them in signal
pattern DB.
Cellular Infrastructure
Figure 1: Basic pattern matching architecture. Process A is the pattern database construction process, and process B is the
user terminal positioning process.
Seed Pattern
DB
Terminal
User
B1. In response to a
position request, a
sample pattern is
measured and sent to
the cellular
infrastructure.
B2. Find the most
correlated seeds in
pattern DB and
calculate the position,
and reply with the result
position
User
A1. In response to a
position request, an
AGPS terminal
measures satellite
signals and cell tower
signal patterns, and
reports them to the
cellular infrastructure.
A2. The position fix is
returned to the AGPS
terminal, and the CDR
is stored in pattern DB.
B3. User gets the fixed
position.
AGPS
Terminal
Cellular Infrastructure
Figure 2: AGPS CDR based pattern matching architecture. Process A is the pattern database construction process using AGPS
user terminals, and process B is the user terminal positioning process.
AGPS CDR includes the call time as well as the sig-
nal pattern and an AGPS positioning result (3GPP2,
2001). From the CDMA (IS-95) system of the com-
pany A in Korea, we have obtained this log data with-
out any modification on the system. In this way, we
are able to construct and maintain a pattern database
at low cost.
In some cases, the size of the seed pattern data-
base may be too large to manage, since the number of
AGPS terminals is increasing and many users exploit
AGPS for the location based service. Then, the data-
base lookup time and, eventually, position fix time
will increase. In this case, we can reduce the time
by doing spatial and temporal filtering for the incom-
ing CDRs. For example, we can designate regional
databases for each area unit, and each database main-
tains CDRs generated from its assigned area. When
we choose candidate seed patterns from the database
to compare with the sample pattern, we can filter out
old seeds. We can also consider the specific time in-
terval (a day of the week, a time in a day) at which
the sample and seed patterns are measured in choos-
ing most appropriate seed patterns in a manageable
size.
On the other hand, in a particular area, or a partic-
ular cellular network where AGPS terminals are gen-
erating calls not so frequently, there may not be suf-
Table 1: The result error distances (m) on the time varia-
tion. This table shows the mean positioning accuracy and
the accuracies (in meters) for the 67% (1 sigma) and 95%
(2 sigma) confidence interval, respectively.
Measurement date Mean 1 Sigma 2 Sigma
of sample
12/15/2005 87.7 110 169
2/8/2006 93.2 121 196
ficient number of seeds in the pattern database. In
this case, the seeds should be accumulated in the pat-
tern database for a long time to offer required accu-
racy in that area. This incurs a question on the seed
valid time. We investigate this question: how long
the seed is valid, by using two sample sets of 55-day
difference, which is somewhat long time if we con-
sider the rapid change of outdoor radio environment
especially in urban area. We collected the seed set
on Dec. 15, 2005, and used two sample set: one was
measured on Dec. 15, 2005, and the other on Feb.
8, 2006. The seeds and samples were collected from
about 100 spots of downtown area of Seoul (near the
Gangnam station, one of the most crowded areas in
Korea, with many high buildings) and the area size
is approximately 1km × 1k m. The result error dis-
Table 2: An example of RSS pattern (unit: dBm).
Location RSS RSS RSS RSS
from from from from
cell 1 cell 2 cell 3 cell 4
(37.5085, -4.43 -7.23 -10.22 -20.46
127,0335)
tance of our proposed method is shown in Table 1.
The mean error of former sample set (with ’fresh’
seeds) is 87.7 m, while that of the latter sample set
(with ’55-day-old’ seeds) is 93.2 m. Despite of the
55 day gap between the two sets, the positioning ac-
curacy results do not make a considerable difference.
This demonstrates that the duration of the seed valid-
ity could be very long than our presumption. There-
fore, when AGPS terminals are generating calls not so
frequently, we can store seeds in the pattern database
for a long time to maintain the density of seeds in the
pattern database.
The basic pattern matching picks up only one seed
(and its measurement position) in determining the po-
sition of a sample pattern. Consequently, the result
of the basic pattern matching will become unstable
as the variations of the radio signals increase (due to
slow fading and fast fading). In order to mitigate the
effect of the variations, we select multiple seeds and
use them together in determining the position of user
terminals. We introduce a metric of the pattern dis-
tance, which will be detailed in Section 4, and select
multiple seed patterns in terms of the pattern distance.
We then estimate the centroid of the selected seeds as
the position of a user terminal. The field trial test in
Section 5 shows that this centroid method exhibits
with less deviating positioning results.
4 PATTERN DISTANCE METRIC
We define a radio signal pattern as a set of the
received-signal-strengths (RSSs) of adjacent cell tow-
ers (Table 2). User terminals commonly measure the
RSS of the pilot channel to determine when to hand-
off to other cells, or to control transmit power in any
cellular network, i.e., GSM, CDMA, WCDMA net-
works.
Before designing a pattern distance metric, we an-
alyze the characteristics of RSS patterns. First we
look at the distribution of RSS values measured from
one cell tower as illustrated in Figure 3. X, Y, and
Z axes represent latitude, longitude, and RSS value
in dBm, respectively. Circular points indicate mea-
surement locations. In Figure 3, as the user terminal
goes far from the cell tower, the measured RSS value
Cell Tower
Figure 3: Signal strength at various positions received
from a cell sector antenna. Cell tower is at (37.50504,
127.02527).
decreases while the RSS values measured near the
cell tower are not decreasing fast. Although there are
some fluctuation of RSS values due to slow and fast
fading, in general, the difference between two RSS
values measured at two positions increases in propor-
tion to the distance between the positions. With these
characteristics of the RSS, we reach the following ob-
servation.
• Observation 1. In general, as the distance between
two measurement positions increases, the differ-
ence between the two measured RSS values in-
creases. The pattern distance metric should reflect
the difference between RSSs of two patterns (i.e.,
a seed and a sample), then eventually indicate the
distance between the two measurement positions.
Therefore, in order to take RSS difference into an
account to pattern distance metric, we use the Euclid-
ean distance as follows.
v
u
u
t
n
X
k=1
(RSS
A
k
− RSS
B
k
)
2
.
where n is the number of RSSs in two patterns and
RSS
A
k
is the k
th
RSS value of the pattern A and
RSS
B
k
is the k
th
RSS value of the pattern B.
Because RSSs of the points at the same distance
from a cell tower are similar (as shown in Figure 3),
if a pattern (sample or seed or both of them) contains
only one RSS measurement value from one cell, the
pattern with a single RSS may appear at a number of
positions. In that case, the picked-up position of the
most correlated seed based on the above metric may
be far from the position of the sample pattern. How-
ever, as the number of RSS values from different cells
increases, an RSS pattern will have a fewer number of
candidate positions. In addition to Observation 1, we
come to another observation.
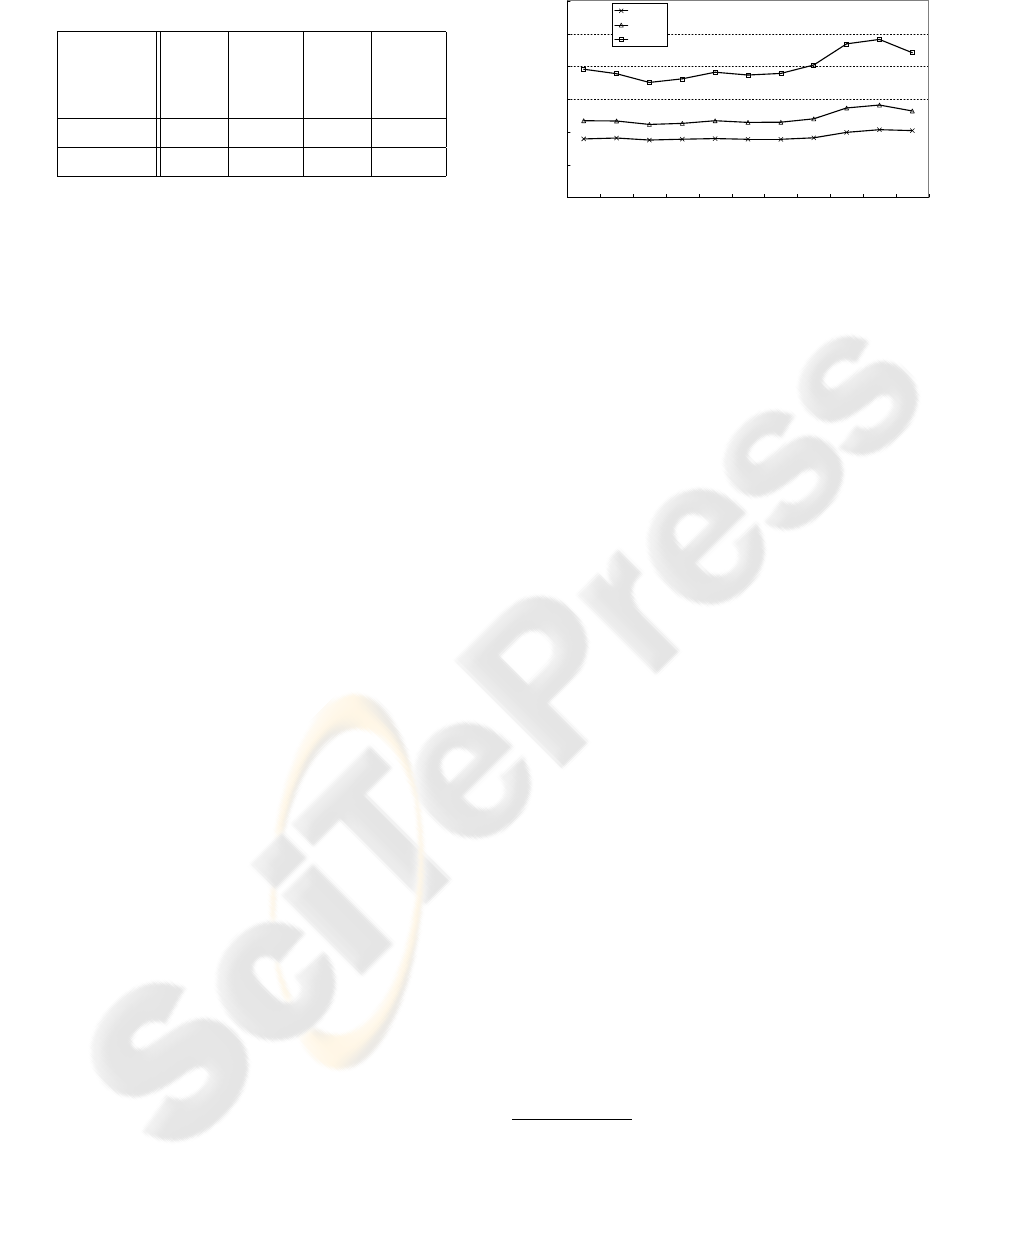
Table 3: An example of hole RSS. (unit : dBm).
RSS RSS RSS RSS
from from from from
cell 1 cell 2 cell 3 cell 4
Pattern A -3.42 -5.23 hole -16.78
Pattern B -6.23 -13.25 -8.43 hole
• Observation 2. Let S
A
and S
B
denote the set of
cells whose pilot signals are received by user A
and user B, respectively. As the number of cells
in their intersection increases, we can say that the
similarity (the distance between A and B) between
two patterns becomes more substantial. Therefore,
comparing two patterns, we need to consider the
number of cells common in the two patterns.
Patterns may have RSSs from a different set of
cells. Let us take an example of Table 3, in which
pattern A has RSSs from cell 1, cell 2, and cell 4, and
pattern B has RSSs from cell 1, cell 2, and cell 3. In
this example, we cannot calculate Euclidean distance
between patterns A and B. We call the RSS from the
cell whose RSS is measured by only one pattern (not
in the other pattern) as hole. In the example of Ta-
ble 3, the pattern A contains a RSS from cell 4 but
the pattern B does not: the RSS entry of cell 4 is a
hole in pattern B. Likewise, the RSS entry of cell 3 is
a hole in pattern A. As we have observed, if the num-
ber of holes of a pattern pair is large, the two patterns’
measurement positions are far apart.
In order to calculate the Euclidean distance be-
tween them, we assign a certain constant value to
holes: hole RSS. Through an experiment given in
Section 5, we find that a constant somewhat lower
than the smallest RSS in the pattern database (also in
the sample patterns) is appropriate for the hole RSS.
According to Observation 2, we should give some
penalty to holes, and the proposed hole RSS method
gives penalty by assigning a small value to the hole:
as the hole RSS becomes smaller, a distance metric
value becomes larger.
We have tested our proposed metric by observing
the correlation coefficient between the pattern dis-
tance metric and the actual geographic distance. High
coefficient value (close to one) indicates the proposed
pattern distance metric reflects the actual geographic
distance well. From the data set (both seed and sam-
ple) of section 5, all possible pattern pairs are exam-
ined: we calculate the correlation coefficient between
the vector of pattern distance metric and the vector
of geographic distance (between measurement posi-
tions). The results show that a promising value of a
coefficient of 0.7.
The another application of the proposed distance
0
50
100
150
200
250
300
-50 -47.5 -45 -42.5 -40 -38 -35 -33 -30 -28 -25
Hole RSS (dB)
Error Distance (m)
mean
1sigma
2sigma
Figure 4: Experiment result with various hole RSS. 1 sigma
means the accuracy for the 67% confidence interval and 2
sigma means the accuracy for the 95% confidence interval.
metric is to infer confidence level of a position fix.
If the sample and the picked-up most correlated seed
has a small pattern distance metric, the measurement
position of the seed patten is close to the sample mea-
surement position, i.e., the position fix is accurate
with a high probability.
5 EXPERIMENTAL RESULTS
We have performed extensive experiments with data
gathered from the commercial CDMA network of the
company A in the urban area of Seoul, Korea. The
gathered data sets are as follows.
2
• Seed pattern database: The pairs of the posi-
tion and the signal pattern were gathered by the
CDRs uploaded by AGPS terminals in the urban
area (near the Gangnam station) of Seoul. The area
size is 1km×1.8km, and we obtained seed patterns
of 283 positions in that area.
• Sample data set: We measured signal patterns at
30 points in the area covered by the signal pattern
database. We measured 5 samples at one point, in-
doors/outdoors separately at the same point
3
; 300
samples in total were measured. We retrieved the
real latitude and longitude of each point using the
digital map, which enabled us to calculate the error
distances of localization results.
Choice of Hole RSS: First, we have performed an
experiment to determine the appropriate value of the
hole RSS. We figured out under which value it shows
the best accuracy, varying the hole RSS from -50 dB
2
In our experiments, the CDRs contain the SINR values
(Ec/Io) from the adjacent cell towers, and we have used the
SINR values as signal pattern instead of the RSS.
3
For example, samples were measured inside and out-
side of a building entrance with a distance of several meters,
or measured under the roof and on the roof of a building.
0
50
100
150
200
250
0 0.1 0.2 0.3 0.4 0.5 0.6 0.7 0.8 0.9 1
Seed Selection Range
Error Distance (m)
mean
1sigma
2sigma
Figure 5: Experiment result with various seed selection
range.
0
0.1
0.2
0.3
0.4
0.5
0.6
0.7
0.8
0.9
1
0 30 60 90 120 150 180 210 240 270
Error Distance (m)
Cumulative Probability
Indoor samples
Outdoor samples
Figure 6: Cumulative distribution function (CDF) accuracy
of proposed pattern matching that used with indoor and out-
door samples separately. Hole RSS is -45 dB and seed se-
lection range is 0.37.
0
50
100
150
200
250
300
350
400
450
40 70 100 130 160 190 220 250 280 310
Grid Size (m)
Error Distance (m)
mean
1sigma
2sigma
Figure 7: Experiment result with various grid size (seed
density). Hole RSS is -45 dB and seed selection range is
0.37.
0
0.1
0.2
0.3
0.4
0.5
0.6
0.7
0.8
0.9
1
0 50 100 150 200 250 300 350 400 450 500 550 600 650
Error Distance (m)
Cumulative Probability
Cell ID
Proposed PM
Figure 8: Cumulative distribution function (CDF) accuracy
of proposed pattern matching and Cell ID method. Hole
RSS is -45 dB, and seed selection range is 0.37, and all
seeds are used.
to -25 dB. Figure 4 shows that, with -45 dB of the hole
RSS, we can achieve the best accuracy; in this case,
the mean error distance is 87.4 m and 2 sigma (the ac-
curacy for the 95% confidence interval) is 175.2m. In
our experiment environment, the minimum RSS that
a user terminal can detect is around -32 dB: -45 dB is
somewhat lower value than the minimum RSS. From
this result, we can infer that the somewhat lower value
than the minimum RSS which a user terminal can de-
tect is eligible when applying our proposed method to
other wireless networks.
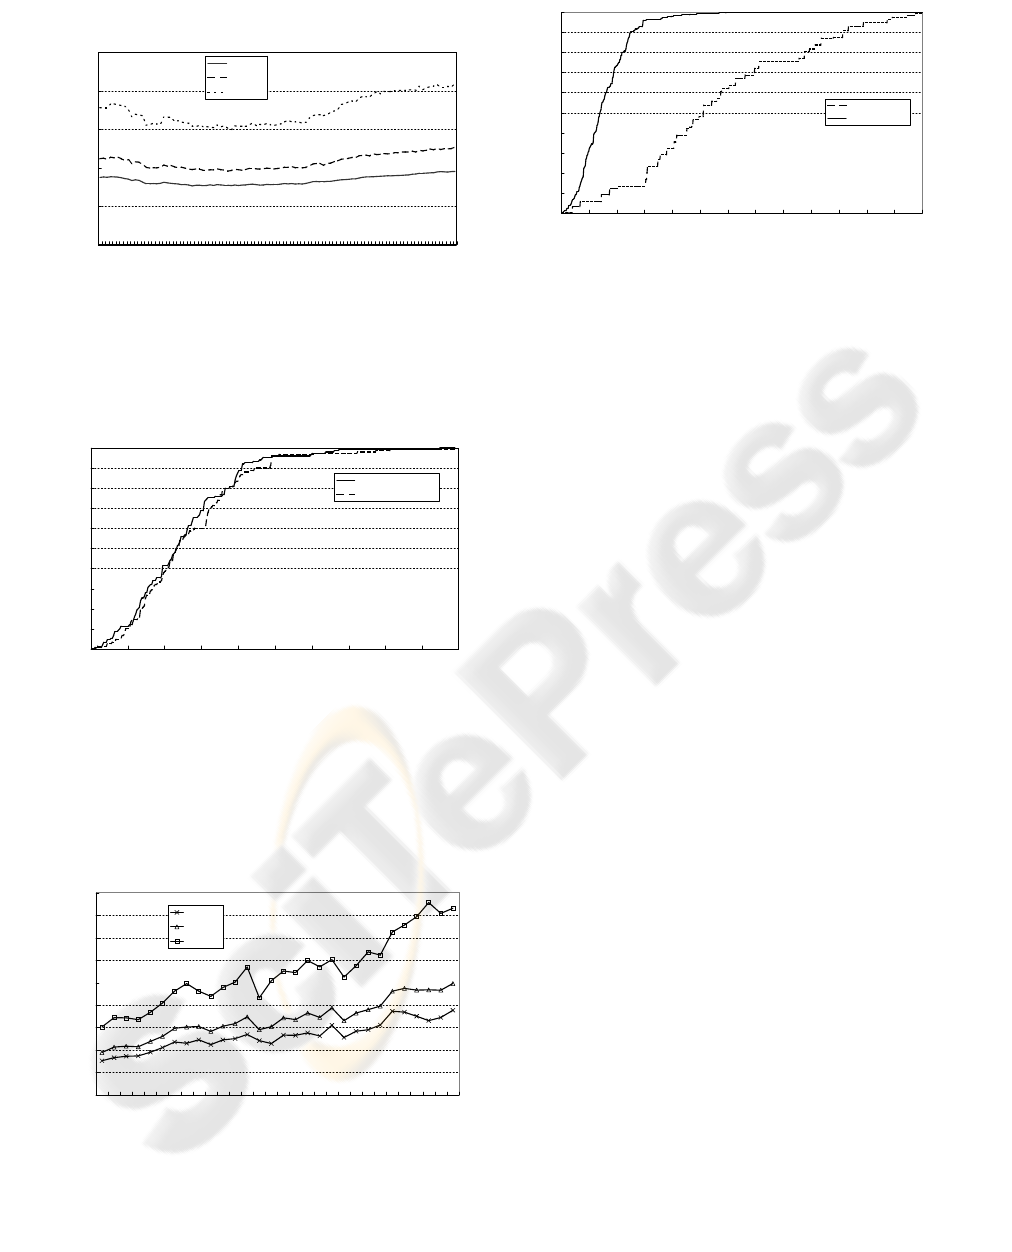
Effect of multiple top seeds: Next, we have fig-
ured out the effect of seed selection when determin-
ing the position of a user terminal. The basic pattern
matching uses only the most similar seed (top seed),
and determines the position of that seed as the user
terminal’s position. However, because of the momen-
tary fluctuation of the radio signal caused by shad-
owing, the result of the basic pattern matching is not
stable. This is the reason why we propose to exploit
several similar seeds when estimating the position of
a user terminal in the previous section. We perform an
experiment, varying the seed selection range based on
the top seed metric. The seed selection range will be
denoted by S. Let m be the top seed metric, then we
will consider the positions of the seeds whose metric
is less than m × (1+S). Then we determine the posi-
tion of a user terminal as the centroid of those seeds.
We use -45 dB as the hole RSS in all following exper-
iments.
Figure 5 shows the error distances with varying the
value of the seed selection range. When the seeds are
selected within the appropriate seed selection range,
the accuracy of the result is better than that of the case
that only top seed is selected, i.e., when the seed se-
lection range is zero. From the graph, we find that
the accuracy of the result is the best when the seed
selection range is 0.37, in which case, the mean error
distance is 76.8 m and the 2 sigma result was 149.8m.

In particular, the 2 sigma result shows more improve-
ment (180m to 150m) while the mean value exhibits
relatively small improvement (90m to 77m): this cen-
troid method decreases the deviation, and thus, has a
stabilization effect.
Indoor vs. outdoor: Throughout the previous ex-
periments, we have used the mixture of both the in-
door and the outdoor samples. Now, we test whether
our proposed pattern matching is suitable for the in-
door samples. Figure 6 shows the cumulative distri-
bution function (CDF) accuracy of our proposed pat-
tern matching with indoor and outdoor samples sepa-
rately. Although the indoor samples are usually col-
lected from several meters inside from building en-
trances and do not include deep basement samples, it
shows almost the same accuracy values in both indoor
and outdoor samples, from which we could conclude
our proposed pattern matching is suitable for both the
indoor and the outdoor samples.
Effect of seed density: The accuracy of our pro-
posed pattern matching shows some dependency on
the density of the seeds (the number of seeds in the
seed database per unit area). Through experiments,
we examine the relation between the density of seeds
and the accuracy of our method. In the experiment,
we divide a range into grids, and leave only one seed
in a grid. Figure 7 shows the experiment result. As
the grid size increases, the accuracy of the proposed
pattern matching method becomes lower. Particularly,
above 70 m of the grid size, the accuracy of our pro-
posed pattern matching decreases rapidly. Hence, in
our proposed pattern matching, the appropriate den-
sity of seeds has to be maintained to achieve the high
accuracy.
Comparison with Cell-ID: Finally, we have com-
pared the accuracy of our proposed method with the
Cell-ID method. Figure 8 shows the cumulative dis-
tribution function (CDF) accuracy of our proposed
pattern matching and Cell-ID method. As Figure 8
shows, the accuracy of our proposed pattern match-
ing is much higher than Cell-ID method.
6 CONCLUSION
In this paper, we have proposed a novel pattern match-
ing localization method for the cellular network, by
exploiting the CDRs uploaded by AGPS terminals as
inputs to the pattern database. We have analyzed the
characteristics of RSS patterns from AGPS CDRs,
and designed the pattern-distance metric and the new
pattern matching method using that metric. The pro-
posed positioning method reduces the pattern collec-
tion overhead by automating the construction of the
RSS pattern database. The experiment results demon-
strate that 1) the accuracy of the proposed position-
ing method is much higher than that of the Cell-ID
method 2) the proposed AGPS CDR based method
works well for indoor users as well as for outdoor
users 3) the density of seed patterns is closely related
to the positioning accuracy. For the future work, we
will investigate how to leverage other GPS-free po-
sitioning methods together with the proposed AGPS
CDR based pattern matching method.
REFERENCES
Djuknic, G.; Richton, R. (2001). Geolocation and Assisted
GPS. In IEEE Computer Magazine, Feb. 2001. IEEE
press.
Zhao, Y. (2002). Standardization of Mobile Phone Position-
ing for 3G Systems. In IEEE Communications Maga-
zine, Jul. 2002. IEEE press.
Laitinen, H.; L
¨
ahttenm
¨
aki, J.; Nordstr
¨
om T. (2001). Data-
base Correlation Method for GSM Location. In VTC.
IEEE press.
Ahonen, S.; Laitinen, H. (2003). Database Correlation
Method for UMTS Location. In VTC. IEEE press.
Borkowski, J.; Lempi
¨
ainen, J. (2005). Pilot correlation po-
sitioning method for urban UMTS networks. In Euro-
pean Wireless Conference 2005.
Zhu, J.; Durgin, G.D. (2005). Indoor/outdoor location of
cellular handsets based on received signal strength.
In Electronics Letters, Vol. 41, No. 1, Jan. 2005. IEE
press.
Daniel Wong, K. (2001). Get-Location in Urban Areas Us-
ing Signal Strength Repeatability. In IEEE Communi-
cations Letters, Vol. 5, No. 10, Oct. 2001. IEEE press.
Roos, T.; Myllym
¨
aki, P.; Tirri, H. (2002). A Statistical
Modeling Approach to Location Estimation. In IEEE
Transactions on Mobile Computing, Vol. 1, No. 1,
Jan.-Mar. 2002. IEEE press.
Bahl, P.; Padmanabhan, V. N. (2000). RADAR: An In-
Building RF-based User Location and Tracking Sys-
tem. In INFOCOM 2000, IEEE press.
Smailagic, A.; Kogan, D. (2002). Location Sensing and
Privacy in a Context-Aware Computing Environment.
In IEEE Wireless Communications, Oct. 2002. IEEE
press.
Lim, H.; Kung, L.; Hou, J. C.; Luo, H. (2006). Zero-
Configuration, Robust Indoor Localization: Theory
and Experimentation. In INFOCOM 2006, IEEE
press.
3GPP. (2002). Stage 2 functional specification of User
Equipment (UE) positioning in UTRAN (Release 4).
3GPP.
3GPP2. (2001). Position Determination Service Standard
for Dual Mode Spread Spectrum Systems. 3GPP2.
