
ANALYTIC HIERARCHY PROCESS AND ITS APPLICATION
TO GRADE OF TRAFFIC SERVICE FOR CELLULAR
NETWORK
Kentaro Hoshi, Sadahiko Kano
Graduate School of Global Information and Telecommunication Studies, Waseda University, Shinjuku, Tokyo, Japan
Yoshitaka Takahashi
Faculty of Commerce, Waseda University, Shinjuku, Tokyo, Japan
Shigeru Kaneda, Noriteru Shinagawa
Network Laboratories, NTT DoCoMo, Inc., 3-5, Hikarinooka, Yokosuka, Kanagawa, Japan
Keywords: Analytic Hierarchy Process, Consistency index, Threshold, Grade of traffic service, Group decision making.
Abstract: In a cellular network, several tra
ffic control services are previously provided. Above all, when the network
becomes congested e.g. world-cup ticket-reservation, THREE traffic control scenarios are proposed. In this
paper, applying an AHP (Analytic Hierarchy Process) approach enables us to obtain a solution which
scenario is best/worst among these traffic control scenarios, from user’s view point. Firstly, we construct a
web site on which cellular network users can simply answer a questionnaire regarding grade of traffic
services via internet. We then formulate a pair-wise comparison matrix (p.c.m.) through this questionnaire
result for an individual respondent. We next calculate the maximum eigenvalue of the p.c.m., which leads to
CI (consistency index). Via this CI value, we can see how well the respondent answers logically. Through
this process, we obtain all CI values for all questionnaire respondents. We propose a decision making
technique for questionnaire respondents group through these individual CI values. Taking the geometric
mean of p.c.m. elements we obtain the weighted eigenvector for the maximum eigenvalue of this geometric
mean p.c.m., namely priority (users’ dissatisfaction) vector. From the priority vector, we can see how
well/badly these traffic control scenarios operate.
1 INTRODUCTION
In a Cellular Network, several traffic control
services are previously provided. Above all, when
the network becomes congested e.g. world-cup
ticket-reservation, THREE traffic control scenarios
are proposed and becoming important (Akinaga,
Kaneda, 2005); spatial distribution, time
distribution, and traffic reduction. By spatial
distribution, we mean that users are recommended to
move in an area where communication channels are
not so busy. Traffic can be spatially distributed. By
time distribution we mean that users are
recommended to wait for a while so that users can
access the network with a higher probability. Traffic
can be distributed over a period of time. By traffic
reduction we mean that users are recommended to
change from voice service into data (e-mail or web)
service. Traffic can be reduced since data service
(channel holding) time is much shorter than voice
service time (channel holding). The main purpose of
this paper is to evaluate these traffic control
scenarios by using an AHP (Analytic Hierarchy
Process) approach.
The AHP approach is applied to obtain a solution
wh
ich scenario is best/worst among these traffic
control scenarios, from user’s view point. Firstly, we
construct a web site on which cellular network users
can simply answer a questionnaire (a set of
questions) regarding grade of traffic control
scenarios via internet. There are very few literatures
on AHP questionnaires systems at web site in Japan.
114
Hoshi K., Kano S., Takahashi Y., Kaneda S. and Shinagawa N. (2006).
ANALYTIC HIERARCHY PROCESS AND ITS APPLICATION TO GRADE OF TRAFFIC SERVICE FOR CELLULAR NETWORK.
In Proceedings of the International Conference on Wireless Information Networks and Systems, pages 114-120
Copyright
c
SciTePress
The secondary purpose this paper is to provide an
idea and philosophy for making a web-site AHP
questionnaire system. At the beginning of our AHP
analysis, we formulate a pair-wise comparison
matrix (p.c.m.) through this questionnaire result for
an individual respondent. We next calculate the
maximum eigenvalue of the p.c.m., which leads to
CI (consistency index). Via this CI value, we can see
how well the respondent answers logically. When CI
value is smaller, the more the questionnaire
respondent answers consistently (The questionnaire
answer result with a high CI value is not reliable).
Figure 1: Analytic hierarchy process.
Through this process, we obtain all CI values for all
questionnaire respondents. Taking the geometric
mean of p.c.m. elements we obtain the weighted
eigenvector for the maximum eigenvalue of this
geometric mean p.c.m., namely priority (users’
dissatisfaction) vector. From the priority vector, we
can see how well/badly the traffic control scenarios
operate.
The rest of this paper is organized as follows.
Section 2 describes our hierarchy structure and the
necessary linear algebra mechanism. Section 3
constructs our web-site AHP questionnaire engine,
enabling one to obtain our solution. Here, we
propose a decision making technique for
questionnaire respondents group through individual
CI values. Section 4 summarizes our result and
mentions reaming our research topics.
2 AHP APPROACH
2.1 Hierarchical Structure and
Analytic Procedure
AHP is a mathematical approach for multicriteria
decision making (Saaty, 1980). In the AHP approach,
we have to start expressing a hierarchical structure
by dividing our problem into the several layers. Each
layer is assumed to consist of some elements. Here,
the number of layers and that of elements are not
constant, in other words, we have to decide how
many layers there are in the hierarchical structure
and elements in the individual layers. AHP is a very
flexible approach.
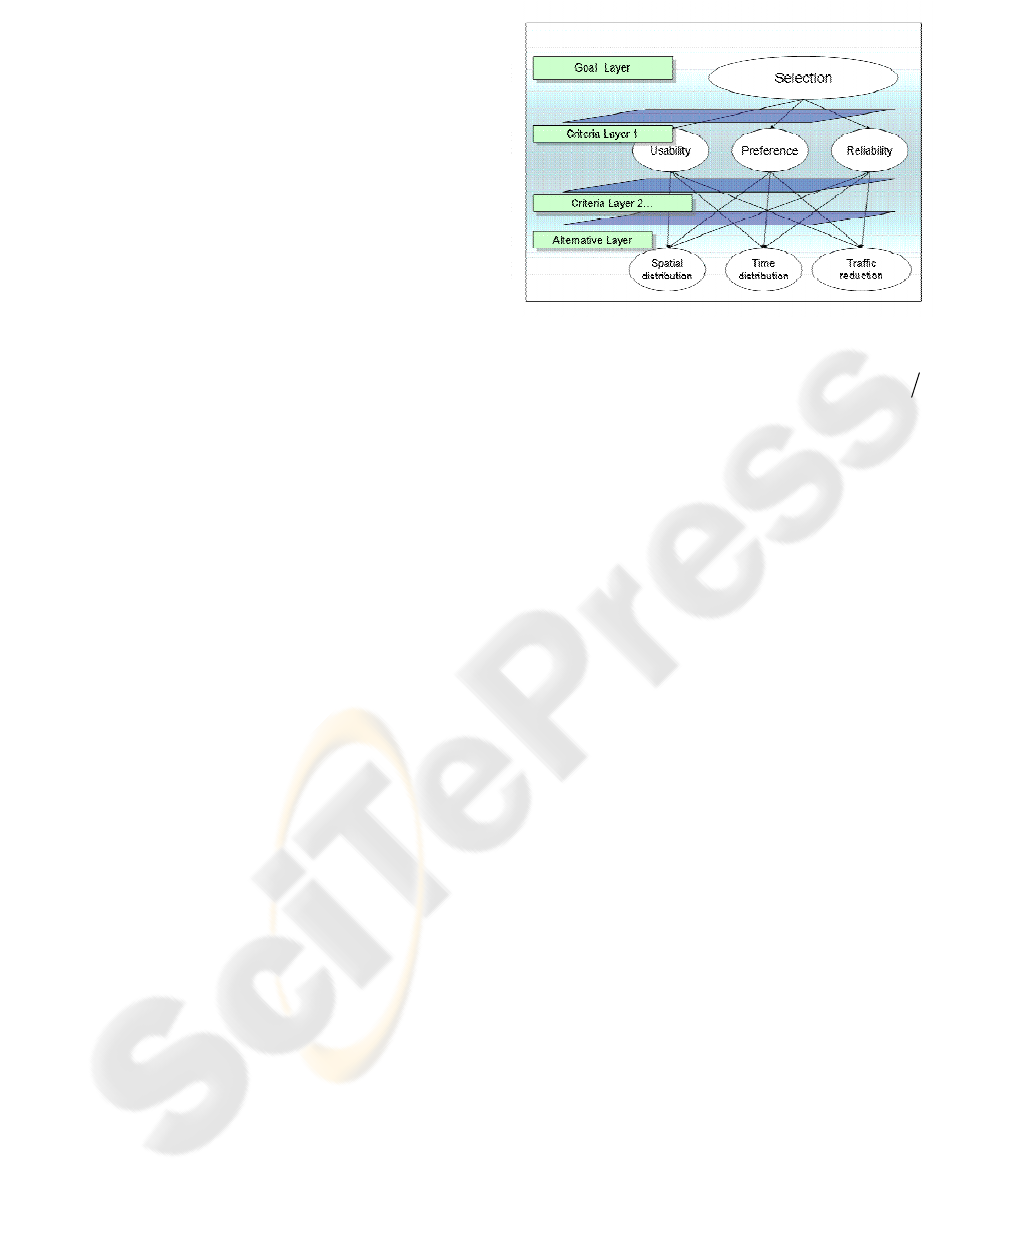
Though, the top layer of the hierarchical structure is
assumed to consist of only one element called a goal
(problem target). The bottom layer is called the
solution layer that may consist of some elements
where each element corresponds to a solution to the
goal. The middle layer(s) are (is) called the criteria
layer(s). Each element in the criteria layer will be
also called as criteria element; See Figure 1.
We have to subsequently compute the weights
between a pair of the elements in an individual layer.
If we denote by n the number of pair-wise
comparisons, we have to compare
2)1( −nn
times, since our pair-wise comparison should have a
special reciprocal form, i.e.
jiij
a
.We finally
calculates the weights of the overall layers. Based on
the calculated weights, we can evaluate priority to
the goal of an individual solution. For our analytical
process see Figure 1. We will describe the details of
CI (as seen in the figure) in the next section.
1=× a
a
2.2 Linear Algebra Structure
We calculate weight
n
on the
element layer
n21
. At this time,
if we assume importance occasion to of
i
a
that
is
ij
, element
21
p.c.m.
becomes
i
www ,,,
21
AAA ,,,
j
a
a
n
AAA ,,,
][
=
A
,,
2
. When provided
1
is well-known,
n
www ,
][
i
a
=
A becomes (1)
Note that, for any i, j and k holds
jkij
a
. The
evaluation illustrates completely consistent.
ik
aa =×
To multiply a weight column vector w by this p.c.m.
12
111 12 1
221 22 1
12
1
2
,1,2
// /
// /
// /
/, 1/,
n
n
n
ij
nn n nn
ij i j ij ji
n
ij n
AA A
A
ww ww ww
A
ww ww ww
Aa
A
ww ww ww
w
w
awwa a w
w
=
⎡
⎤
⎢
⎥
⎢
⎥
⎡⎤
==
⎣⎦
⎢
⎥
⎢
⎥
⎣
⎦
⎡⎤
⎢⎥
⎢⎥
== =
⎢⎥
⎢⎥
⎣⎦
(1)
Aw nw
=
i
A give a vector nw.
This expression is able to change an eigenvalue.
(1)An w 0
−
=i
(2)
ANALYTIC HIERARCHY PROCESS AND ITS APPLICATION TO GRADE OF TRAFFIC SERVICE FOR
CELLULAR NETWORK
115

I is an identity matrix. The following (2), if w ≠ 0 is
hold, n must become the eigenvalue A. Then w
becomes the eigenvalue vector A. Because rank A is
1, the eigenvalue
),2,1( ni
i
=
λ
becomes
one is non-zero, others are zero. Moreover, when the
sum total of the main opposite angle element A is
n, and λ
max
is λ
i
which is not zero,
max max
0, ( )
ii
n
λ
λλλ
==≠ (3)
Therefore, a weight vector w to
becomes a eigenvalue vector in
i
normalized to the maximum eigenvalue λ
n
AAA ,,,
21
∑
= )1( w
max
of A.
When it is actually applied to the questionnaire
analysis,
w
is unknown, we then must calculate
w
′
.
We can evaluate
w
from the p.c.m.
′
A
′
given
questionnaire answer.
'' ' '
max
A
ww
λ
=
max
λ
′
is the maximum eigenvalue of
A
. It gives
unknown . As conditions become more
complicated, it is in the tendency the results of the
questionnaire answer are not consistent more. We
know as does not become consistent, λ
′
w
′
A
′
max
grows bigger than n (Saaty, 1984).
''
'
max
''
11
()
nn
jij i
iji
ijij
wa w
n
ww a n
λ
==+
−
=+
∑∑
2
(4)
Following (4), always hold λ
´
max
≧ n. If λ
´
max
= n,
provided satisfy consistency. We can denote
consistency index by (5).
'
max
..
1
n
CI
n
λ
−
=
−
(5)
CI (Consistency Index) denotes whether pair
comparison is properly. Saaty who is the advocate of
AHP is proposed from experience when CI is less
than 0.15 or 0.1, we should do pair comparison
again because pair comparison can not be done
properly. When CI is 0, called perfect consistency,
and effective is value less than 0.15 or 0.1.
3 WEB AHP QUESTIONNAIRE
ENGINE
3.1 Quality Evaluation
THREE traffic control scenarios are proposed and
becoming important (Akinaga, Kaneda, 2005);
spatial distribution, time distribution, and traffic
reduction. By spatial distribution, we mean that
users are recommended to move in an area where
communication channels are not so busy. Traffic can
be spatially distributed. By time distribution we
mean that users are recommended to wait for a while
so that users can access the network with a higher
probability. Traffic can be distributed over a period
of time. By traffic reduction we mean that users are
recommended to change from voice service into data
(e-mail or web) service. Traffic can be reduced since
data service (channel holding) time is much
shorter than voice service time (channel holding).
Let evaluate a quantity about user dissatisfaction by
using an AHP.
Define,
z Goal: selection
z Criteria: usability, preference, reliability
z Solution: spatial distribution, time distribution,
traffic reduction (Figure 1).
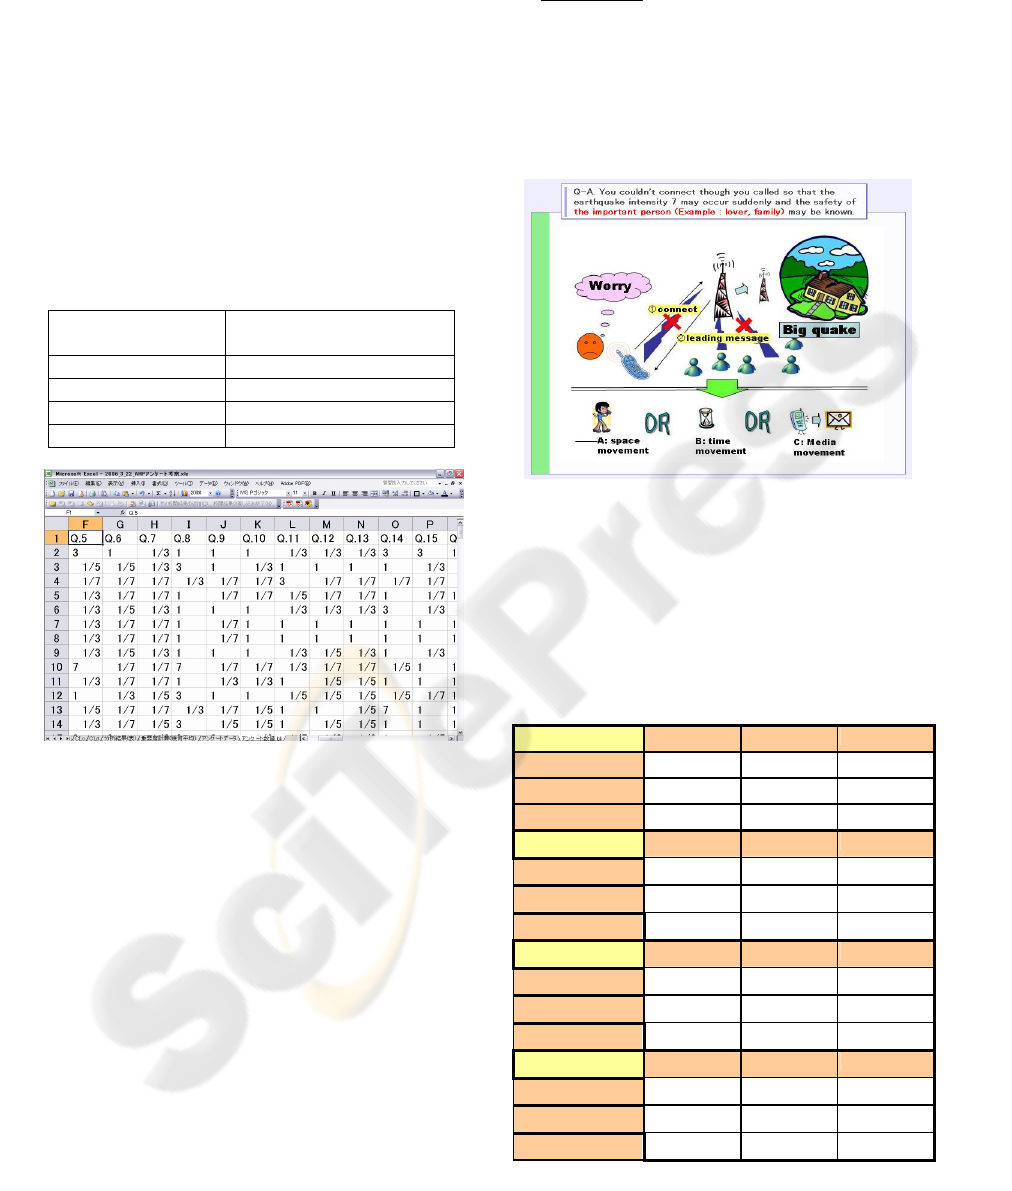
A terrible earthquake: Situation in which user calls
terrible earthquake to know safety of important
person.
A large fireworks: Situation in which user who gets
lost to friend in a large fireworks calls.
Ticketing reservation: Situation in which user calls
for ticketing early reservation of event
We construct hierarchical structure (Figure1).When
among solution is taken in criteria layer, element
‘usability’ imply whether to take much time,
element ‘preference’ implies whether to be poor,
element ‘reliability’ implies whether a worry is left.
Elements of Solution layer, ‘spatial distribution’
imply user movement. ‘time distribution’ implies
time shift. ‘traffic reduction’ implies other media
recommendation.
We must decide a number of layers with AHP,
however if one layer is increased, pair comparative
items increase by the element, and so questionnaire
despondence takes labour too much. In this paper,
criteria layer is only three, because avoid the AHP
questionnaire being repeated concerning.
3.2 Questionnaire Engine Construct
As for the questionnaire, although there are various
things of the paper base, exit polls, telephone
surveys and mailing investigations in principle, it is
the most suitable for the questionnaire via an
internet how to collect it to count data economically
in a short time.
Here, we construct Questionnaire Engine on web
presumed questionnaire answer via the internet for
questionnaire survey, collective and analysis.
WINSYS 2006 - INTERNATIONAL CONFERENCE ON WIRELESS INFORMATION NETWORKS AND SYSTEMS
116
As a preparation for set up on Web, we rent the free
server which can use CGI, and registers for DDNS
(Dynamic Domain Name Server) for reducing URL
because improve access easily (URL, 2006).
As a preparation for questionnaire counting, we
construct the engine that is able to input to the
spreadsheet software automatically by programming
it in HTML, and able to analyze by preparing a
calculation program. Moreover, we presume the
problem which is not input to the spreadsheet
software properly in the un answer and so on, take
measure to prepare dummy answer.
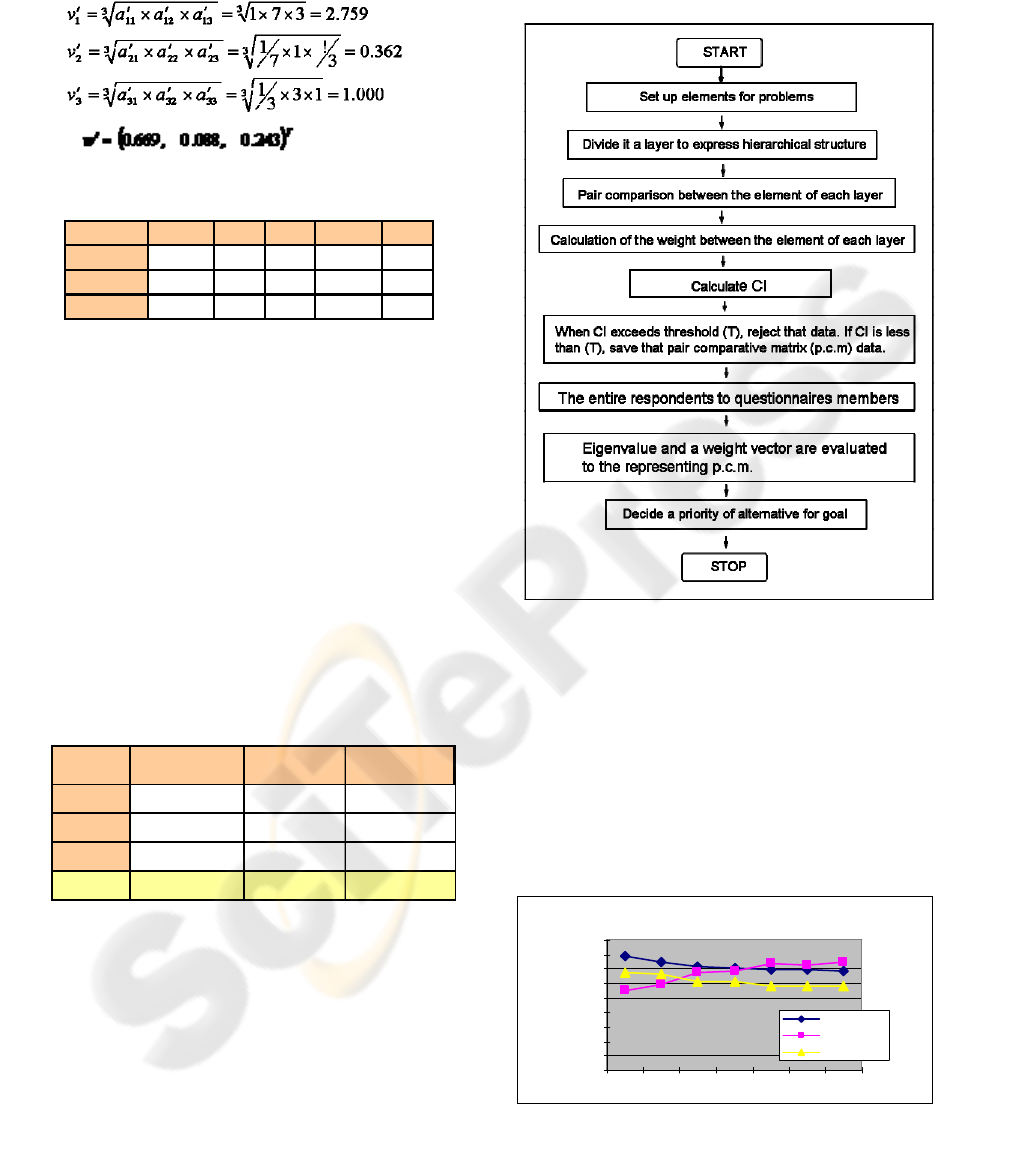
Importance measure for generate p.c.m. define as
follow Table 1.
Table 1: Intensity of the dissatisfaction and definition.
When an answer clicks on ‘absolute reliability’ on
the ‘spatial distribution’ side, input “7” to
spreadsheet software, and when clicks on ‘strong
reliability’ on the ‘traffic reduction’ side, input it
“1/5” (Figure 2).
We putted the engine to the test which included
movement confirmation before the questionnaire
survey actual take. Consequently, a wrong point did
not occur in the counting processing of the data
which it was afraid of, though respondent to a
questionnaire did not recognize hardly the difference
in valuation item which server constructing side
intends, rather than their contents of answer got
confusion (Consistency index was strangely high).
Therefore, we use much visual information in the
part of the question so that a respondent can
understand obvious (Figure 3). We made Waseda
university students as well as Fukagawa high school
'
'
'''
1
12
'' '
123
'
3
,( 1,2,3)
w
v
wwwi
vvv
w
⎛⎞
⎜⎟
==
⎜⎟
++
⎜⎟
⎝⎠
(6)
students reply to the questionnaire from December,
2005 to February, 2006 via the Internet. They can
fully utilize cellular communication system and used
to internet. We received a response rate of 95%
(valid response).
3.3 Individual User Analysis
It is noted if λ´
max
of preceding section 2.2 is n=3,
we are able to get λ´
max
to evaluate geometry mean
of element constituent A´ (Oguchi, 2006).A result of
a questionnaire applies in the Table 2.
Table 2: Respondent to a questionnaire example.
Criteria Usability Preference Reliability
Usability 1 7 3
Preference 1/7 1 1/3
Reliability 1/3 3 1
Usability Spatial Time Traffic
Spatial distribution 1 1/5 1/3
Time distribution 5 1 3
Traffic reduction 3 1/3 1
Preference Spatial Time Traffic
Spatial distribution 1 1/3 1/3
Time distribution 3 1 3
Traffic reduction 3 1/3 1
Reliability Spatial Time Traffic
Spatial distribution 1 1/3 3
Time distribution 3 1 5
Traffic reduction 1/3 1/5 1
Intensity of
relative importance
Definition
1 Equal dissatisfaction
3 Weak dissatisfaction
5 Strong dissatisfaction
7 Absolute dissatisfaction
Figure 3: Visual information.
Figure 2: Spreadsheet software input screen.
ANALYTIC HIERARCHY PROCESS AND ITS APPLICATION TO GRADE OF TRAFFIC SERVICE FOR
CELLULAR NETWORK
117
We calculated weight for solution of each
criteria.We applies weights of other criteria was
evaluated in the same way (Table 3).
Table 3: Result of evaluated each weight.
As in Table 3, this respondent to a questionnaire
feels weight with ‘usability’ in solutions, and feels
weight with ‘time distribution’ in each criteria. At
this time, maximum eigenvalue λ´
max
is given (4),
and CI is given (5). Result of evaluated CI illustrate
Table 4, regard this answer is consistency because
CI in each pair comparison is less than 0.1,Multiply
weight in the whole by in the weight to each criteria,
we find the priority of the solution finally. Multiply
0.105 which is weight of ‘usability’ for ‘spatial
distribution’ by 0.669 which is weight of criteria, we
find that 0.105 x 0.669=0.07. Result of evaluated all
elements, we find that upper 4 rows (Table 4). The
priority of the solution is given sum cols.
Consequently, we find this user feels most
dissatisfaction to waiting for the time.
Table 4: Priority.
3.4 Group Users Analysis
This section, we evaluate priority vector whole of
the user group in terms of result of an analysis user
individual. We use Gm. We consider about the
priority of the individual solution as follow
preceding section. It knows result of an analysis user
individual is selected by the CI with an AHP
analysis technique. Though, the group analysis
algorithm is not set up with AHP. Here, a CI is taken
with the threshold, and we propose in accordance
with the computational algorithm of the Figure 6.
Here that a change in that threshold, how influences
a priority vector.
Criteria Solution Spatial Time Reductio
n
CI
Usability 0.669 0.105 0.637 0.258 0.019
Preference 0.088 0.135 0.584 0.281 0.068
Reliabilit
y
0.243 0.258 0.637 0.105 0.019
Figure 4: Group decision making algorithm.
Step1: If it is not consistent with the questionnaire,
this CI is used as a threshold (T) though an
adjustment occasion CI grows big. In other words,
evaluate CI from the p.c.m. of the respondent to a
questionnaire, and when CI exceeds (T), reject that
data. If CI is less than (T), save that pair
comparative matrix data.
Spatial distribution Time distribution Traffic reduction
Usability
0.070 0.426 0.173
Prefer ence
0.012 0.051 0.025
Reliability
0.063 0.155 0.026
Priorit y
0.145 0.632 0.223
Step2: The entire respondents to questionnaires
members do a step 1.
Step3: element of the representing p.c.m. to
ij
a
CI and priority vector in conges tion assumption
under ticket reservation situation
0
0,05
0,1
0,15
0,2
0,25
0,3
0,35
0,4
0,45
0 0,05 0, 1 0,15 0,25 0, 3 1
CI
Priority vector (%)
Spatial distribution
Time distribution
Traffic reduction
Figure 5: CI and priority vector in congestion assumption
under a ticket reservation situation.
WINSYS 2006 - INTERNATIONAL CONFERENCE ON WIRELESS INFORMATION NETWORKS AND SYSTEMS
118
express the will of the group is given to it in the Gm
of the p.c.m.
ij
a
element of (is not reject) save in
the step 1-2. For example, when there are forty
people are not rejected, it is the Gm which consists
of forty elements.
Step4: Eigenvalue and a weight vector are evaluated
to the representing p.c.m. which it could get in the
step 3; we evaluate a priority vector as well as CI.
Here, CI of the horizontal shaft of each figure
illustrates a threshold. In other words, data exceed
threshold are rejected (We restrict group to the user
of under the threshold).
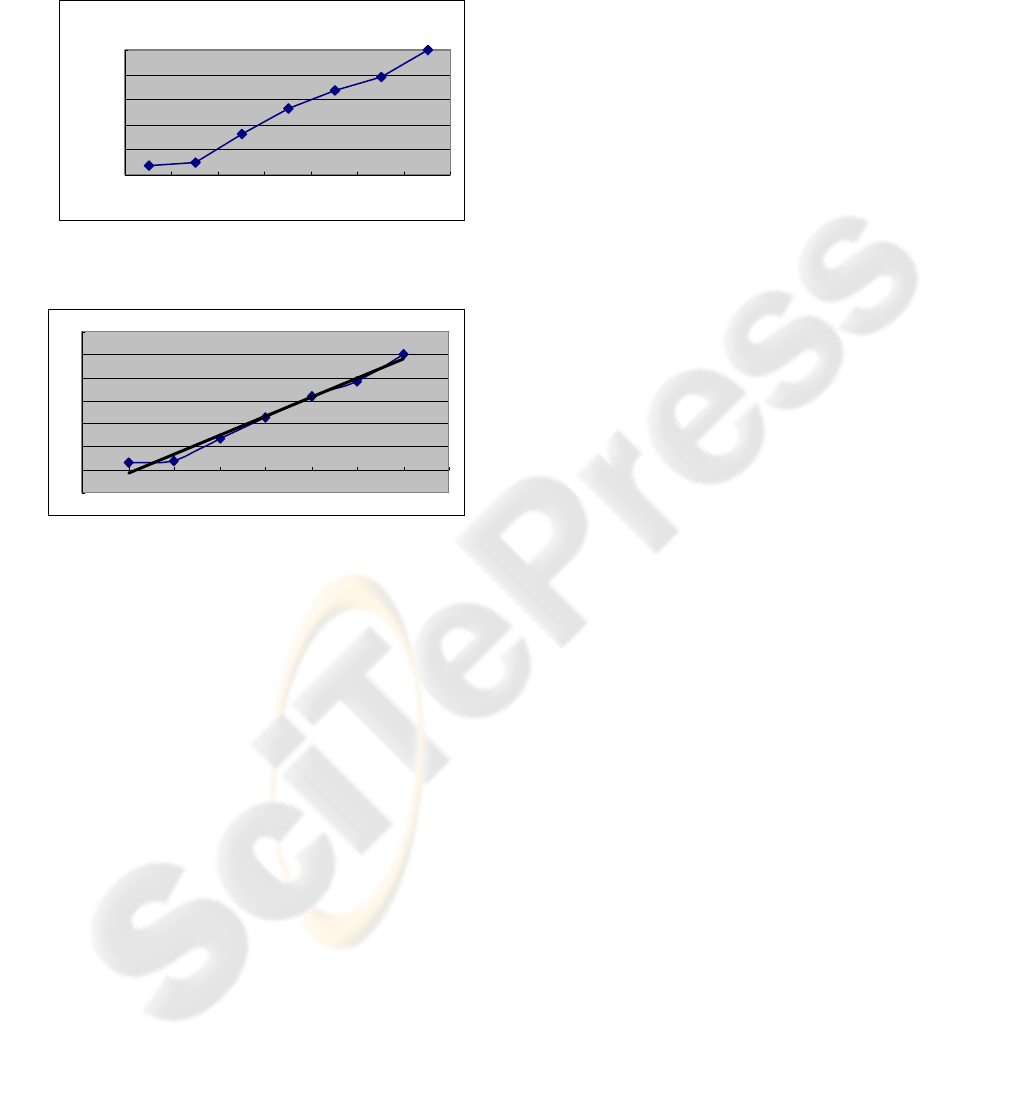
When an approximate straight line by the regression
line of the least squares was calculated, Y-intercept
became a minus at the case of this questionnaire
(Figure 7). In other words, when the threshold of CI
is made very small, it devotes that the population
which satisfies disappears. CI had better be big from
the viewpoint of the group. On the other hand, CI
had better be low from individual viewpoint (The
existence of the trade-off). From the above, we
propose that CI what took the priority of 0.1~0.15
(about 50% of the whole) is effective in group
decision making. When it tried how to control traffic
by the spatial distribution (spatial movement), time
distribution (time shift), and traffic reduction (other
media recommendation), many students feel
dissatisfaction with the spatial movement most, and
feel dissatisfaction few with the changing other
media recommendation traffic control, in this case.
4 CONCLUSION
We have set up a problem how a user thinks of
traffic control scenarios in cellular networks. We
have solved this problem applying the AHP
approach. We have firstly presented a visual
questionnaire on the web site by using the hyper text
mark-up language (HTML) so that the respondents
can answer easily and quickly. We have then
formulated a pair-wise comparison matrix (p.c.m.)
through this questionnaire result for an individual
respondent. We have subsequently calculated the
maximum eigenvalue of the p.c.m.. Through this
process, we have obtained all CI (consistency index)
values for all questionnaire respondents. We have
proposed a decision making technique for
questionnaire respondents group through these
individual CI values. Taking the geometric mean
of p.c.m. elements we have obtained the weighted
eigenvector for the maximum eigenvalue of this
geometric mean p.c.m., namely priority (user’s
dissatisfaction) vector. From the priority vector, we
have been able to see how well/badly these traffic
control scenarios operate. It is left as a future
research topic to analyze not only our traffic control
scenarios (spatial distribution, time distribution and
traffic reduction) but also other control scenarios in
cellular networks. It is also left as a future research
topic to investigate another decision making
technique since group decision is not yet unique in
the AHP approach (We have adapted the geometric
mean of p.c.m. elements for the questionnaire
respondents whose CI values are less than our
threshold).
REFERENCES
Akinaga, Y., Kaneda, S., Shinagawa, N., and Miura, A.,
2005. A proposal of mobile communication traffic
forecasting method using call characteristics and
environmental information. IEICE Technical Report,
vol. 105, no. 12, NS2005-6, pp. 21-24.
Ferguson, P., and Huston, G., 1998. Quality of Service.
John Willy & Sons, New York.
Hoshi, K. Web AHP questionnaire engine, 2006.
http://roo.to/question/ (2006/03/24) (in Japanese)
Kaneda, S., Akinaga, Y., Shinagawa, N., and Miura, A.,
2005. The 19
th
International Teletraffic Congress, in
Proc. 6a, pp.583-592, Traffic Control by Influencing
Users’ Behaviour in Mobile Networks.
CI (Thr prior it y vect or in congest ion assumpt ion
t icket reservat ion sit uation
0
20
40
60
80
100
05 0.1 0.15 0.25 0.3 1
CI
Priority vector (%)
eshold) and
under
0 0.
Figure 6: CI ( and priority vector in congestion
assumption under a ticket reservation situation.
Figure 7: CI ity vector in congestion assumption
under ticket re situation.
Threshold)
and prior
servation
y = 19.267
9808
-20
0
20
40
60
80
100
120
012345678
16.447x -
R
2
= 0.
ANALYTIC HIERARCHY PROCESS AND ITS APPLICATION TO GRADE OF TRAFFIC SERVICE FOR
CELLULAR NETWORK
119

Oguchi, K., Takahashi, Y., Hoshi, K., Kaneda, S., and
Akinaga, Y., 2006. User’s dissatisfaction performance
for mobile communication network: an AHP
approach.
Saaty, T.L., 1980. The Analytic Hierarchy Process.
McGraw-Hill, New York.
WINSYS 2006 - INTERNATIONAL CONFERENCE ON WIRELESS INFORMATION NETWORKS AND SYSTEMS
120
