
A COMPARISON OF WAVELET-BASED AND RIDGELET-
BASED TEXTURE CLASSIFICATION OF TISSUES IN
COMPUTED TOMOGRAPHY
Lindsay Semler and Lucia Dettori
Intelligent Multimedia Processing Laboratory
School of Computer Scienve, Telecommunications and Information Systems
DePaul University, Chicago IL, 60604, USA
Keywords: Multi-Resolution Analysis, Texture Classification, Wavelet, Ridgelet, Computed Tomography.
Abstract: The research presented in this article is aimed at developing an automated imaging system for classification
of tissues in medical images obtained from Computed Tomography (CT) scans. The article focuses on using
multi-resolution texture analysis, specifically: the Haar wavelet, Daubechies wavelet, Coiflet wavelet, and
the ridgelet. The algorithm consists of two steps: automatic extraction of the most discriminative texture
features of regions of interest and creation of a classifier that automatically identifies the various tissues.
The classification step is implemented using a cross-validation Classification and Regression Tree approach.
A comparison of wavelet-based and ridgelet-based algorithms is presented. Tests on a large set of chest and
abdomen CT images indicate that, among the three wavelet-based algorithms, the one using texture features
derived from the Haar wavelet transform clearly outperforms the one based on Daubechies and Coiflet
transform. The tests also show that the ridgelet-based algorithm is significantly more effective and that
texture features based on the ridgelet transform are better suited for texture classification in CT medical
images.
1 INTRODUCTION
The research presented in this article is part of an
ongoing project (Xu et al. 2005), (Channin et al.
2004), and (Semler, Dettori, & Furst 2005) aimed at
developing an automated imaging system for
classification of tissues in medical images obtained
by Computed Tomography (CT) scans.
Classification of human organs in CT scans using
shape or grey level information is particularly
challenging due to the changing shape of organs in a
stack of slices in 3D medical images and the grey
level intensity overlap in soft tissues. However,
healthy organs are expected to have a consistent
texture within tissues across multiple slices. This
research focuses on using multi-resolution texture
analysis for the classification of tissues from normal
chest and abdomen CT scans. The approach consists
of two steps: extraction of the most discriminative
texture features of regions of interest and creation of
a classifier that automatically identifies the various
tissues. Four forms of multi-resolution analysis were
carried on and texture features vectors were created
from image transformations based on: the Haar
wavelet, the Daubechies wavelet, the Coiflet
wavelet, and the ridgelet. The classification step is
implemented through a decision tree classifier based
on the cross-validation Classification and Regression
Tree (C&RT) approach. Multi-resolution analysis
has been successfully used in image processing, and
a number of applications to texture classification
have been proposed over the past few years. Several
studies have investigated the discriminating power
of wavelet-based features applied to various
domains, examples can be found in (Dara & Watsuji
2003) and (Mulcahy 1997). Recently, the finite
ridgelet transform has emerged as a new multi-
resolution analysis tool. Applications of ridgelet
transforms to image contrast enhancement and
image denoising have been developed in recent
years as in (Do, & Vetterli 2003), however, to the
authors’ knowledge, applications to texture
classification have only been investigated in the
context of natural images (LeBorgne & O’Connor
2005).
Texture is a commonly used feature in the analysis
and interpretation of images. It can be characterized
285
Semler L. and Dettori L. (2006).
A COMPARISON OF WAVELET-BASED AND RIDGELET- BASED TEXTURE CLASSIFICATION OF TISSUES IN COMPUTED TOMOGRAPHY.
In Proceedings of the First International Conference on Computer Vision Theory and Applications, pages 285-289
DOI: 10.5220/0001365702850289
Copyright
c
SciTePress

by a set of local statistical properties of the pixel
grey level intensity. Statistical, structural, or spectral
techniques commonly used are: wavelets, run-length
statistics, spectral measures, fractal dimensions,
statistical moments, and co-occurrence matrices.
The discrete wavelet transform decomposes the
image into several directional details obtaining low-
pass bands that capture horizontal, vertical and
diagonal activity. First and second order statistics of
the wavelet detail coefficients provide texture
descriptors that can discriminate contrasting
intensity properties spatially distributed throughout
the image, according to various levels of resolution.
Wavelets have been an area of research in many
texture classification applications and have been
useful in capturing texture information and edge
detection in natural images
(Li, Jun 2003), such as
detecting the vertical outline of a skyscraper.
However, they are not able to capture enough
directional information in noisy images, such as
medical CT scans.
A better approach to texture classification for this
type of images is to apply a ridgelet transform
instead of a Wavelet transform. Ridgelets, like
wavelets, capture directional information of an
image, however, they are not limited to vertical,
horizontal, and diagonal directions. Structural
information derived from the ridgelet transform of
an image is based on multiple radial directions in the
frequency domain. For ridgelets, first order statistics
can be calculated on the directional detail
coefficients, providing texture descriptors that can
be used in the classification of texture. Our tests
confirm that the multi-directional capabilities of the
ridgelet transform provide better texture information
and prove to be more effective in the texture
classification in medical images.
The article is organized as follows. Section 2
describes the data set, the wavelet and ridgelet
transforms and the texture feature extraction process.
The classification algorithm is detailed in Section 3.
Tests and a comparison of wavelet-based and
ridgelet-based features are presented in Section 4.
2 TEXTURE FEATURES
The texture classification algorithm proposed in this
article consists of four main steps: segmentation of
regions of interest (organs), application of the
discrete wavelet or ridgelet transform, extraction of
texture features, and creation of a classifier. In this
article, we analyze and compare texture
classification techniques based on four different
multi-resolution approaches: Haar (H) wavelet,
Daubechies 4 (D4) wavelet, Coiflet (C6) wavelet,
and the ridgelet.
A wavelet is a mathematical function that filters a
signal or an image with a series of averaging and
differencing calculations see for example (Mulcahy
1997). Wavelets are typically used in image
decomposition and compression. Wavelets can be
calculated according to various levels of resolution
(or blurring) depending on how many levels of
averages are calculated. They are sensitive to the
spatial distribution of grey level pixels, but are also
able to differentiate and preserve details at various
scales or resolutions.
The ridgelet transform is an application of a multi-
resolution wavelet to a radon transform. A radon
transform is able to provide directional information
in the frequency domain. Thus, ridgelets capture
several directions, in addition to the horizontal,
vertical and diagonal offered by the wavelet. The
ridgelet gives rotation invariant structural
information on multiple directions and scales.
2.1 The Data Set
The texture classification algorithms were tested on
3D data extracted from two normal chest and
abdomen CT studies from Northwestern Memorial
Hospital. The data consisted of 340 2D DICOM
consecutives slices, each slice being 512 x 512 and
having 12-bit grey level resolution. Using an Active
Contour Models (“Snake”) algorithm, five organs
were segmented from the initial data: heart, liver,
spleen, kidney, and backbone (Xu et al. 2005). The
segmentation process generated 140 Backbone
slices, 52 Heart, 58 Liver, 54 Kidney, and 40 Spleen.
Both wavelets and ridgelets are extremely
sensitive to contrast in the grey level intensity,
therefore, in order to use wavelet-based or ridgelet-
based texture description it was necessary to
eliminate all background pixels to avoid mistaking
the edge between the artificial background and the
organ as a texture feature. Each slice was therefore
further cropped, and only square sub-images fully
contained in the interior of the segmented area were
generated. These images were of sizes 31 x 31 (for
ridgelets) or 32 x 32 (for wavelets), resulting in
2,091 slices of “pure” single-organ tissue (363
Backbone, 446 Heart, 506 Liver, 411 Kidney, 364
Spleen). These images were cropped to the
respective size because of the requirements of an
image of size 2
n
for wavelets and a prime image size
for ridgelets.
VISAPP 2006 - IMAGE ANALYSIS
286
2.2 Feature Extraction
Once the medical images have been segmented, the
wavelet and ridgelet discrete transforms are applied.
Several texture features are then extracted from the
wavelet and ridgelet coefficients generated by these
transforms. First, the three different families of
wavelets were investigated to determine which
would yield a higher discriminating power. Haar,
Daubechies and Coiflet wavelet filters were applied
to each of the images, using two levels of resolution.
At each resolution level, three detail coefficient
matrices were calculated capturing the vertical,
horizontal and diagonal structures of the image.
The following first order statistics were
calculated on each of the directional matrices: Mean
and Standard Deviation. Also calculated from these
matrices were 4-directional co-occurrence matrices
on which the following second order statistics were
calculated: Energy, Entropy, Contrast,
Homogeneity Sum-mean, Variance, Maximum
Probability, Inverse Difference Moment, and Cluster
Tendency (Haralick, Shanmugame, & Dinstein
1973). This generated a 264-element texture
descriptor vector per image. To avoid problems of
overfitting for the decision trees the resulting feature
vector was reduced to 22 features (using only two
levels of resolution and averaging over wavelet
details and co-occurrence directions). Further details
on feature vector reduction and more in-depth
analysis of the various wavelet-based texture
features are provided in (Semler, Dettori, & Furst
2005).
The Finite Ridgelet Transform as presented in
(Do & Vetterli 2003), was also applied. This was
computed by: first calculating a discrete radon
transform, and then applying a one-dimensional
wavelet transform. The radon transform was
computed by: first calculating the 2-dimensional fast
Fourier transform of the image, and then applying a
1-dimensional inverse Fourier transform on each of
the 32 radial directions of the radon projection. A
one-dimensional Haar wavelet was applied to each
of the radial directions, for two levels of resolution.
The following texture descriptors were then
calculated for each radial direction and resolution
level of the wavelet details: mean, standard
deviation, energy and entropy. Entropy texture
descriptors were determined to yield the highest
discriminating power; further details are presented in
(Semler, Dettori & Kerr 2006). Several different
combinations of resolution levels were also
investigated, and two levels of resolution were
determined best for both ridgelets and wavelets. The
numbers of features extracted were limited since
each descriptor is calculated over two resolution
levels and for 32 directions, yielding 64 descriptors.
Although the ridgelet-based features contain
more descriptors, it should not be assumed they
would perform better than the wavelet-based
features because of the increase in number of
descriptors. In (Semler, Dettori, & Furst 2005), it
was found that a wavelet-based feature vector of 33
descriptors outperformed another same-family
wavelet-based feature vector of 99 descriptors.
3 TEXTURE CLASSIFICATION
The classification step was carried out using a
decision tree classifier based on the Classification
and Regression Tree (C&RT) approach (Channin et
al. 2004). A decision tree predicts the class of an
object (organ) from values of predictor variables
(texture descriptors). The most relevant texture
descriptors are found for each specific organ, and
based on those selected descriptors, a set of decision
rules are generated. These set of rules are then used
for the classification of the each region. Using the
C&RT cross-validation approach, each tree’s
parameter was optimized, including depth of tree,
number of parent nodes, and number of child nodes.
To evaluate the performance of each classifier,
specificity, sensitivity, precision, and accuracy rates
were calculated from each of the misclassification
matrices.
A misclassification matrix is a table that lists each
organ and its true positives, true negatives, false
positives and false negatives. The number of true
positives is the number of organs that are correctly
classified as that organ. The number of true
negatives is the number of other organs that are
correctly classified as other organs. The number of
false positives is the number of organs that are
incorrectly classified as that organ. The number of
false negatives is the number of organs that are
incorrectly classified as other organ. From the
misclassification matrix specificity, sensitivity,
precision, and accuracy statistics were computed.
Table 1: Measures of classification performance.
Measure Definition
Sensitivity True Positive / Total Positive
Specificity True Negative / Total Negatives
Precision True Positive / (True Positive + False Positives)
Accuracy (True Positives + True Negatives) / Total Sample
A COMPARISON OF WAVELET-BASED AND RIDGELET-BASED TEXTURE CLASSIFICATION OF TISSUES IN
COMPUTED TOMOGRAPHY
287

Specificity measures the accuracy among
positive instances, and is calculated by dividing the
true negatives by the number of all other organ
slices. Sensitivity measures the accuracy among
negative instances, and is calculated by dividing the
number of true positives by the total number of that
specific organ slices. Precision measures show how
consistent the results can be reproduced. Accuracy
reflects the overall correctness of the classifier, and
is calculated by adding the true positives and
negatives together and dividing by the entire number
of organ slices.
4 WAVELET - RIDGELET
COMPARISON
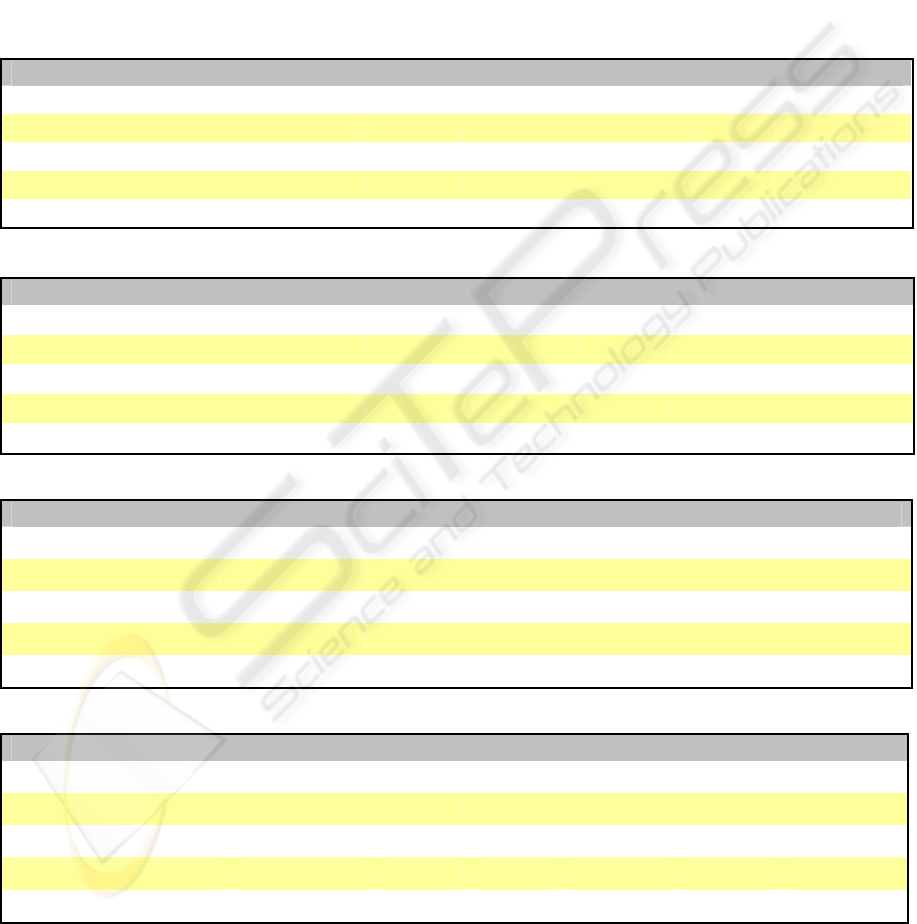
Tables 2-5 in the Appendix show a comparison of
accuracy, precision, specificity, and sensitivity
results, for each tissue of interest for the three
wavelet-based texture features and the ridgelet-based
texture features respectively. Within all the
wavelets, the Haar wavelet outperformed all others
for most organs and performance measures. The
only exception is the backbone, for which the
Daubechies and Coiflet wavelets produce slightly
better results. The performance for the Haar-based
descriptors in all other organs was significantly
higher, thus indicating that these descriptors yield
the highest discriminating power among the
wavelet-based features.
The results also show that the ridgelet-based
texture features outperform all wavelet-based
descriptors. Accuracy rates for Wavelet-based
texture descriptors range between 85 - 93%, while
ridgelet-based accuracy rates are in the 91 - 97%
range. Precision rates for the wavelets are between
55 - 91%, compared to 73 - 93% for ridgelets.
Specificity rates for the wavelets are in the 82-97%
range, while specificity for the ridgelet descriptors is
in the 92-98% range. Furthermore, sensitivity rates
for the wavelets are in the 35-87% range, whereas
ridgelets are between 72-94%. The lower bound of
the sensitivity range for wavelets is due to the poor
performance of those descriptors (especially Coiflets
and Daubechies) for Heart and Spleen. The texture
of the images for these two organs is quite similar
and the classifier often mistakes the two organs for
one another. Further investigation is needed to
determine the underlying cause for the poor
performance of the Heart and Spleen.
Overall, the ridgelet-based descriptors have
significantly higher performance measures, with
accuracy rates approximately four percent higher
than any other feature set for all individual organs.
This was expected due to the fact that the ridgelet
transform is able to capture multi-directional
features, as opposed to the wavelet transform which
focuses mainly on horizontal, vertical, and diagonal
features, which are not dominant in medical CT scan
images. One of the limitations of using ridgelet-
based descriptors is the fact that ridgelets are most
effective in detecting linear radial structures, which
are not the main component of medical images. A
recent extension of ridgelets is the curvelet
transform. Curvelets have been proven to be
particularly effective at detecting image activity
along curves instead of radial directions (Starck
Donoho & Candes 1999). We are currently
investigating the use of curvelet-based texture
descriptors and we expect this to further improve the
ability of our classifier to successfully classify each
tissue sample.
REFERENCES
Xu, D., Lee, J., Raicu, D.S., Furst, J.D., & Channin, D.
(2005). Texture Classification of Normal Tissues in
Computed Tomography. The 2005 Annual Meeting of
the Society for Computer Applications in Radiology.
Channin, D., Raicu, D.S., Furst, J.D., Xu, D.H., Lilly, L.,
& Limpsangsri, C. (2004). Classification of Tissues in
Computed Tomography using Decision Trees. Poster
and Demo. The 90
th
Scientific Assembly and Annual
Meeting of Radiology Society of North America.
Semler, L., Dettori, L., & Furst, J. (2005). Wavelet-Based
Texture Classification of Tissues in Computed
Tomography. Proceedings of the 18th IEEE
International Symposium on Computer-Based Medical
Systems, 265-270.
Do, M.N., & Vetterli, M. (2003) The Finite Ridgelet
Transform for Image Representation. IEEE
Transactions on Image Processing, 12, 16 - 28.
LeBorgne, H.L., & O’Connor, N. (2005). Natural Scene
Classification and Retrieval Using Ridgelet-based
Image Signatures. Advanced Concepts for Intelligent
Vision Systems, 20-23.
Starck, J.L., Donoho, D.L., & Candes, E.J. (1999).
Astronomical Image Representation by the Curvelet
Transform. Astronomy &Astrophysics, 398, 785-800.
Semler, L., Dettori, L., & Kerr, B. (2006). Ridgelet-Based
Texture Classification in Computed Tomography,
submitted to IEEE Computer Society Conference on
Computer Vision and Pattern Recognition.
Dara, B & Watsuji, N. (2003). Using Wavelets for Texture
Classification. IJCI Proceedings of International
Conference on Signal Processing, ISN 1304-2386.
VISAPP 2006 - IMAGE ANALYSIS
288
Mulcahy, C. (1997). Image Compression Using the Haar
Wavelet Transform. Spelman Science & Math
Journal, 1, 22-31.
Li, Jun. (2003). A Wavelet Approach to Edge Detection,
Master of Science thesis, Sam Houston State
University. Huntsville, Texas.
Do, M., & Vetterli, M. (2003). Image Denoising Using
Orthonormal Finite Ridgelet Transform. Proceedings
of SPIE: Wavelet Applications in Signal and Image
Processing, 4119, 831-842.
Haralick, R. M., Shanmugam, D., & Dinstein, I. (1973).
Texture Features for Image Classification. IEEE
Transactions on Systems, Man, and Cybernetics, 3, 6,
610 – 621.
APPENDIX
Table 2: Wavelet-Ridgelet accuracy rates comparison.
Accuracy
Feature Set Backbone Heart Liver Kidney Spleen Average
Haar 93.7 85.0 88.6 92.8 89.5 89.9
Daubechies 93.6 84.0 88.0 83.6 88.2 87.5
Coiflets 93.1 85.3 88.3 85.8 88.6 88.2
Ridgelet 97.3 93.6 92.7 92.7 91.7 93.6
Table 3: Wavelet-Ridgelet precision rates comparison.
Precision
Feature Set Backbone Heart Liver Kidney Spleen Average
Haar 82.6 67.0 69.9 82.6 69.7 74.4
Daubechies 91.6 57.4 55.7 64.9 64.3 66.8
Coiflets 90.7 58.9 56.7 70.6 70.8 69.5
Ridgelet 93.5 90.8 79.4 88.5 72.9 85.0
Table 4: Wavelet-Ridgelet specificity rates comparison.
Specificity
Feature Set Backbone Heart Liver Kidney Spleen Average
Haar 96.1 92.1 91.4 94.4 94.3 93.7
Daubechies 97.3 91.8 92.0 82.9 96.2 92.0
Coiflets 96.8 89.4 92.2 87.4 97.6 92.7
Ridgelet 98.7 97.9 92.3 97.67 93.4 96.0
Table 5: Wavelet-Ridgelet sensitivity rates comparison.
Sensitivity
Feature Set Backbone Heart Liver Kidney Spleen Average
Haar 82.6 59.0 77.7 87.3 65.5 74.4
Daubechies 83.5 49.1 63.2 85.4 40.2 64.2
Coiflets 85.9 67.1 64.3 81.6 35.2 66.8
Ridgelet 90.9 77.8 94.2 72.5 83.8 83.8
A COMPARISON OF WAVELET-BASED AND RIDGELET-BASED TEXTURE CLASSIFICATION OF TISSUES IN
COMPUTED TOMOGRAPHY
289
