
GROWING AGGREGATION ALGORITHM FOR DENSE TWO-
FRAME STEREO CORRESPONDENCE
Elisabetta Binaghi, Ignazio Gallo , Chiara Fornasier, Mario Raspanti
Universita' degli Studi dell'Insubria, Varese, Italy
Keywords: stereo, occlusion, disparity space, neural networks.
Abstract: This work aims at defining a new method for matching correspondences in stereoscopic image analysis. The
salient aspects of the method are -an explicit representation of occlusions driving the overall matching
process and the use of neural adaptive technique in disparity computation. In particular, based on the
taxonomy proposed by Scharstein and Szelinsky, the dense stereo matching process has been divided into
three tasks: matching cost computation, aggregation of local evidence and computation of disparity values.
Within the second phase a new strategy has been introduced in an attempt to improve reliability in
computing disparity. An experiment was conducted to evaluate the solutions proposed. The experiment is
based on an analysis of test images including data with a ground truth disparity map.
1 INTRODUCTION
The reconstruction of three-dimensional shape from
two or more images is a well known and intensively
investigated research problem within the Computer
Vision community (Barnard and Fischler 1982;
Barnard and Thompson W 1980; Dhond and
Aggarwal 1989).
Major efforts have been devoted to the stereo
matching sub-task aimed at computing
correspondences in two (or more) images for
obtaining dense depth maps. A substantial amount of
work has been done on stereo matching giving rise
to a variety of novel approaches (Scharstein and
Szelisky, 2002) attempting to improve upon existing
early methods (Hannah, 1989) and satisfy the high
accuracy demand in diversified application domains
such as object recognition, robotics and virtual
reality (McMillan and Bishop 1995).
Despite important achievements, the accuracy of
most innovative stereo techniques may not be
adequate especially in those situations where even
isolated errors in the depth map create visible
undesirable artefacts. The problem originates from
the fact that most stereo algorithms ignore
occlusions analysis or address it in a post processing
stage within a more general smoothing task (Bobik
and Intille 1999).
Occlusions are widespread in stereo imagery and
even when images with small disparity jumps are
processed, they drastically affect the accuracy of the
overall reconstruction process being the major
source of errors.
Recent works on stereo matching stem from the
idea of mimicking the human visual system which
uses occlusions to reason about the spatial
relationships between objects during binocular
stereopsis. Explicit representation of occlusions and
direct processing within occlusion edges
characterizes these approaches (Bobik and Intille
1999).
This paper proposes a novel algorithm for
solving stereo correspondence based on an explicit
representation of occlusions driving the overall
matching process. In particular, based on the
taxonomy proposed by Scharstein and Szelinsky, the
dense stereo matching process has been divided into
three tasks: matching cost computation, aggregation
of local evidence and computation of disparity
values (Scharstein and Szelisky, 2002) . Within the
second phase a new strategy has been introduced in
an attempt to improve reliability in computing
disparity. An experiment was conducted to evaluate
the solution proposed. The experiment is based on
the analysis of test images including data with a
ground truth disparity map and makes use of the
quality metrics proposed by Scharstein and
Szelinsky (Scharstein and Szelisky, 2002).
326
Binaghi E., Gallo I., Fornasier C. and Raspanti M. (2006).
GROWING AGGREGATION ALGORITHM FOR DENSE TWO-FRAME STEREO CORRESPONDENCE.
In Proceedings of the First International Conference on Computer Vision Theory and Applications, pages 326-332
DOI: 10.5220/0001362203260332
Copyright
c
SciTePress
2 REPRESENTATION
This section describes a data structure called
Disparity Space Image, or DSI, already introduced
in previous works (Okutomi and Kanade 1994;
Bobik and Intille 1999). The DSI is an explicit
representation of matching space and plays an
essential role in the development of the overall
matching algorithm which makes use of occlusion
constraints.
The correspondence between pixel
()
rr
yx ,
in a
Reference Image
r
f
and a pixel
()
mm
yx ,
in a
Matching Image
m
f
is defined as
()
[]
()
rrrrrrm
rrr
yxyyxdsxf
yxf
,,,
),(
η
+⋅+
=
(1)
where
1±=s
is a sign chosen so that disparities
are always positive;
(
)
r
,y
r
xd
is the disparity function
and
(
)
r
,y
r
x
η
is the Gaussian white noise.
From equation (1) we obtain
()
rrrm
yxdsxx ,⋅+=
(2)
and from equation (2):
()( )
rmrr
xxsyxd −⋅=,
(3)
Introducing the epipolar constraint, we also
have:
mr
yy =
(4)
supposing the pixels move from right to left.
Once the disparity space has been specified, the
concept of DSI can be introduced and defined as any
image or function over the disparity space
),,( dyx
rr
. Values of DSI usually represent the cost
of a particular match implied by the particular
(
)
x,yd
considered.
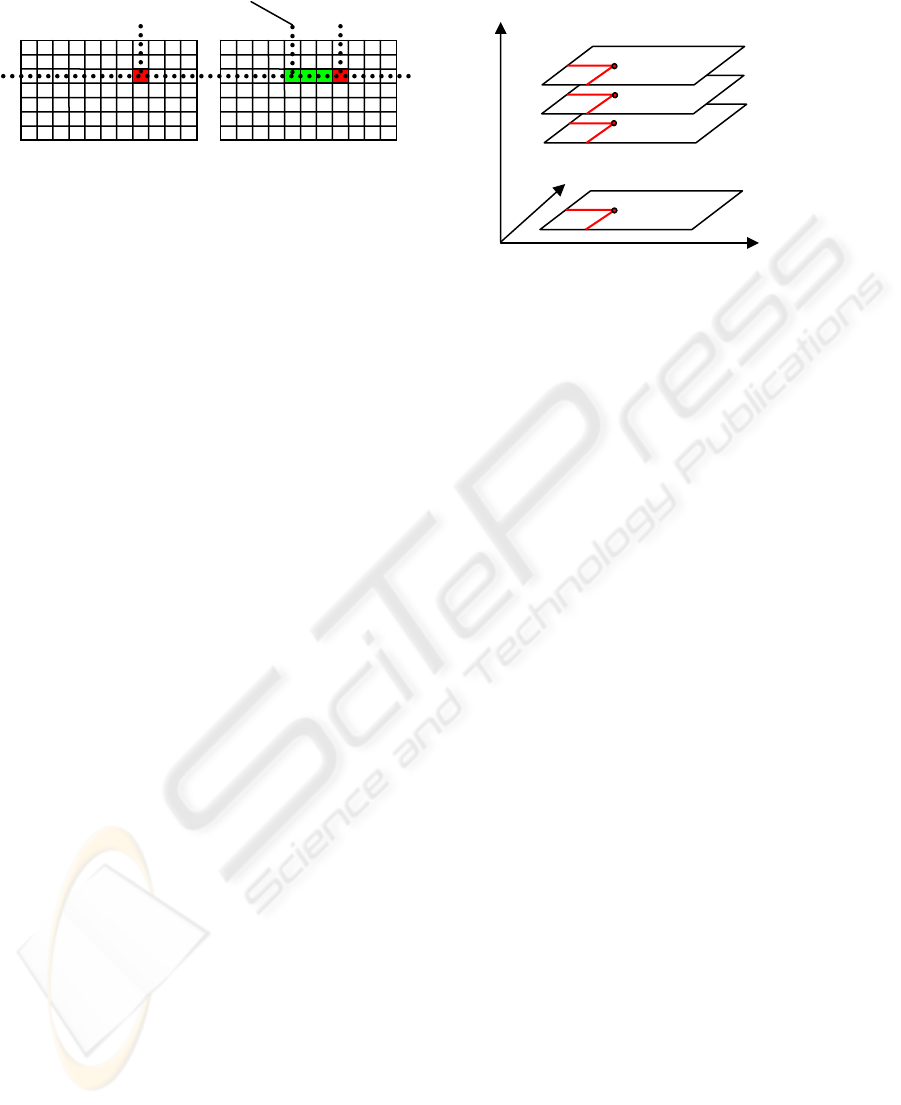
Figure 2 shows a graphic representation of DSI:
each slice indicates a level of disparity varying from
0 to a value
max
d
representing the maximum
disparity for the pair of images considered.
3 GROWING TEMPLATE
ALGORITHM
According to the taxonomy proposed by Scharstein
and Szelinsky, the dense stereo matching process
can be divided into four tasks (Scharstein and
Szelisky, 2002):
1) Matching Cost Computation
2) Aggregation Cost
3) Disparity Computation and Optimization
4) Disparity Refinement
Many dense stereo matching methods have
presented several different solutions to one or more
of these tasks. The most common matching costs
include squared intensity differences (SD) and
absolute intensity differences (AD) (Cox et al., 1996;
Scharstein and Szelisky, 2002).
The actual sequence of steps in the overall
matching procedure depends on the matching
Figure 1: Correspondence between a pixel
()
rr
yx ,
in
reference image
r
f
and a pixel
()
rm
yx ,
in matching
image
m
f
The difference
()
rm
xxd −=
is the disparity
value.
d
x
x
r
m
+=
r
x
r
x
r
y
r
f
m
f
x
r
Disparity = d
max
-1
Disparity = 0
y
r
d
Disparity = d
max
-2
Figure 2: Graphic Representation of Disparity
Space Image (DSI).
GROWING AGGREGATION ALGORITHM FOR DENSE TWO-FRAME STEREO CORRESPONDENCE
327

algorithm and in particular, on its local or global
nature.
Our approach, which follows a local strategy,
extends the conventional Aggregation Cost phase
including two novel sub-tasks:
2.1) Growing Raw Cost
2.2) Growing Aggregation Cost
3.1 Matching Cost Computation
Assuming the use of SD as matching function, by
equation (3) the matching cost computed for a pixel
()
rr
yx ,
is defined as:
()()()
[]
2
,,,,
rmmrrrrr
yxfyxfdyxDSI −=
(5)
where d is the disparity associated with the pixel
()
rr
yx ,
and
max
0 dd ≤≤
.
3.2 Aggregation Cost
Local and window-based methods aggregate the
matching cost by summing or averaging over a
support region in the DSI. The support region we
use is a two-dimensional squared window of a fixed
dimension.
In particular, this second step is performed by
summing the calculated matching costs over a
squared window with constant disparity
d
. The
aggregation cost
d
ji
AC
,
is defined as:
()
∑∑
+
=
+
=
=
Wa
am
Wb
bn
d
ji
dnmDSIAC ,,
,
(6)
where
⎟
⎠
⎞
⎜
⎝
⎛
−=
2
W
ia
and
⎟
⎠
⎞
⎜
⎝
⎛
−=
2
W
jb
.
Considering all the aggregation values obtained
varying the disparity in the range
[]
max
0 dΚ
, we
obtain:
[]
max
,
1
,
0
,
,
,...,
d
nmnmnm
nm
ACACACAC =
(7)
A classic Stereo Matching Algorithm, at this
point, with a Winner Take All (WTA) technique for
example, decides that the disparity is computed by
selecting the minimal aggregated cost in
nm
AC
,
. The
Growing Template Algorithm adds two new steps at
the aggregation cost phase.
We now describe the two parts that characterize
the Growing Template Aggregation Cost step.
3.3 Growing Raw Cost
Unlike conventional techniques that base further
steps of matching algorithm on the minimal
aggregated cost computed in
nm
AC
,
, our approach
bases decisions on all the costs obtained. To this
purpose, we introduce a new quantity
nm
RC
,
defined
as
[
]
max
,
1
,
0
,
,
,...,,
d
nmnmnm
nm
RCRCRCRC =
(8)
where each element indicates the position in the
sorted list of the element
d
ji
AC
,
.
For example, if we have the vector
[
]
16,1,12
,
=
nm
AC
the corresponding vector of raw
cost is
[
]
3,1,2
,
=
nm
RC
.
At the end of this phase for every pixel of
coordinates
(
)
nm,
in the reference image we have
associated the
nm
RC
,
calculated.
3.4 Growing Aggregation Cost
This sub-task calculates the number of confirmations
in a given support window for a given cost l.
Formally, from equation (8) we obtain the vector:
[
]
max
,
1
,
0
,
,
,...,,
d
nmnmnm
nm
GAGAGAGA =
(9)
where
(
)
()
∑
×∈
≤=
WWnm
d
nm
d
nm
lRCGA
,
,,
(10)
The salient aspect of our strategy is that of
integrating contextual confirmation within the
matching cost aggregation phase. The aggregation
can be performed based on different cost values
varying the l parameter in equation 10.
Figure 3 compares DSI’s slices for fixed y
obtained by means of a matching algorithm which
uses SD matching cost within conventional AC
computation performed with support window W=5
(a) and our algorithm which includes the GA task
performed with the following parameters(c):
growing aggregation window GW=25 and l=1.
VISAPP 2006 - MOTION, TRACKING AND STEREO VISION
328
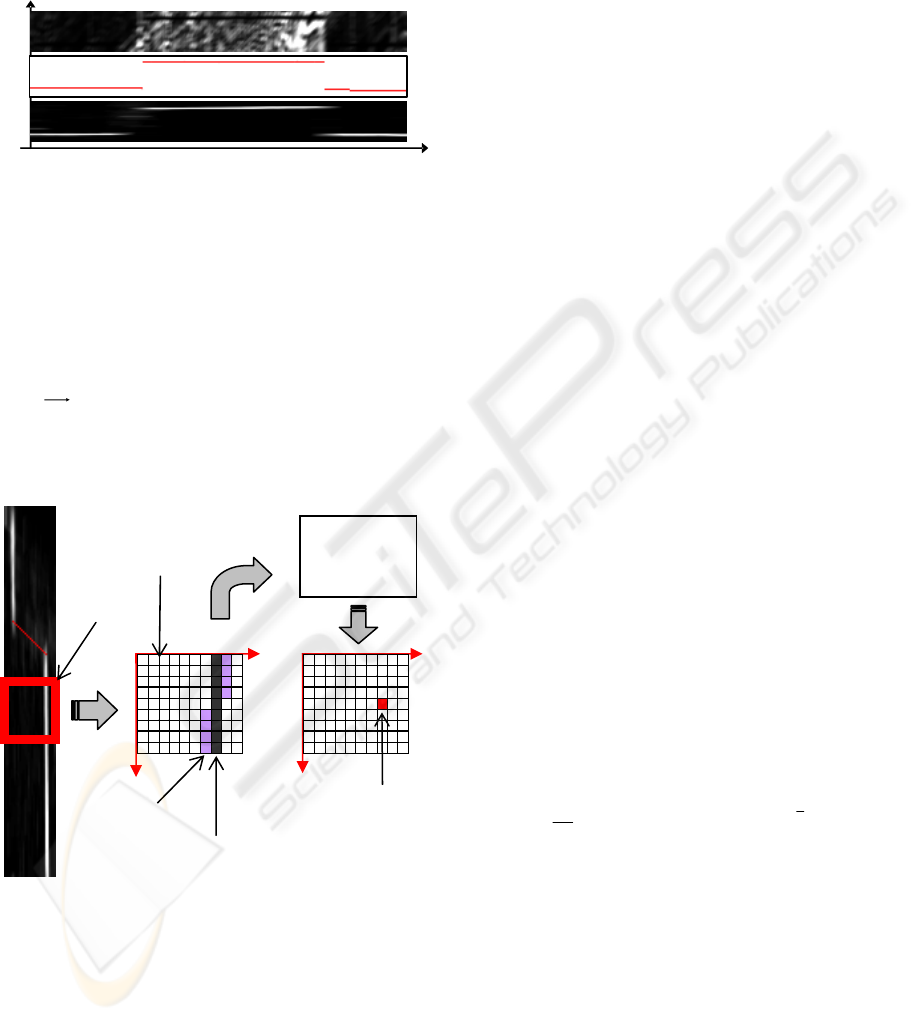
Both figures 3a and 3c highlight bands (dark
lines and white lines respectively) indicating regions
that match at a given disparity. They are more
visible in figure 3c depicting disparity and occlusion
situations without ambiguity.
3.5 Disparity Computation
The next phase in the matching algorithm consists in
the computation of the disparity map by selecting
the
nm
GA
,
components which satisfy a given
criterion. Adopting a WTA strategy, the disparity
associated with the minimum cost value is selected
at each pixel.
The present work tested an adaptive strategy
based on neural networks for disparity computation
(Rumelhart et al. 1986; Pao, 1989). A Multilayer
Perceptron neural model was adopted to compute the
disparity based on specific local information
extracted from the DSI slice.
The network is trained receiving input data from
the DSI slices. In particular, at each position of a
moving window over the DSI slice, an input pattern
is extracted and presented to the network. A training
example is constituted by a pair of elements (a,b)
where a is the input pattern collecting a set
{}
i
d
and
b corresponding disparity extracted from ground
truth image for each x within the moving window.
(Figure 4).
4 EXPERIMENTS
The experiments illustrated in this section addressed
the following questions:
• how did the performance depend upon their main
parameters and upon the neural refinement
stage?
• how did the Growing Template Algorithm
compare with other matching approaches?
The overall experimental activity was supported
by tools and test data available within the
implementation framework proposed by Scharstein
& Szelinski in their paper (Scharstein and Szelisky,
2002) and made available on the Web at
www.middlebury.edu/stereo. We included our stereo
correspondence algorithm in this framework, and
applied it to the test data available.
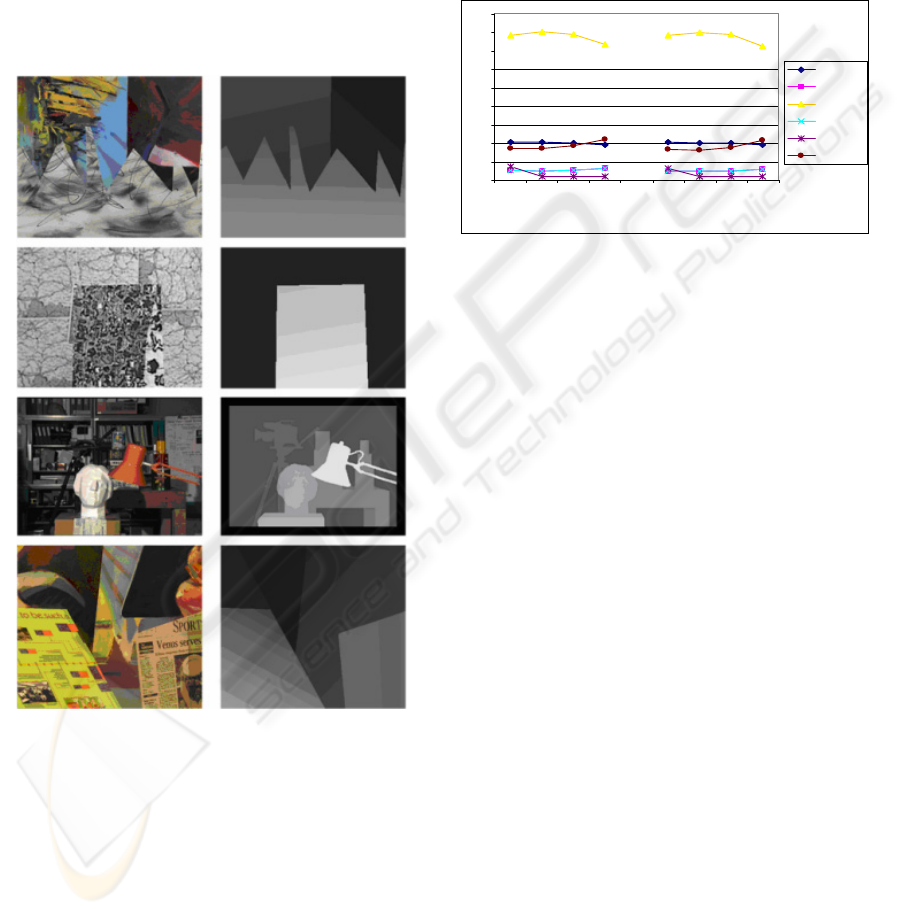
Four stereo image pairs with different types of
content are used to evaluate the performances of the
proposed algorithm (see Figure 5).
Among the quality measures available within the
framework, we adopted the RMS (root mean
squared) error (measured in disparity units) between
the computed disparity map
),( yxd
C
and the ground
truth map
),( yxd
T
2
1
2
)|),(),((|
1
(
∑
−= yxdyxd
N
R
TC
(12)
These measures are intended computed over the
whole image and five different kinds of regions in
the whole image:
y textureless regions (TEXTRD): regions where
the squared horizontal intensity gradient
averaged over a square window of a given size
(suggested value 3) is below a given threshold
(suggested value 4.0)
y textured regions (TEXTRLS): regions
complementary to the textureless regions
(c)
x
d
(a)
Figure 3: DSI’s slices obtained from the traditional AC
values for each pixel of line 100 (a), and obtained from
the GA on the same line (c). Slice (b) represents
correct dis
p
arit
y
information for line 100
(b)
Trained
Neural
Network
d
d
1
or winner= maximum value
d
2
or second
x
moving
window
input values
selection
d
x
d
x
computed
disparity
Figure 4 –Disparity computation procedure based on a
trained neural network. The process extracts patterns
from a window positioned over a DSI slice. For each x
we select two values: d
1
and d
2
. The trained neural
network calculates the disparity associated with the
center of the moving window.
GROWING AGGREGATION ALGORITHM FOR DENSE TWO-FRAME STEREO CORRESPONDENCE
329
y occluded regions (OCCL): regions that are
occluded in the matching image
y non occluded regions (NONOCCL): regions
complementary to the occluded regions
y depth discontinuity regions (DISC): pixels
whose neighboring disparity differs by more
than a given threshold (suggested value 2.0),
dilated by a window of a given width (suggested
value 9)
These regions are computed by pre-processing
reference images and ground truth disparity maps
yielding binary segmentation.
4.1 Sensitivity Analysis
We attempted to evaluate the effects of
systematically varying some of the key parameters
of our stereo algorithm to find an optimal setting for
all situations. Experiments were developed using SD
and AD matching costs and windows of size 7, 15,
21, 35 for Growing Aggregation Cost.
Results obtained demonstrate that performances
are not strongly influenced by the type of matching
costs used. A large window can help for occlusion
regions. Inversely, small windows perform better on
discontinuity regions.
Dimensions of 35X35 were selected allotting the
task of optimizing the balance between high
accuracy in occlusion and discontinuity regions to
the neural adaptive stage.
4.2 Performance Evaluation and
Comparison Analysis
At first the evaluation procedure aimed to identify
and evaluate the contribution of neural refinement
within the global matching algorithm. To this
purpose we compared the Growing Aggregation
Algorithm including the neural stage with the same
version including the WTA strategy for disparity
computation. The evaluation was based on the
monochromatic MAP pair of images. Training data
for the neural stage has been selected from the Map
image in a measure of 10% of global pixels.
As shown in Table 1, the algorithm GA presents
a competitive behaviour. However its principal merit
consists in preparing ideal conditions for the
subsequent neural stage as demonstrated by the fact
that the algorithm with neural refinement (GA+N)
strongly prevails in all regions considered.
We compared performances obtained by means
of the Growing Aggregation Algorithm including
neural refinement with those obtained by running
four algorithms implemented within the cited
framework available, selected among those with
better performances (Table 2).
Figure 5: Left image and ground truth disparity
ma
p
s of test set.
RM S
0
2
4
6
8
10
12
14
16
18
7 15 21 35 7 15 21 35
w indow size
ALL
N_OCCL
OCCL
TEXTRD
TEXTRLS
DISC
SD AD
Figure 6: Sensitivity Analysis of Growing
Aggregation Algorithm.
VISAPP 2006 - MOTION, TRACKING AND STEREO VISION
330
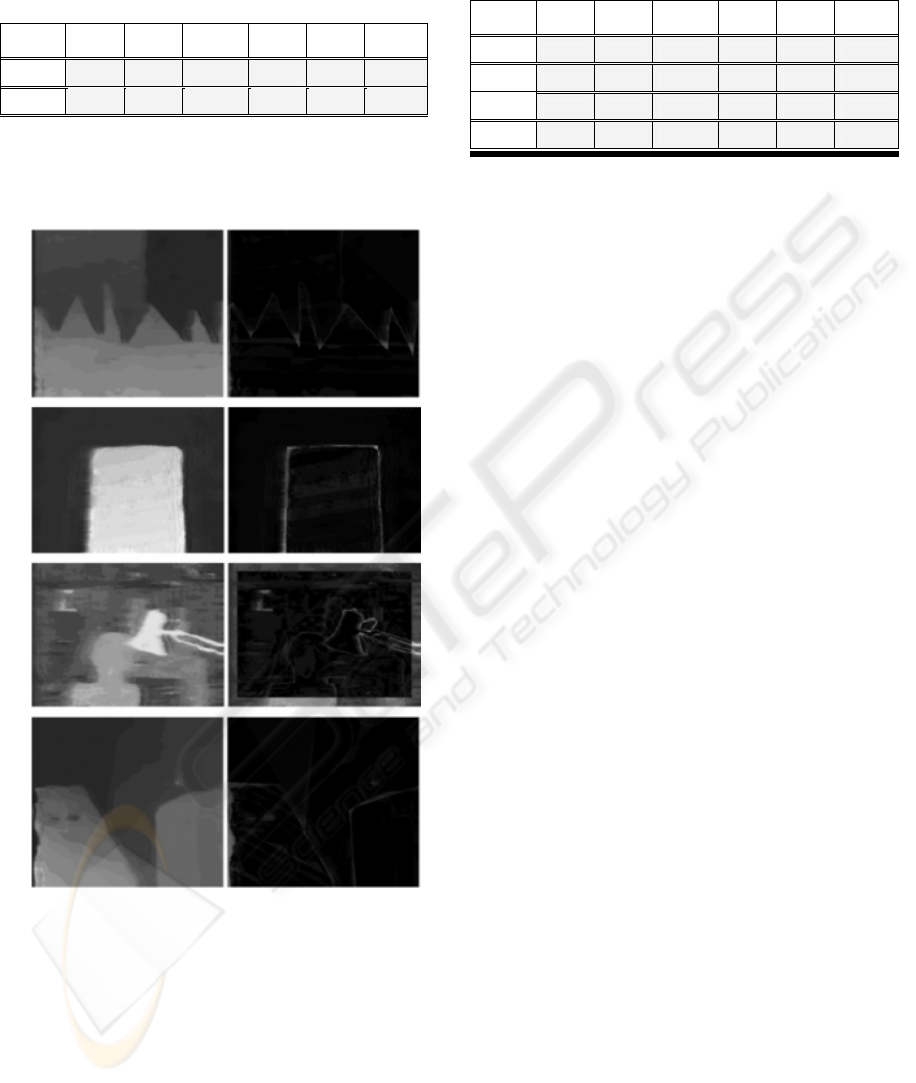
Table 1: Results obtained with MAP image. GA=Growing
Aggregation, GA+N=Growing Aggregation+ Neural
Network for disparity computation.
ALL
NON
OCCL
OCCL
TEXT
RD
TEXT
RLS
DISC
GA
3.85 1.31 14.88 1.32 0.40 4.69
GA+N
1.66 1.42 3.82 1.42 0.72 4.86
Figure 6 shows final disparity maps obtained by
processing the four stereo image pairs considered.
Table 2: Results obtained with MAP image. DP= Dynamic
Programming, SSD=Sum of Squared Difference,
SO=Scanline Optimization, BD=Bayesian Diffusion.
ALL
NON
OCCL
OCCL
TEXT
RD
TEXT
RLS
DISC
DP
3.15 2.98 5.21 2.99 1.75 5.86
SSD
3.92 1.66 14.65 1.67 0.44 6.07
SO
4.39 2.02 16.09 2.02 2.57 5.25
BD
4.66 0.93 18.74 0.94 0.43 2.95
5 CONCLUSIONS
Our objective in this study was to investigate the
potentialities of a new method aimed at solving
correspondence problem within a two-frame area
matching approach and producing dense disparity
maps.
The strategy was tested on standard data sets
available on the Web. As seen in this experimental
context the allied use of the growing aggregation
strategy and neural adaptive techniques benefits the
matching in general and in particular in occluded
regions. The use of adapting techniques allow to
process raw data directly extracted from DSI slices
without formalizing explicitly the information useful
for handling occlusions. The trained network
encodes the knowledge about occlusions and
efficiently uses it in generalization.
We consider this study preliminary to further
investigation involving both methodological and
experimental issues.In particular, the present
solutions must be reinforced implementing an
operative strategy for training neural network;
strategies will be integrated in an attempt of
improving generalization in such a way that trained
networks could be reliably applied to different kind
of images never seen during the training stage .
Further experiments dealing with Scanning
Electron Microscopy imagery are planned.
REFERENCES
Barnard, S.T. and Fischler, M.A. 1982.Computational
Stereo. ACM Computing Surveys, 14(4):553-572.
Barnard, T. and Thompson W.B. 1980. Disparity
Analysis of Images. IEEE Trans. PAMI :333-340.
Bishop, C.M.1995. Neural Networks for Pattern
Recognition, Oxford University Press, Oxford.
Bobik, A. F and Intille, S. S.. 1999. Large occlusion
stereo. International Journal on Computer Vision, 33,
181-200.
Figure 6: Final disparity maps and difference
images.
GROWING AGGREGATION ALGORITHM FOR DENSE TWO-FRAME STEREO CORRESPONDENCE
331

Cox, J.I., S.L. Higonani, S.P. Rao, B.M. Maggs. 1996. A
Maximum Likelihoods Stereo Algorithm. Computer
Vision and Image Understanding, 63, 542-567.
Dhond, U.R. and Aggarwal, J.K. 1989. Structure from
Stereo – a review. IEEE Trans. On Systems, Man, and
Cybernetics, 19, 1489-1510.
Hannah, M.J. 1989. A system for digital stereo
image matching. Photogrammetric Engineering
and Remote Sensing, 55, 1765-1770.
McMillan, L. and Bishop, G. 1995. Plenoptic
modelling:An image-based rendering system.
Computer Graphics (SIG-GRAPH’95), 39-46.
Kanade, T.and Okutomi, M. 1994. A Stereo Matching
Algorithm with an Adaptive Window: Theory and
Experiment. IEEE Trans. on PAMI, 16(9), 920-932.
Pao, Y.H..1989. Adaptive Pattern Recognition and
Neural Networks. Addison Wesley, MA.
Rumelhart, H., G.E.Hinton, and R.J.Williams. 1986.
Learning Internal Representation by Error
Propagation, in Rumelhart H., McClelland J.L.(eds.),
Parallel Distributed Processing, 318-362. MIT Press,
Cambridge, MA.
Scharstein, D. and Szeliski R. 2002. A Taxonomy and
Evaluation of Dense Two-Frame Stereo
Correspondence Algorithms. International Journal of
Computer Vision, 47, 7-42.
VISAPP 2006 - MOTION, TRACKING AND STEREO VISION
332
