
PEOPLE COUNTING SYSTEM
Raul Feitosa, Priscila Dias
Departamento de Engenharia Elétrica, Pontifícia Universidade Católica
Rua Marquês de São Vicente, 225, Gávea, CEP: 22453-900, Rio de Janeiro – RJ, Brazil
Keywords: Computer Vision, Security and Surveillance Systems, People Counting, Suspicious Attitudes Detection.
Abstract:
Demand for security and surveillance systems is getting bigger day after day. This work proposes a method
that counts people and detects suspicious attitudes via video sequences of areas with moderate people
access. A typical application is the security of warehouses during the night, on weekends or at any time
when people access is allowed but no load movement is admissible. Specifically it focuses on detecting
when a person passing by the environment carries any object belonging to the background away or leaves
any object in the background, while only people movement is allowed in the area. In addition, it estimates
the number of people on scene. The method consists of performing four main tasks on video sequences: a)
background and foreground separation, b) background estimative dynamic update, c) people location and
counting, and d) suspicious attitudes detection. The proposed background and foreground separation and
background estimative update algorithms deal with illumination fluctuation and shade effects. People
location and counting explores colour information and motion coherence. A prototype implementing the
proposed method was built for evaluation purpose. Experiments on simulated and real video sequences are
reported showing the effectiveness of the proposed approach.
1 INTRODUCTION
There is an increasing concern about security issues
worldwide. A great deal of effort has been made in
order to provide automatic systems able to detect
suspicious activities. This work proposes an
automatic method to estimate the number of people
moving in an area monitored by a video camera, as
well as to detect image changes, which are
potentially due to undesired actions. A system
implementing the proposed method would be
primarily applied to enforce security in areas, such
as warehouses.
Due to its ability to count people on an image,
the method can be applied in several applications,
such as layout arrangement, elevator access control,
light or temperature control and others.
This method must cope with the following
requirements: a) dynamic background update, b)
permanent background changes, c) illumination
variation, d) noise, e) shade effects, f) groups and g)
partial occlusions. In addition, the method should
also tolerate people passing in front of the camera as
well as some deformation in the shape seen by the
camera due to bending, sitting down or standing up.
Solutions meeting these requirements are
proposed in the literature, but no one deals with all
of them together. The systems described in (Shio) do
not handle items d) and e), Piau and Ranganath
(Piau) do not handle items b) and g) and Lu and Tan
(Lu) fail to meet items a), b), c) and g). Rossi
(Rossi) consider topics a) and b) and Wren (Wren),
e) and g), but, in the same way as in (Atsushi), they
consider only isolated person situations. Cai et all.
(Cai) treat only item a) while Kettnaker and Zabi
(Kettnaker), only items e) and f). Roh (Roh) deals
with groups (f), but not with further aspects.
Ramanan (Ramanan) treats only occlusions (g).
Finally, works reported in (Haritaoglu) and
(Wojtaszek) deal with all aspects, except for item e).
This paper is organized in three sections besides
the introduction. Section 2 describes the method in
details. Experimental results are shown in section 3.
Finally, section 4 presents the conclusions.
2 THE SYSTEM
The task of counting people and detecting objects
changes in a background is performed in this
method by the following sequential steps: image
442
Feitosa R. and Dias P. (2006).
PEOPLE COUNTING SYSTEM.
In Proceedings of the First International Conference on Computer Vision Theory and Applications, pages 442-448
DOI: 10.5220/0001361504420448
Copyright
c
SciTePress

pre-processing; background and foreground
separation; dynamic background estimation; people
location and counting; and suspicious attitudes
detection. Each of these steps is explained in the
next subsections.
2.1 Image Pre-Processing
RGB images are captured by conventional color
cameras. The RGB image is converted to a color
system that separates the brightness in a single
component.
The CIELAB (Forsyth) color coordinates system
was selected because it mimics the logarithm
response of the human eye. This would permit a
visual evaluation of the intermediate results, which
was convenient during the development of the
method. As a matter of fact any color system that
expresses the brightness information in a single
color component could be used in the place of
CIELAB.
After the color system conversion, a bi-
dimensional 3x3 median filter is applied to each
color plane to reduce noise effects.
2.2 Background/Foreground
Separation
This step consists in discriminating between
background and foreground pixels. A variation of
the technique proposed in (Kumar) is added to the
conventional image subtraction approach in order to
deal with background changes due to shades.
Let I
t
(x,y) denote the image frame taken in
instant t on the image coordinates (x,y). The
notation used here (bold face) emphasizes that each
pixel is represented by a vector in a three-
dimensional color space, whereby brightness is
represented by a single component (I
t
b
(x,y)) and
chromaticity by the remaining color components
(I
t
c
(x,y)). Similarly let B
t
(x,y), B
t
b
(x,y) and B
t
c
(x,y)
denote the corresponding background estimate, its
brightness and its chromaticity in instant t.
Additionally let M
t
(x,y) be the logical mask matrix
indicating background (M
t
(x,y) = true) and
foreground (M
t
(x,y) = false) pixels.
In this step, the matrix M
t
(x,y) is computed from
I
t
(x,y) and B
t
(x,y), as formulated by the algorithm
given in Figure 1.
falseyxM
trueyxM
Tyxyx
Tyxyx
trueyxM
Tyxyx
t
t
C
c
t
c
t
H
tt
t
L
tt
=
=
<−
<−
=
<−
),(
),(
),(),(
),(),(
),(
),(),(
else
then
BI AND
BI elseif
then
BI if
Figure 1: Foreground separation algorithm.
The first if condition corresponds to pixels very
similar to the background. The second if condition
tolerates a rather higher disparity to the background
estimate, as far as the difference in chromaticity is
still moderate. This condition models shade effects
in a color space where brightness is expressed by a
single color component.
The threshold values T
L
, T
H
(T
L
< T
H
) and T
C
are obtained experimentally. Following this step an
open-close morphological operation is applied in the
image to eliminate small regions.
2.3 Dynamic Background
Estimation
In the previous step it is assumed that a background
estimate is available. This section describes how
these estimates are computed and updated at each
new frame.
The first background estimate, used when system
starts up, must be provided somehow. This may be
an image stored in memory, or even an image
captured as part of the initialization procedure.
Starting from this first estimate, a dynamic update
algorithm will correct it, at every frame, to handle
illumination fluctuation as well as permanent
background changes. The procedure is presented in
Figure 2.
For background pixels (M
t
(x,y) = true) the next
background estimate is given by a mixture of the
current estimate and the current pixel value. The
mixture factor p establishes how fast small
background changes are assimilated by the estimate.
Actions for foreground pixels (M
t
(x,y) = false)
aim at updating background estimate, at that
position with the current pixel value, if it remains
stable along many consecutive frames. In other
words, if changes between consecutive frames, in a
foreground pixel, are small, as given by parameter
e
b
, for K
máx
consecutive frames, this pixel is
PEOPLE COUNTING SYSTEM
443

considered as belonging to the background and thus
stored in its background estimate.
0),(
0),(
),(),(
),(
1),(),(
),(),(
),(),()1(),(
),(
11
max
1
1
=
=
=
=
+=
<−
⋅+⋅−=
=
++
−
+
else
IB
then
if
then
II elseif
IBB
then
if
yxK
yxK
yxyx
Kyx K
yxKyxK
eyxyx
yxpyxpyx
trueyx M
tt
b
t
t
tt
t
t
Figure 2: Background estimation algorithm.
The algorithm in Figure 2 contains a matrix
K(x,y) where the number of consecutive frames
without any significant change is stored for each
pixel. K(x,y) is initialized with zero at system start
up.
The maximum number of consecutive frames
K
máx
, as well as the mixture factor p, must be
defined empirically for the application.
2.4 People Location and Counting
Once the foreground is known, the system must
locate and count people moving in front of it. Both
tasks are performed together by the following
sequential actions:
Foreground segmentation.
Grouping segments.
2.4.1 Foreground Segmentation
In this first step, initially, the foreground is
segmented in homogeneous color regions. Actually
there are many different segmentation algorithms
that could probably work properly here. This section
describes the watershed-based (Gonzalez)
segmentation algorithm implemented in the
prototype built to validate the proposed method.
The image used to extract the foreground is the
one obtained after applying the smoothing filter in
the pre-processing stage. To segment this image, the
gradient magnitude is calculated over each color
plane by using the Sobel convolution mask. A
matrix G(x,y) containing the mean of the gradient
magnitude across all color components is then
computed for each pixel position. G(x,y) is then
modified; artificial lines are created, building a
square grid whose side equals to
2
máx
A
. Pixels
located in the grid will assume the highest value of
G(x,y). This action ensures that all produced
segments will have an area smaller than A
máx
.
After that, the extended-minima transform
(Soille) is applied to G(x,y). This transform
suppresses the local minima that are not deeper than
a given parameter H. The purpose here is to avoid
the over segmentation effect that would result from
applying the watershed algorithm right away over
G(x,y).
Finally the watershed segmentation procedure is
carried out over the two-dimensional matrix
produced by the extended-minima transform, and
homogeneous color segments are obtained. The
regions delimited by the bounding boxes of these
segments are hereafter called interest regions.
2.4.2 Grouping Segments
People location process assumes that interest regions
belonging to the same person move quite in the
same way between two consecutive frames, if the
variation between those frames is moderated.
The proposed method bases on a technique
known as motion coherence and is summarized in
the following subsections. A more detailed
description can be found in (Shapiro).
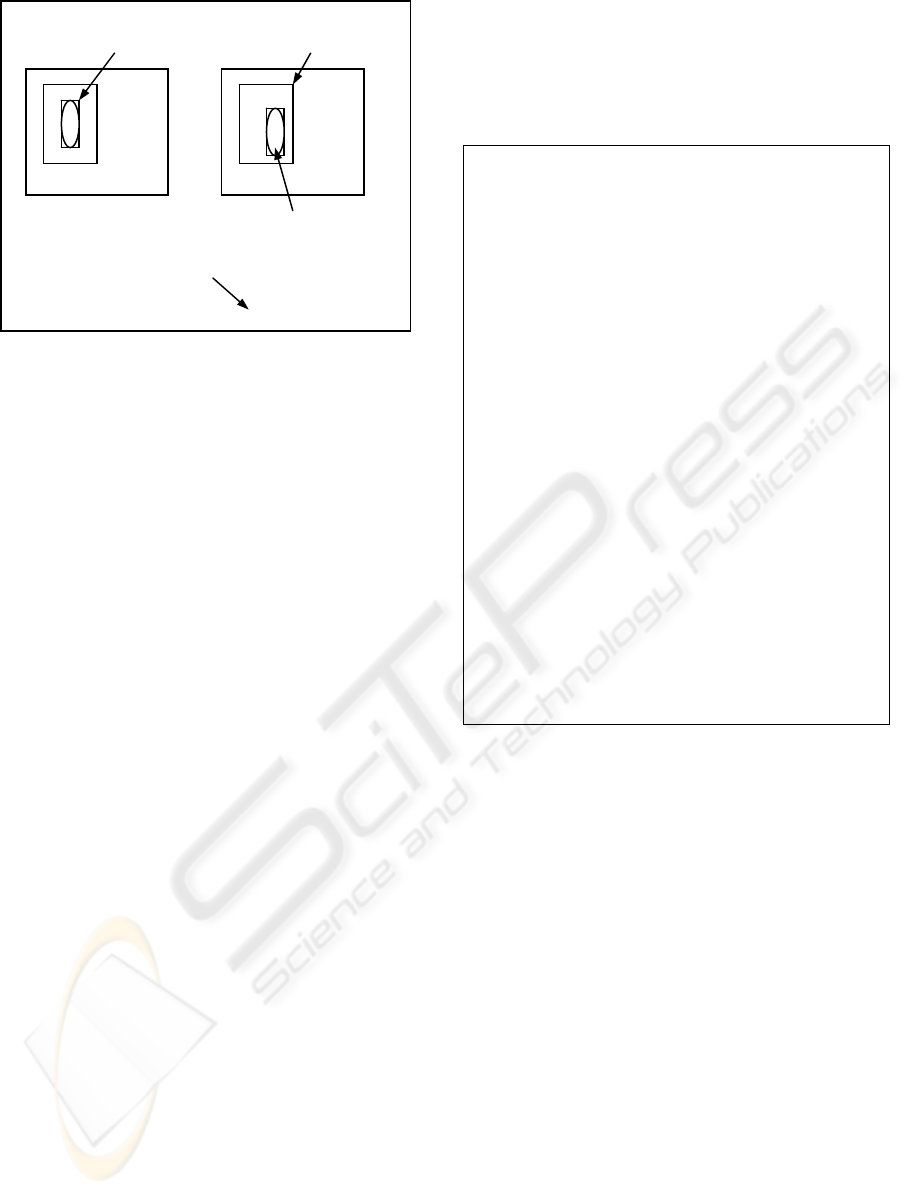
2.4.2.1 Locating Matching Segments in Previous
Frame
Each segment found in the preceding stage must
have a matching segment in the previous frame.
Hence, the previous frame should be searched for
this best matching. For computational efficiency this
search is restricted to an area surrounding the
current region position, as illustrated in Figure 3.
The size of the search area is determined by the
maximum displacement that may occur between two
consecutive frames.
Similarity, between a segment and an equal
shaped segment in the previous frame search area,
can be measured by first computing the magnitude
of color differences between all pairs of
corresponding pixels and then taking the percentile
of them. If the lowest similarity measure found in
the search area is lower than some user defined
maximum, the matching segment on the previous
frame has been found.
Figure 3: Matching segments.
VISAPP 2006 - MOTION, TRACKING AND STEREO VISION
444
2.4.2.2 Computing Motion Vectors
Now vectors representing the movement of each
interest region are computed. Let (x
t
,y
t
) and (x
t-1
,y
t-1
)
be the coordinates of the center of an interest region
and its best matching in the previous frame,
respectively. The corresponding motion vector is
given by (x
t
– x
t-1
, y
t
– y
t-1
) and will be represented
by its magnitude and angle.
2.4.2.3 Grouping Segments
Finally, segments should be joined in groups that
represent people. Some conditions should be
respected before two segments are grouped:
adjacency, coherent movement and previous frame
labeling. The algorithm used is presented in Figure
4. Segments for which no matching in previous
frame was found will be analyzed considering only
adjacency.
At the end of this process, each group will
correspond to a set of adjacent coherent moving
regions, which are assumed as belonging to a single
person.
2.5 Suspicious Attitudes Detection
The idea underlying suspicious attitudes detection is
that, if anybody moving in the environment leaves a
lasting background change, this is an indication that
something was carried away or something was left
behind. Both situations may be relevant as far as the
security is concerned. The proposed method models
this reasoning.
In fact, permanent changes in the background
will sign a suspicious attitude, and this condition has
already been considered in the background estimate
update.
Following the same idea, if an area, that does not
belong do the background, stays stable for K’
máx
(K’
máx
≤ K
máx
) consecutive frames, it will be
configured a suspicious modification. K’
máx
value
represents how long the system takes to detect these
changes and will be defined according to application
characteristics.
/ U
Æ
set of found segments.
/ S
Æ
set of non grouped segments.
/ G
g
Æ
g
th
formed group.
/ s
j
, s
k
Æ
non grouped segments.
/ L
A
j
, L
A
k
Æ
s
j
, s
k
previous labels.
/ L
C
j
, L
C
k
Æ
s
j
, s
k
current labels.
/ mv
j
, mv
k
Æ
s
j
, s
k
movement vectors.
/ D
max
Æ
maximum distance ensuring
vectors coherence.
S = U;
g = 0;
while S ≠ ∅
g = g + 1;
G
g
= s
j
∈ S;
S = S – s
j
;
while ∃ s
k
∈ S so that
(s
k
is adjacent to s
j
∈ G
g
) AND
( (L
A
k
= L
A
j
AND |mv
k
– mv
j
|< D
max
)
OR s
k
does not have a matching
region in previous frame)
G
g
= G
g
∪ s
k
;
S = S – s
k
;
L
C
k
= g;
L
A
j
= L
C
j
, ∀ j so that s
j
∈ U
Figure 4: Grouping segments algorithm.
3 EXPERIMENTAL RESULTS
A prototype implementing the proposed model was
built for evaluation purposes. Five different ambient
were used to collect simulated and real
video sequences. The simulated ones were used to
analyze aspects of the process separately, as follows.
In background and foreground separation Æ
shade effects.
In dynamic background estimation Æ
illumination variations and background
permanent changes.
In people location and counting Æ partial
occlusion and groups.
Besides, simulated sequences were also used to
observe suspicious attitudes detection. Eventually, a
real video sequence was applied, so that the whole
process could be evaluated in a real case. The
subsections below describe each of these topics.
3.1 Shade Effects
.
.
(x
t-1
,y
t-1
) (x
t
,y
t
)
Interest Region
Search Area in the
Previous Frame
Best Matching
. (x
t-1
,y
t-1
)
. (x
t
,y
t
)
Motion Vector
PEOPLE COUNTING SYSTEM
445
Six situations involving smooth, medium and strong
shade effects were simulated. Figure 5 shows an
example with medium shadow.
Figure 5: Medium shadow.
The real number of pixels relative to shade
effects was compared with the one obtained by the
method. The percentage of detected shade is shown
in Table 1.
Table 1: Percentage of detected shade.
Ambient 1 Ambient 2
Smooth
82 % 83 %
Medium
69 % 54 %
Strong
72 % 58 %
3.2 Illumination Variation
Two different lighting conditions were provided, as
shown in the Figure 6 example. One of them has a
higher illumination (Figure 6a) and the other a lower
one (Figure 6b). Video sequences, where these
conditions vary one to another, were obtained and
submitted to the system. In all of them, illumination
changes were incorporated in background estimate.
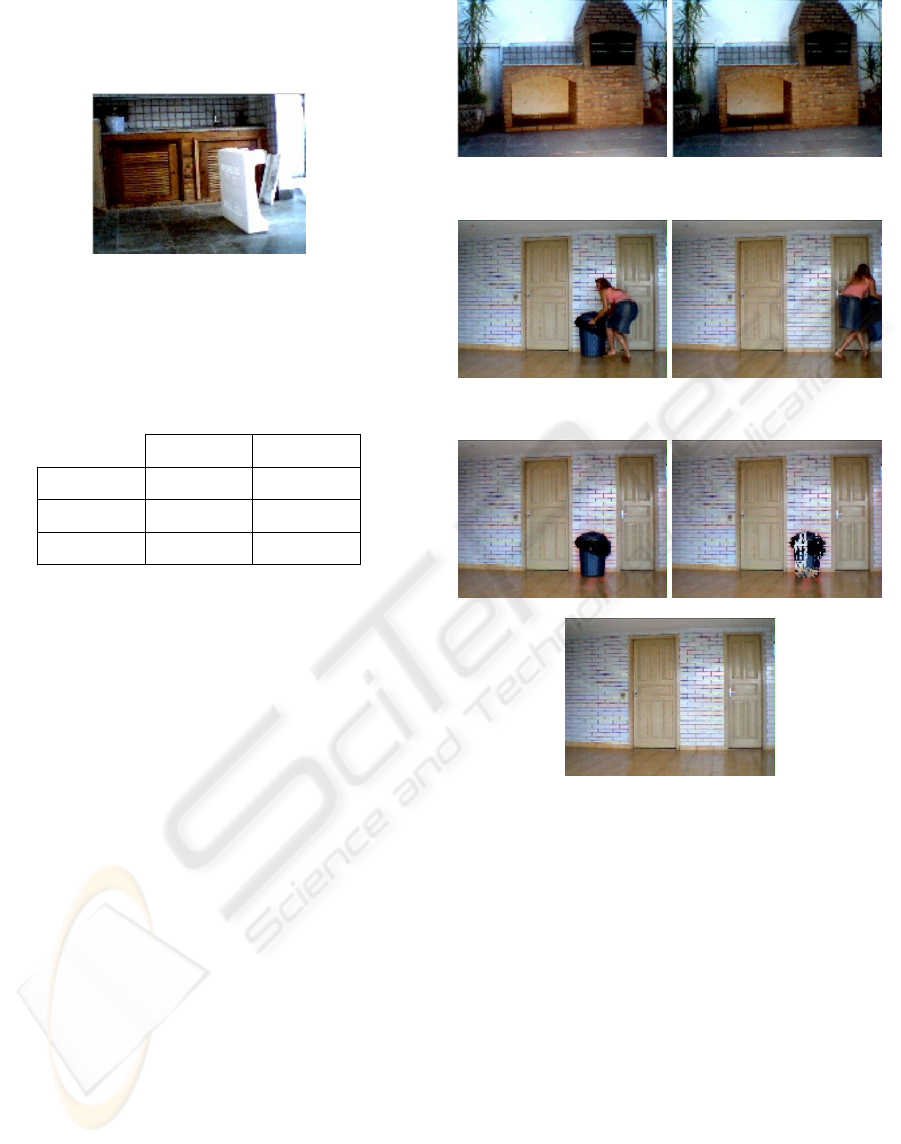
3.3 Permanent Changes
Video sequences where people enter in the scene,
and leaves or carries away any object, were
formulated, as presented in Figure 7. These
situations configure permanent changes in the scene.
Background update corresponding to
modification illustrated in Figure 7 can be analyzed
in Figure 8. At first the waste bin belongs to the
background (Figure 8a), but, as it was carried away
(Figure 7b), slowly, background estimate eliminates
the waste bin from itself (Figure 8b and Figure 8c).
(a) (b)
Figure 6: (a) High and (b) low illumination.
(a) (b)
Figure 7: (a) Original ambient. (b) After change.
(a) (b)
(c)
Figure 8: (a) Original ambient. (b) Update process. (c)
After update.
3.4 Partial Occlusions
Situations involving partial occlusions (Figure 9)
were also developed to evaluate system correctness.
Performance metrics are described below.
Mean Error: mean of the differences
between the real number of people in the
scene and the one obtained by the method.
Standard Deviation: standard deviation of
the same differences cited above.
Sometimes the error can be negative, since the
system counts less people than, in fact, it should do.
On the other hand, when the error is positive, it
means that the system counted more people than it
should.
VISAPP 2006 - MOTION, TRACKING AND STEREO VISION
446
The estimated error must be greater than the
difference between the mean error and the standard
deviation and smaller than the sum of them.
Video sequences used to evaluate the method
present between 0 and 4 people and it is expected
that system error stays between 0,5 and 1,5 person.
Figure 9: Partial occlusion situation.
The mean error and the standard deviation for
tests involving partial occlusions are presented in
Table 2. Results obtained in ambient 2 were not very
good, since the error reached almost 2 people and
there was only one person in the scene. However, in
ambient 1, the error was about 1 person and, in
ambient 3, less than 0,5 person, considerably better.
Table 2: Mean error and standard deviation for occlusion
situations.
Ambient 1 Ambient 2 Ambient 3
Mean
Error
0,36 0,95 0,11
Standard
Deviation
0,67 0,90 0,31
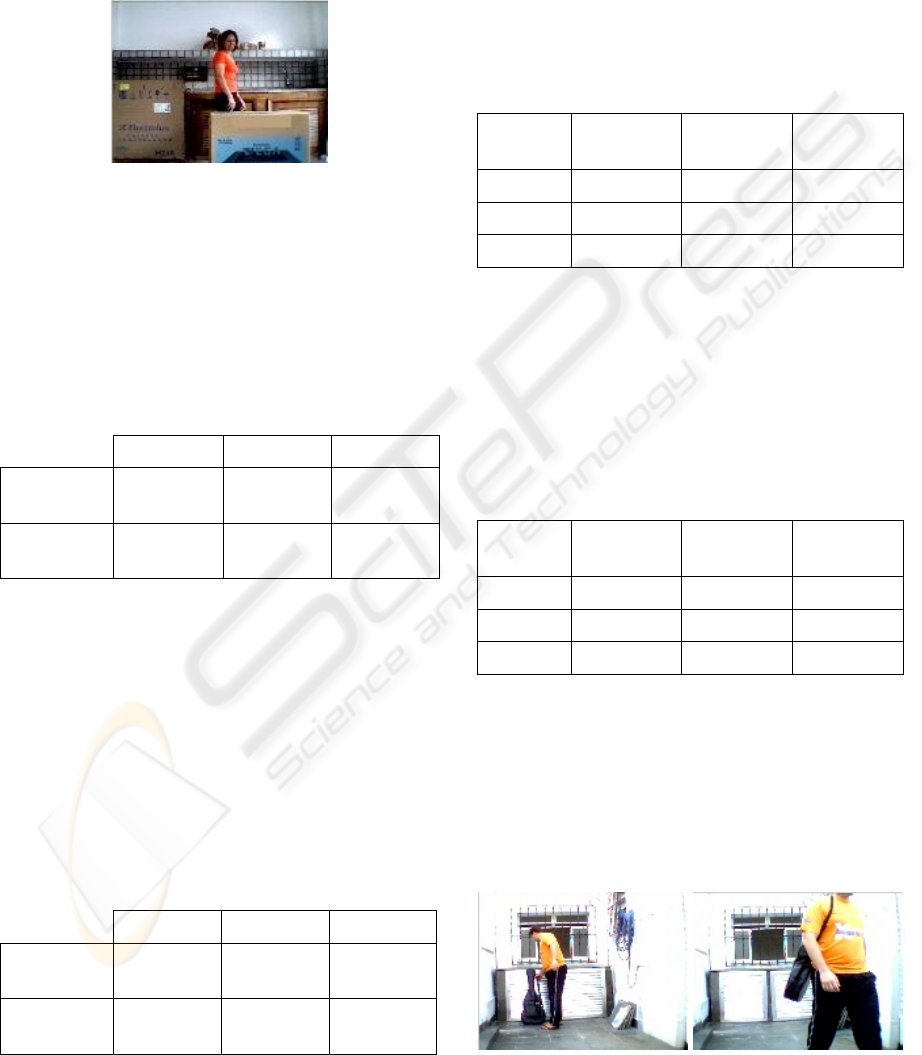
3.5 Groups
For group’s evaluation, three conditions were
considered: an isolated person circulating, groups’
formation and groups splitting.
Table 3 presents reached results for isolated
person situations. As can be seen, ambient 3 allowed
for good results; the error was under 1 person.
Ambient 2 was still satisfactory, but ambient 1, did
not, since it had an error over 2 people.
Table 3: Mean error and standard deviation for isolated
person situations.
Ambient 1 Ambient 2 Ambient 3
Mean
Error
1,20 0,42 0,22
Standard
Deviation
1,14 0,80 0,59
In group’s formation analysis, ambient 1
presented an error about 2 people. For 3 or 4 people
in the scene, this error is acceptable, however with
only 2 people, it is not so good. In ambient 2, except
for groups with 2 people, results were quite good. In
ambient 3, results were better, since the error was
less than 1 person for groups with 2 people and less
than 1,5 person for groups with 3 or 4 people. Table
4 displays these data.
Table 4: Mean error/standard deviation for group
formation situations.
Number
of People
Ambient 1 Ambient 2 Ambient 3
2
0,79 / 1,28 1,23 / 1,21 -0,20 / 0,58
3
1,06 / 0,99 0,49 / 1,05 -0,67 / 0,73
4
0,90 / 1,28 0,00 / 1,42 0,50 / 0,96
Lastly, Table 5 presents results for group’s
splitting. Ambient 2 allowed for better results; the
error was about 1 person for groups with 2 or 3
people and about 1,5 for groups with 4 people.
Ambient 3 had almost the same result. Nonetheless,
ambient 1 had not similar results; the error was over
2 people for all cases.
Table 5: Mean error/standard deviation for group splitting
situations.
Number
of People
Ambient 1 Ambient 2 Ambient 3
2
1,00 / 1,31 0,40 / 0,58 -0,06 / 0,79
3
1,32 / 1,29 -0,11 / 0,99 -
4
1,26 / 1,48 0,34 / 1,34 -0,63 / 1,25
3.6 Suspicious Attitudes
Ten different video sequences concerning suspicious
attitudes were captured and, for all of them, the
system alarmed as expected. Figure 10 shows an
example of a suspicious attitude, where someone
carries an object away.
Figure 10: Suspicious attitude.
PEOPLE COUNTING SYSTEM
447

3.7 Real Situation
Finally a video sequence illustrating a real situation,
that is, without any kind of control, captured in a
newsstand (Figure 11), was submitted to the system.
Results can be seen in Table 6.
Figure 11: Real situation.
Table 6: Mean error and standard deviation for the real
situation.
Real Situation
Mean Error
0,88
Standard Deviation
1,02
In this video sequence, there were also between
0 and 4 people in the scene and the error high limit
was almost 2 people. With 4 people in the scene,
this error is acceptable, nevertheless for 1 person, it
could be smaller.
4 CONCLUSIONS
A method to monitor the number of people moving
in front of a video camera, as well as to detect
suspicious image changes was developed. The
method is intended to enforce security in areas like
warehouses.
This model meets some requirements that have
not been completely met by previous works. It
performs dynamic background update during system
operation and tolerates image changes due to
variation of illumination, to noise and to shade
effects. Permanent background changes are also
managed by the method.
The process has been validated by experiments
carried out on a prototype that produced good
results, although there are still some aspects to
enhance to improve results in group analysis and in
partial occlusions, such as motion coherence and
grouping segment criteria’s.
REFERENCES
Atsushi, N., Hirokazu, K., Shinsaku, H. and Seiji, I., 2002.
“Tracking Multiple People Using Distributed Vision
Systems”. Proceedings of the IEEE International
Conference on Robotics and Automation, pages 2974-
2981.
Cai, Q., Mitiche, A. and Aggarwal, J. K., 1995. “Tracking
Human Motion in an Indoor Environment”. IEEE,
pages 215-218.
Forsyth, D.A., Ponce, J., 2003. Computer Vision – A
Modern Approach, Prentice Hall.
Gonzalez, R. G. and Woods, R. E., 2002. Digital Image
Processing; Prentice Hall.
Haritaoglu, I., Harwood, D. and Davis, L. S., 2000. “W4:
Real-Time Surveillance of People and their
Activities”. IEEE Transactions on Pattern Analysis
and Machine Intelligence, 22(8): 809-830.
Kettnaker, V. and Zabih, R., 1999. “Counting People from
Multiple Camera”. IEEE, pages 267-271.
Kumar, P., Ranganath, S. and Huang, W., 2003. “Queue
based Fast Background Modeling and Fast Hysteresis
Thresholding for Better Foreground Segmentation”.
ICICS-PCM, Singapore, 743-747.
Lu, W. and Tan, Y., 2001. “A Color Histogram Based
People Tracking System”. IEEE, II, pages 137-140.
Piau, N. K. and Ranganath, S., 2002. “Tracking People”.
IEEE, pages 370-373.
Ramanan, D. and Forsyth, D. A., 2003. “Finding and
Tracking People from the Bottom Up”. Proceedings of
the IEEE Computer Society Conference on Computer
Vision and Pattern Recognition (CVPR’03).
Roh, H., Kang, S. and Lee, S., 2000. “Multiple People
Tracking Using an Appearance Model Based on
Temporal Color”. IEEE, pages 643-646.
Rossi, M. and Bozzoli, A., 1994. “Tracking and Counting
Moving People”. In Second IEEE International
Conference on Image Processing, pages 212-216.
Shapiro, L.G. and Stockman, G.C., 2001. “Computer
Vision”,Prentice Hall, pp. 256-260.
Shio, A and Sklansky, J., 1991. “Segmentation of People
in Motion”. In IEEE Workshop on Visual Motion,
pages 325-332.
Soelli, P., 2003. “Morfological Image Analysis Principles
and Applications”. 2
nd
ed. Springer Verlag, NY.
Wojtaszek, D. and Laganière, R., 2002. “Tracking and
Recognizing People in Color Using the Earth Mover’s
Distance”. IEEE, pages 91-96.
Wren, C., Azarbayejani, A., Darrell, T. and Pentland, A.,
1997. “Pfinder: Real-Time Tracking of the Human
Body”. IEEE Transactions on Pattern Analysis and
Machine Intelligence, 19(7): 780-785.
VISAPP 2006 - MOTION, TRACKING AND STEREO VISION
448
