
POINT CLOUD DENOISING USING ROBUST PRINCIPAL
COMPONENT ANALYSIS
Esmeide A. Leal Narváez, Nallig Eduardo Leal Narváez
Faculty of Engineering, University of Antioquia, Cl 67 No 53 – 108, Medellín, Colombia
Keywords: Point Cloud Denoising, PCA, Robust Estimation, Shrinkage, Smoothing.
Abstract: This paper presents a new method for filtering noise occurring in point cloud sampled data. The method
smoothes the data set whereas preserves sharp features. We propose a new weighted variant of the principal
component analysis method, which instead of using exponential weighting factors inversely proportional to
the Euclidean distance to the mean, which is computationally expensive, uses weighting factors assignment
by inversely proportional repartition of the sum of distance to the mean. The determination of weighted
factors by means of inverse proportional repartition makes our variant robust to outliers. Additionally, we
propose a simple solution to the problem of data shrinkage produced by the linear local fitting of the
principal component analysis. The proposed method is simple, easy to implement, and effective for noise
filtering.
1 INTRODUCTION
Data filtering is a task of vital importance in areas
like signal processing, statistical analysis, computer
vision and 3D object reconstruction. In these areas
there is a huge information quantity, represented by
discrete samples, which need to be processed for
reducing the noise produced by devices in the
acquisition process. Though 3D reconstruction
applications have been growing due to the
improvements in the 3D scanner technology, there is
a remaining problem: the raw data produced by 3D
scanners are noisy and are far away of being used
directly into the 3D reconstruction process without a
previous processing.
The development of robust point clouds
denoising algorithms has received much attention in
last years. The goal of such algorithms is either to
remove or to reduce the noise in the data, whereas
preserving sharp features on the original surface
model. So far, researches in the field of digital image
filtering have been adapted for point clouds filtering
algorithms. Nevertheless, the adaptation of
algorithms for digital image filtering to point clouds
filtering is not direct, due to three main reasons:
irregularity, shrinkage, and drifting. The irregularity
refers to the irregular sampling density of the point
clouds. The shrinkage and the drifting refer to the
volume reduction and the spatial displacement
suffered by the points, which are produced by the
use of the mean instead of the data points
(Fleishman, 2003).
Principal Component Analysis (PCA), initially
used for digital image processing, has been adapted
for point clouds processing (Gumhold, 2001, Pauly,
2002). This adaptation has a drawback: PCA is
highly sensitive to the outliers present in the point
clouds. There are several variants that fix this
drawback (Rousseeuw, 1999, De la Torre, 2001,
Skokal, 2002, Hubert, 2005), almost all of them are
based on robust statistics (Huber, 1981). Such
variants, called robust or weighted PCA, improve
the PCA, making it less sensitive to the outliers.
However, the robust PCA variants use exponential
weighting factors to correct the outlier problem,
which is computationally expensive.
This paper presents a new method for point
clouds denoising. Our method first calculates a
weighted mean. The weighting factors assignment of
the mean is achieved by inversely proportional
distributing the sum of distances to the mean. Then,
using the weighting factors and the mean, the
method constructs a covariance matrix and realizes
an eigen-analysis of such matrix. In this way it is
obtained a fitting plane expanded by the
eigenvectors corresponding to the largest
eigenvalues, and a normal vector to the plane, which
51
A. Leal Narváez E. and Eduardo Leal Narváez N. (2006).
POINT CLOUD DENOISING USING ROBUST PRINCIPAL COMPONENT ANALYSIS.
In Proceedings of the First International Conference on Computer Graphics Theory and Applications, pages 51-58
DOI: 10.5220/0001358900510058
Copyright
c
SciTePress

is oriented in the direction of the third eigenvector
corresponding to the smallest eigenvalue. Then, a
displacement of the neighbourhood mean along the
normal vector is achieved in order to preserve sharp
features.
The main contributions of this work are: i) a
simple method for point clouds denoising that does
not require a either previous mesh representation,
nor local polynomial fitting, ii) a simple approach to
prevent the shrinkage problem, and iii) a mechanism
for bias reduction. Our method is robust to outliers,
fast and easy to implement.
The remainder of this paper is organized as
follows. In section 2, related work dealing with
mesh and point clouds denoising algorithms are
presented. In section 3, a short review of principal
component analysis is presented. In section 4, the
stages of our method are explained. In section 5, the
results of our method are shown. In section 6,
conclusions and future work are discussed.
2 RELATED WORK
Point clouds have become a primitive for surface
representation and geometric modelling; however
such point clouds are noisy due to the inherent noise
of the acquisition devices. Point clouds should be
noise free for using in 3D reconstruction. Recently, a
great research effort has been done in mesh and
point clouds denoising and smoothing, producing
numerous algorithms.
Taubin (Taubin, 1995) applies in mesh
smooting a discrete version of the Laplacian
Operator, which is taken from signal processing. The
method is linear in both time and memory.
Desbrum et al. (Desbrum, 1999, Desbrum,
2000) and Bajaj (Bajaj, 2003) successfully use
anisotropic diffusion over meshes, in order to
improve the smoothing in reasonable time.
Peng et al. (Peng, 2001) use locally adaptive
Wiener filtering for denoising geometric data
represented as semiregular mesh. The algorithm
allows interactive local denoising.
Pauly and Gross (Pauly, 2001) apply Wiener
filtering to restore surfaces from point clouds in
presence of blur and noise.
Fleishman et al. (Fleishman, 2003) and Jones et
al. (Jones, 2003) have independently proposed the
use of Bilateral filtering based on robust statistics for
features preserving and mesh smoothing.
Mederos et al. (Mederos, 2003) follows the
same approach that Fleishman and Jones, by
modifying a high order fitting method, called
Moving Least Squares (MLS), to preserve sharp
features. Their approach also considers optimization
techniques for reducing the execution time of the
algorithm.
Choudhury and Tumblin, (Choudhury, 2003)
present a single-pass nonlinear filter for edge
preserving and smoothing. The method is called
Trilateral filtering and it is an evolution of the
Bilateral filtering. The filter produces better outlier
rejection and strong noise reduction than Bilateral
filtering.
Schall et al. (Schall, 2005) have proposed a
probabilistic method which consists of using a
kernel density estimation technique. It associates to
each point a local measure of probability to locate
the point into the surface. The method achieves
effectiveness result in filtering and robustness in
outliers detection.
3 PRINCIPAL COMPONENT
ANALYSIS
Principal Component Analysis (PCA) is a statistical
method that tries to explain the covariance structure
of data by means of various components expressed
as linear combinations of the original variables
(Hubert, 2005).
The first component of PCA corresponds to the
direction in which the projected data have the largest
variance. The second component is orthogonal to the
first component, and maximizes the variance of the
data points projected on it.
PCA is applied widely in bias identification into
data sets. It is used for data dimensionality reduction
and visualization (Jolliffe, 1986), data clustering
(Pauly, 2002) and pattern recognition (De la Torre,
2001). Despite the versatility of PCA, it is sensitive
to outliers present in data. Figure 1a shows a set of
points mainly concentrated at the low part of the
figure. Three of them, which are considered outliers,
are enclosed in red circles. The first component of
PCA, blue line, should indicate the main direction of
data dispersion, but it is observed a bias produced by
the outliers. Figure 1b shows the correction by
robust PCA.
The PCA, first take a set of neighbors
)(
i
pN
around a point
i
p
, next the neigborhood mean
i
p
is
estimated using (1). Finally, using (2), the
covariance matrix
CM
is obtained from the points
GRAPP 2006 - COMPUTER GRAPHICS THEORY AND APPLICATIONS
52
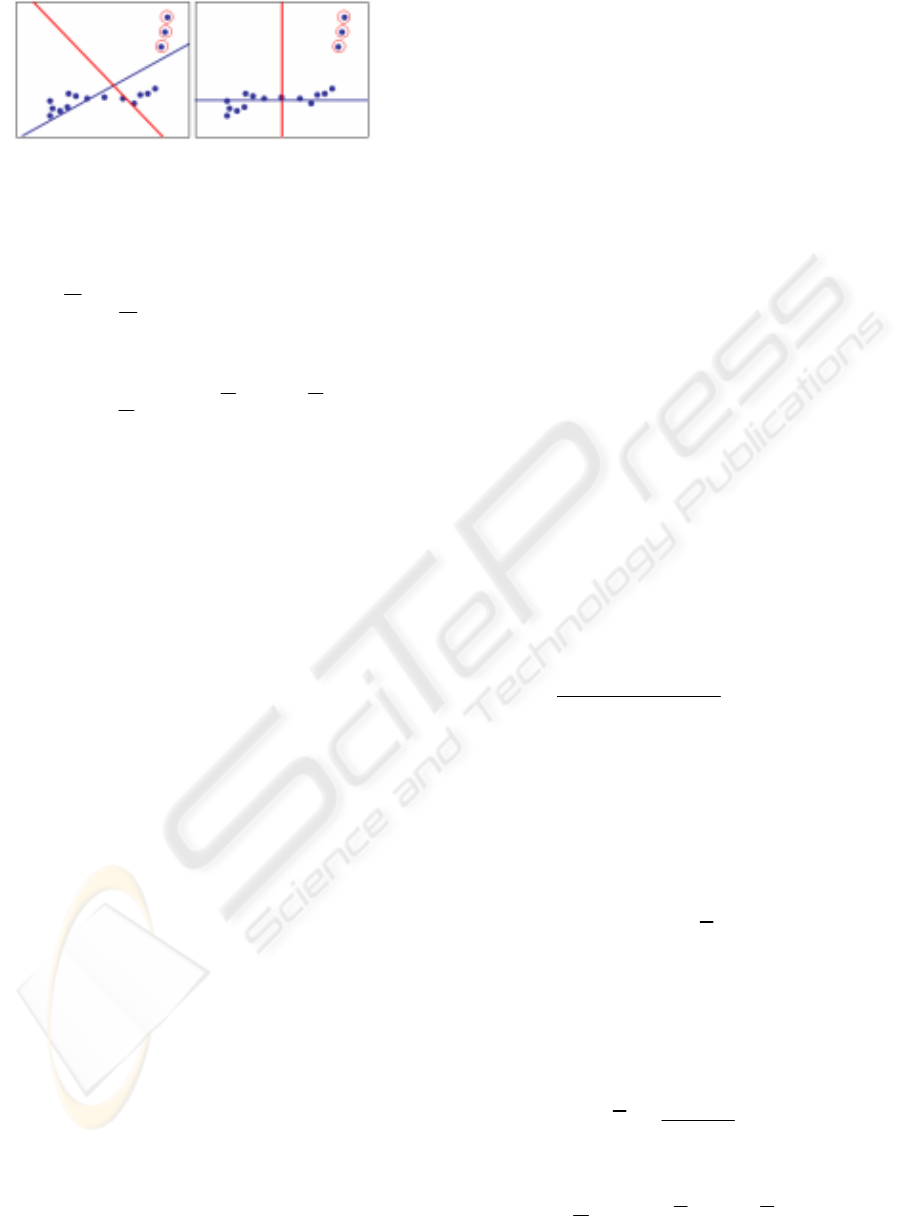
(a) (b)
Figure 1: Principal components of a dataset. (a) PCA (b)
Robust PCA.
and the neigborhood mean.
∑
=
=
n
j
j
i
p
n
p
1
1
,
)(
ij
pNp ∈
(1)
∑
=
−−=
n
j
T
i
j
i
j
pppp
n
CM
1
))((
1
(2)
It is observed that CM is a symmetric positive semi-
definite 3x3 matrix. The CM eigen-decomposition
produce the principal components with their
associated three eigenvectors
321
,, vvv
and three
real eigenvalues
321
λ
λ
λ
≤≤
. The eigenvalues
measure the variation of the points in the
neighborhood along of the directions of their
corresponding eigenvectors. The orthogonal
eigenvectors
32
,vv
define the directions of highest
variation and expand a fitting plane on the
neighborhood. The eigenvector
1
v
approximates the
normal vector
at
i
p
.
4 PROPOSED METHOD
The method has four stages: weights assignment for
the PCA by inversely proportional repartition,
features preservation, shrinkage prevention and bias
correction.
Starting from a noisy point set
}{
3
RpP
i
∈=
,
close to an unknown and smooth two dimensional
manifold boundary surface S, we want to determine
a noise free point set P’ that preserves the sharp
features of the surface from which they were
sampled. The main idea is to use a robust version of
PCA, which allows determining a local fitting plane
to a neighbourhood
)(
i
pN
, close enough to the
surface S. Such fitting plane is not influenced by the
outliers due to the weights assignment by inversely
proportional repartition. In addition, the PCA
establish an orthogonal unit vector to the plane in the
point
i
p
, which is an estimation of the true normal at
i
p
. Once we have the normal vector and the fitting
plane, we apply the operator
p
tnpp +='
(Alexa,
2001, Fleishman, 2003) to preserve sharp features of
S. Then, our method prevents the shrinkage and the
drifting by shifting the neigborhood mean projection
along the tangent plane. The bias produced by the
linear approximation of PCA is reduced by applying
the bootstrap method.
4.1 PCA and Inverse Repartition
The weights assignment by inversely proportional
repartition is the key of the robustness of our robust
PCA variant. The weights assignment is done
according to (3). In that way, we punish with small
weights the points farthest respect to the mean and
we recompense with large weights the points near to
the mean. Using inversely proportional repartition,
the outliers influence over the mean is reduced and
the principal components are not biased by them.
This weights estimation is neither computationally
expensive nor dependent of user parameters.
⎪
⎩
⎪
⎨
⎧
⋅
=
∑
=
cases other in ,
i
d
jmeani
i
pNDd
w
))((
1
,1
0
(3)
In (3)
∑
))((
jmean
pND is the sum of the
distances between the points in the neighborhood of
j
p
(including
j
p
) and the neighborhood mean,
i
d
is the Euclidian distance between the neighborhood
mean and a point
i
p
in the neighborhood. To
estimate the weighted mean
w
p
, robust to outliers,
we use (4). The weights are estimated for each point
in
)(
j
pN
, and we use this weights and the
weighted mean to compute the weighted covariance
matrix, using (5).
∑
∑
=
i
ii
w
w
pw
p
(4)
Wpppp
n
CM
n
i
T
wiwiw
∑
=
−−=
1
))((
1
(5)
POINT CLOUD DENOISING USING ROBUST PRINCIPAL COMPONENT ANALYSIS
53

where CM
w
is the weighted covariance matrix,
{
}
n
wwW ,...,
1
=
, are the weighs associated to
each point
)(
ji
pNp ∈
.
Once we have already estimated the covariance
matrix, its eigen-analysis produces a robust PCA.
Figure 1b, shows the correction of the problem using
our PCA variant, including the inverse repartition.
These variations let our algorithm detect outliers and
made it robust to noise.
4.2 Features Preservation
To prevent over smoothing of the point cloud and, in
consequence, the lost of sharp features, we apply a
shift to the mean along of the normal direction. We
obtain the new position of the mean using (6).
pmw
ntpp
+
='
(6)
where
'p
, is the new position of the mean,
w
p
is the
original weighted mean estimated by (4),
p
n
is the
normal approximation to the plane at
i
p
, given by
the robust PCA, and
m
t
is the displacement
calculated by (7).
∑
∈
−=
)(
)(
pNp
w
ipm
i
ppnmeant
(7)
The above quantity, under the constraint
1=
p
n
, is taken as the minimal height needed for
displacing the mean along of the normal direction.
4.3 Shrinkage Prevention
Linear fitting algorithms are based on the mean of
the neighborhood around a point
i
p
, this produce
data shrinkage, because these algorithms use the
neighborhood centroid
'p
(free of noise) instead of
the original point
i
p
. We correct this problem by
applying a shift to the centroid
'p
, in the direction
of the projection of the vector
'pp −
onto the
tangent plane to the neighborhood. The centroid
'p
is on the tangent plane and
i
p
is on the point cloud,
as it is shown Figure 2.
Figure 2: Data shrinkage prevention.
The new centroid
dis
p'
is calculated using (8).
'' pOrthop
dis
+=
(8)
TTppOrtho ),( −=
(9)
where Ortho, is the orthogonal projection of the
vector
'pp −
onto the neighbourhood tangent plane
T in
'p
, and
⋅
is the dot product operator. Figure
3a shows data points sampled from a synthetic curve
(blue dots) and its corresponding noisy data (red
dots). Figure 3b shows the smoothed noisy data
without shrinkage prevention (green dots) and
Figure 3c shows the correction of the shrinkage
problem after applying (8). It is important to note
that for a correct application of (8), the surface must
be sufficiently sampled in regions with high
curvatures.
4.4 Bias Correction
An additional problem introduced by the linear
fitting is the bias between the original point and the
neighborhood mean. We correct this problem using
bootstrap bias correction (Martinez, 2002). We first
perform a pass using our PCA variant; then, we
perform a second pass including the bootstrap bias
correction according to (10). Figure 4 shows the bias
problem and its correction. Figure 4a shows data
points sampled from a synthetic curve (blue dots)
and its corresponding noisy data (red dots). Figure
4b shows the smoothed noisy data with bias (green
dots) and Figure 4c shows the bias reduction (the
green dots are closer to the blue dots) after the
application of the bootstrap. The bootstrap is an
iterative method, but in our experimental test, a
single iteration was sufficient.
=
−= pp biasCorr
_
2
(10)
where
∑
=
=
n
i
i
p
n
p
1
1
, is the new neighborhood
mean after the second pass.
GRAPP 2006 - COMPUTER GRAPHICS THEORY AND APPLICATIONS
54
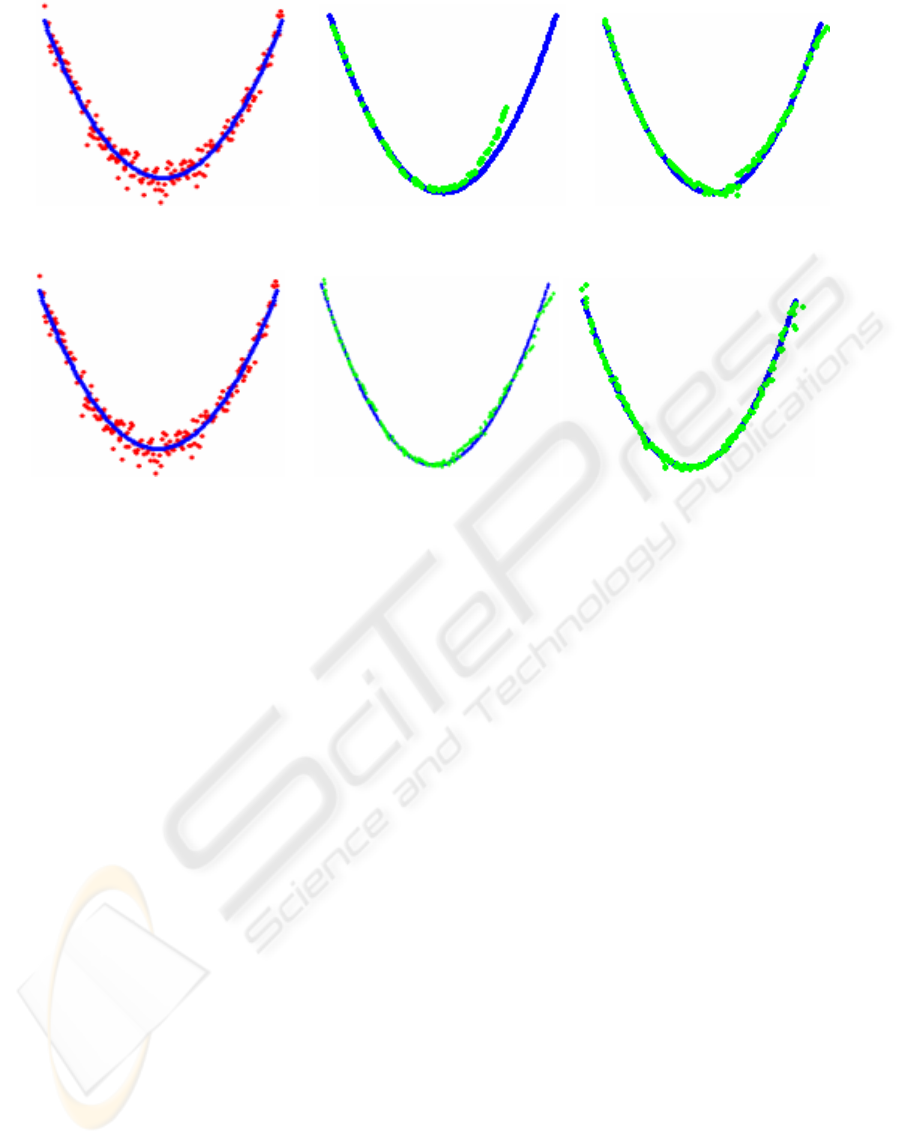
(a) (b) (c)
Figure 3: Shrinkage problem. (a) Noisy data represented by red dots (b) Smoothed data with shrinkage problem, represented
by green dots (c) Smoothed data with shrinkage prevention using (8).
(a) (b) (c)
Figure 4: Bias correction (a) Noisy data represented by red dots (b) Smoothed data with bias problem, represented by green
dots (c) Smoothed data with bias reduction prevention using (10).
5 ANALYSIS AND RESULTS
The proposed method has been tested in 2D and 3D
data sets. The tests were run on a 1.5 GHz Athlon
AMD, with 512 MB of RAM. The result shows that
our algorithm has a good behaviour with different
noise levels. Figure 3, used to illustrate the
shrinkage problem correction, shows a synthetic data
set corrupted with Gaussian noise (
σ
= 1% of the
average spacing between the points). The points
were sampled from a parabola in the interval [-1, 1].
We observe how the algorithm controls the data
shrinkage by applying (8), as shows Figure 3c (green
points), in contrast with shown in Figure 3b, where
the shrinkage prevention has not been applied (green
points). The data shrinkage problem is more evident
at the extremes. In our tests, the proposed method
for preventing the shrinkage problem allowed to
reduce the relative error, between the real and the
approximated volume, from 34% to 10%.
The parabola data set (Figure 4) is also used to
illustrate de bias problem. In one hand we observe
the bias between the data points mean (green dots)
and the original data points (blue dots). In the other
hand, we observe in Figure 4c, the result of applying
the bootstrap bias correction (green dots are closer to
the blue dots). In our tests, after applying (10) the
bias reduction reaches a 57%, i.e. the distance
between the real data points and the smoothed data
points after applying the bootstrap technique was
reduced until a 43% of the initial distance.
The data sets used to illustrate the result of our
method for point cloud denoising were corrupted
with Gaussian noise (zero mean and variance
σ
)
along of the normal direction. We specified the noise
magnitude as a percentage of the average z
coordinate or the diagonal of the bounding box of
the point cloud.
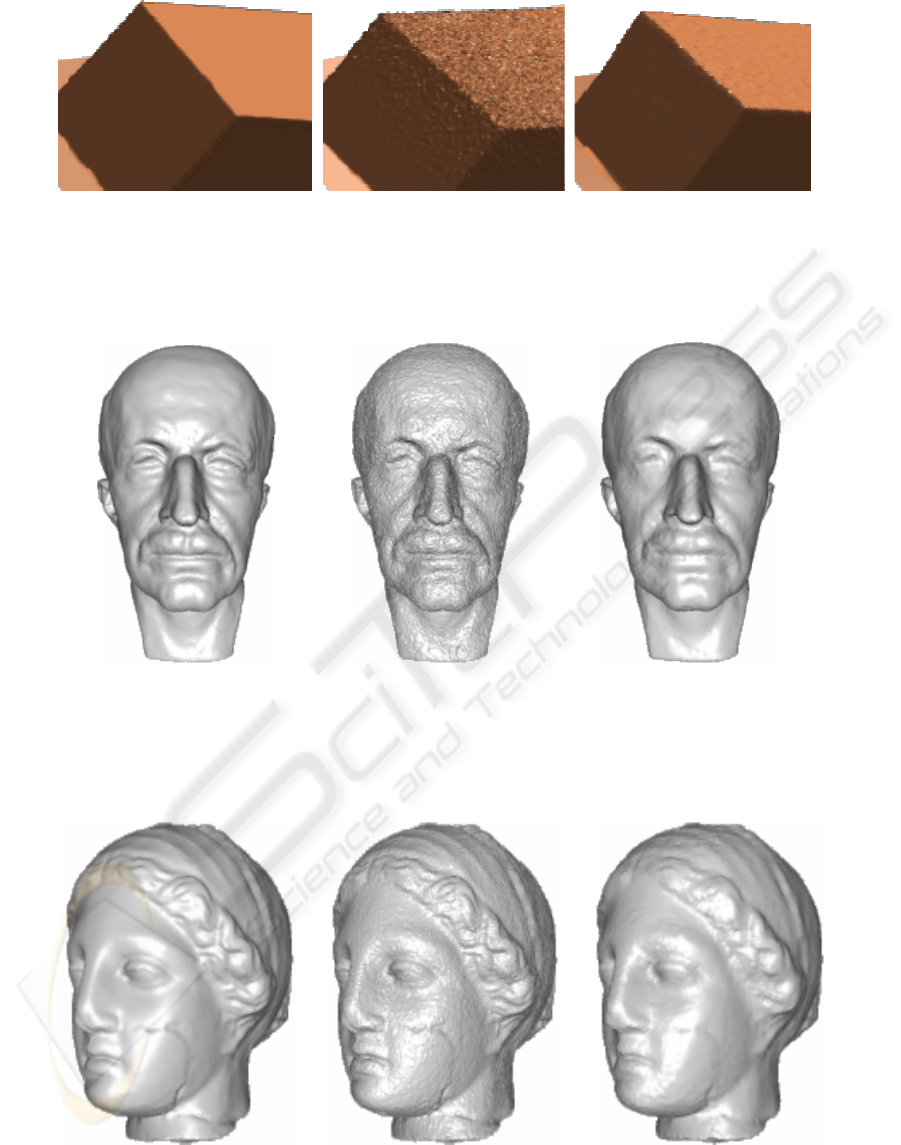
Figure 5 shows a cube model corrupted with
Gaussian noise (
σ
= 5% of z coordinate average).
We observe how our algorithm preserves sharp
features (corners and edges) while smoothes the
point cloud.
In Figures 6 the Max Planck model (50k points)
corrupted with Gaussian noise (
σ
= 0.08% of
diagonal of the bounding box) is shown. The model
was smoothed in 13 seconds. Figures 7 and 8 show
the Venus model (70k points) corrupted with
Gaussian noise (
σ
= 0.05% and
σ
= 0.025% of the
diagonal of the bounding box respectively). The
model was smoothed in 19 seconds. In Figure 9 a
bird model was corrupted with Gaussian noise (
σ
=
0.1% of z coordinate average) to illustrate the model
detail before and after applying our algorithm. It is
observed the effectiveness of the method eliminating
the noise and preserving the features.
POINT CLOUD DENOISING USING ROBUST PRINCIPAL COMPONENT ANALYSIS
55
(a) (b) (c)
Figure 5: Sharp features preservation. (a) Original cube model (b) Cube model corrupted model with Gaussian noise (c)
Corrupted cube model after filtering.
(a) (b) (c)
Figure 6: Max Planck model. (a) Original Max Planck model. (b) Max Planck model corrupted with Gaussian noise (c)
Corrupted Max Planck model after filtering.
(a) (b) (c)
Figure 7: Venus model left view. (a) Original Venus model. (b) Venus model corrupted with Gaussian noise (c) Corrupted
Venus model after filtering.
GRAPP 2006 - COMPUTER GRAPHICS THEORY AND APPLICATIONS
56
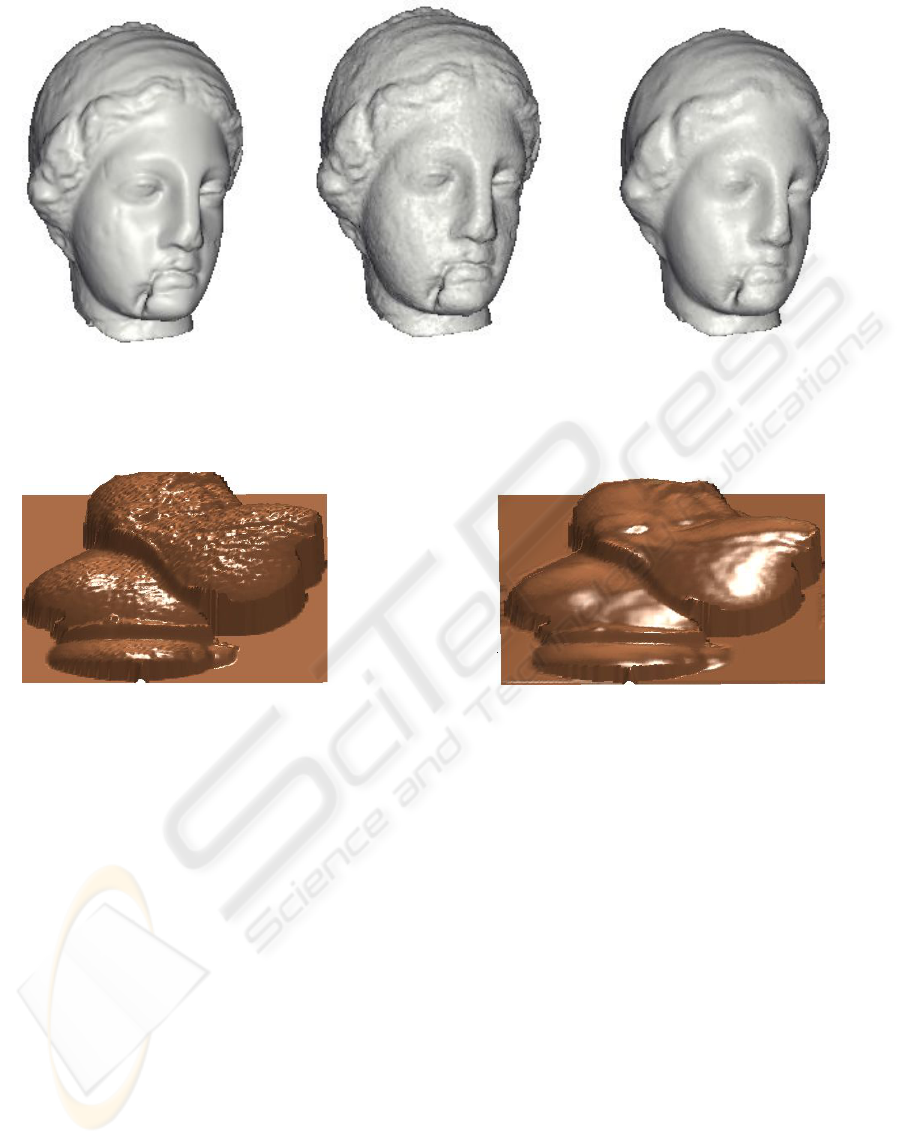
(a) (b) (c)
Figure 8: Venus model right view. (a) Original Venus model. (b) Venus model corrupted with Gaussian noise (c) Corrupted
Venus model after filtering.
(a) (b)
Figure 9: Bird model. (a) Bird model corrupted with Gaussian noise (b) Corrupted bird model after filtering.
6 CONCLUSION AND FUTURE
WORK
In this paper we have presented a new and robust
method for point clouds denoising. The method is a
PCA variant that preserves sharp features of the
original surface. In contrast with previous work, our
method does not require high order local fitting
algorithms (like MLS), or global approximation to
surface (like triangular meshes or graphs). The
proposed method operates directly on the points and
does not require neither nonlinear optimization
algorithms nor parameters provided by users. The
method is computationally efficient and easy to
implement.
There is a way to improve our method using an
adaptive neighborhood size instead fixed size. The
neighborhood size should depend on the local
characteristics like curvature and density, this will
allow a better normal estimation and, in
consequence, would improve the application of the
operator
p
tnpp
+
=
'
. Taking into account the local
curvature, we can reduce the bias between the
neighborhood mean and the data point, in this way,
we are closer to the point of the original surface.
REFERENCES
Alexa, M., Behr, J., Cohen-Or, D., Fleishman, S., Levin,
D., and Silva, C.T., 2001. Point set surfaces. In
Proceedings of the Conference on Visualization, pages
21-28. IEEE Computer Society.
POINT CLOUD DENOISING USING ROBUST PRINCIPAL COMPONENT ANALYSIS
57

Bajaj, C., L., and XU, G. 2003. Anisotropic diffusion of
subdivision surfaces and functions on surfaces. ACM
Transactions on Graphics (TOG) 22, 1, 4–32.
Choudhury, P., and Tumblin, J., 2003. The Trilateral Filter
for High Contrast Images and Meshes. Eurographics
Symposium on Rendering, pp. 1.11
De la Torre, F., and Black, M.J., 2001. Robust principal
component analysis for computer vision. In ICCV’01,
I: 362–369.
Desbrun, M., Meyer, M., Schroder, P., and Barr, A. H.
1999. Implicit Fairing of Irregular Meshes Using
Diffusion and Curvature Flow. In Proceedings of
SIGGRAPH, 317–324.
Desbrun, M., Meyer, M., Schroder, P., and Barr, A. H.
2000. Anisotropic Feature-Preserving Denoising of
Height fields and Bivariate Data. In Graphics
Interface, 145–152.
Fleishman, S., Drori, I., and Cohen-Or, D., 2003. Bilateral
mesh denoising. ACM Transactions on Graphics
(TOG), 22(3):950-953.
Gumhold, S., Wang, X., and MacLeod, R., 2001. Feature
extraction from point clouds. In 10th International
Meshing Roundtable, Sandia National Laboratories,
pages 293-305, October.
Huber, P. J., 1981. Robust Statistics. John Wiley and Sons.
Hubert, M., Rousseuw, P.J., and Branden, K.V., 2005.
ROBPCA: A New Approach to Robust Principal
Component. Analysis.Technometrics, February, VOL.
47, NO. 1.
Jolliffe, I., 1986. Principal Component Analysis. New
York:Springer-Verlag.
Jones, T. R., Durand, F., and Desbrun, M., 2003. Non-
iterative, feature-preserving mesh smoothing. ACM
Transactions on Graphics (TOG), 22(3):943-949.
Martinez, W.L., and Martinez, A.R., 2002. Computational
statistics handbook with Matlab. Chapman &
Hall/CRC.
Mederos, B., Velho L., and De Figueiredo L. H., 2003.
Robust smoothing of noisy point clouds. In Proc.
SIAM Conference on Geometric Design and
Computing (Seattle, USA), Nashboro Press.
Pauly, M., Gross, M., and Kobbelt, L., 2002. Efficient
simplification of point-sampled surfaces. IEEE
Vizualization, pp. 163–170.
Pauly, M., and M. Gross., 2001. Spectral processing of
point-sampled geometry. Proc. ACM SIGGRAPH, pp.
279–386.
Peng, J., Strela, V., and Zorin, D. 2001. A Simple
Algorithm for Surface Denoising. In Proceedings of
IEEE Visualization, 107–112.
Rousseeuw, P. J., and Driessen, K.V., 1999. A Fast
Algorithm for the Minimum Covariance Determinant
Estimator. Technometrics, 41, 212–223.
Skocal, D., and Leonardis, A., 2002. Weighted
Incremental Subspace Learning. Proceedings of
Workshop on Cognitive Vision. Zurich, Sep.
Schall, O., Belyaev, A., and Seidel, H., 2005. Robust
Filtering of Noisy Scattered Point Data. Eurographics
Symposium on Point-Based Graphics.
Taubin, G., 1995. A Signal Processing Approach to Fair
Surface Design. In Proceedings of SIGGRAPH, 351–
358.
GRAPP 2006 - COMPUTER GRAPHICS THEORY AND APPLICATIONS
58
