
VISUAL SIMULATING DICHROMATIC VISION IN CIE SPACE
Yinghua Hu
School of Computer Science
University of Central Florida
Keywords:
Dichromatic vision, Visual simulation.
Abstract:
Dichromatic vision is due to the loss of one of the three cone pigments: the L type in protanopes, the M type in
deuteranopes, and the S type in tritanopes. In this paper, we show that the dichromatic vision can be simulated
by applying transformation to image in CIE x, y chromaticity space. We base our work on the past experiments
on unilateral color blind (color blind in one eye) people which show that for protanopes and deuteranopes the
hue of 470 nm and 575 nm stimuli stay the same as that for normal eyes, and for tritanopes the hue of 485
nm and 660 nm are the same as that for normal eyes. We also assume that the curve between these anchored
stimuli points and D6500 standard white stimuli in the chromaticity diagram is quadratic. Our method saves
the steps for transformation of CIE chromaticity value to uniform chromaticity value or LMS value as required
in the previous work and still gets reasonable results.
1 INTRODUCTION
Normal color vision is trichromatic. It is initiated by
the absorption of photons in three types of photore-
ceptor cells in the retina: the short (S)-, middle (M)-,
and long (L)-wave sensitive cones, each of which con-
tains a different photopigment. The peak sensitivities
of these three photopigments lie in the long, middle
and short wavelength regions of the spectrum respec-
tively. Therefore any color stimulus can be specified
by the three cone responses.
Trichromacy, however, is not enjoyed by all. About
8% of the Caucasian male, 5% of the Asian male and
3% of the other male population suffer from color
blindness or color deficiency, only 0.5% of female
population is colorblind. Among colorblind popula-
tion, about one quarter is dichromatic, the rest are
anomalous trichromats, who have three classes of
photoreceptors, but do not perceive color as normal
trichromat do. Dichromacy is caused by the missing
of one of the three cone pigments, of the L type in
protanopes, the M type in deuteranopes, and the S
type in tritanopes. Compared with trichromatic vi-
sion, dichromatic vision entails a loss of hue discrim-
ination and results in a reduced color gamut. Dichro-
matic vision is a more restrictive form of defective
color vision than anomalous trichromats, so that color
schemes designed for dichromats can also be applied
for anomalous trichromats.
In this paper, we attempt to simulate for the normal
observer the color percept of dichromats. Our simula-
tion of dichromatic vision proceeds by applying trans-
formation in CIE x, y chromaticity coordinate space.
The simulation produces plausible results.
We believe that such simulation will enable artists,
web designers and graphics interface designers to
check how their work will appear to color deficient
people. In entertainment industry, such kind of sim-
ulation can be necessary if the synthetic character is
color blind.
2 RESEARCH BACKGROUND
The history of simulation of the color perception of
dichromats begins with German writer and scientist
Goethe (1810). In Farbenlehre (Sharpe et al., 1999),
he included a reproduction of a small watercolor that
he painted to demonstrate how the landscape would
appear to those lacking the blue sensation.
Although researchers can check what colors the
dichromats confuse with by doing experiments, it is
impossible to relate this information to what they ac-
tually see instead. This problem has been overcome
92
Hu Y. (2006).
VISUAL SIMULATING DICHROMATIC VISION IN CIE SPACE.
In Proceedings of the First International Conference on Computer Graphics Theory and Applications, pages 92-97
DOI: 10.5220/0001351900920097
Copyright
c
SciTePress

by studying the vision of unilateral dichromats, (in-
dividuals born with one normal eye and one dichro-
matic eye). The past experiments suggest that both
protanopes and deuteranopes see the same blue at 470
nm and the same yellow at 575 nm as trichromats
(Judd, 1948; Graham and Hsia, 1958). Observations
also suggest that a blue-green at 485 nm and a red
at 660 nm have the same hue for the normal and tri-
tanopic eyes (Alpern et al., 1983).
Basing on these observations, (Meyer and Green-
berg, 1988) assume that color space of normal vision
collapses to a line called ”major axis” on the uni-
form chromaticity diagram for each of the three types
of dichromat. All the loci (straight lines) represent-
ing stimuli of the same dichromatic chromaticity will
converge to the same point in the chromaticity dia-
gram. That point is called confusion point and the
loci passing specified stimuli and confusion point is
called confusion line. Meyer and Greenberg compute
replacement color seen by dichromats by calculating
the intersection between the confusion line and the
major axis.
(Brettel et al., 1997) propose a replacement method
based on the same observations and the assumption
that neutrals for normals are perceived as neutrals
for dichromats. Firstly, they identify a neutral axis
which is a straight line connecting origin in the LMS
space and the brightest possible metamer of an equal-
energy stimulus. Secondly, they represent the surface
of the reduced stimuli of protanopes and deuteranopes
by the two half planes anchored by neutral axis and
475-nm and 575-nm locations in the LMS space, and
for tritanopes, they anchor the reduced stimuli sur-
face by neutral axis, 485-nm and 660-nm. Finally,
they compute a replacement stimulus for a stimulus
in trichromatic vision by projecting it onto the half
planes aforementioned by the direction parallel to the
missing fundamental axis. (Vi
´
enot et al., 1999; Vi
´
enot
and Brettel, 2001) simplified Brettel et al’s model by
replacing the two half planes with the diagonal plane
in the LMS space.
The CIE XYZ color space is based on direct mea-
surements of the human eye, and serves as the ba-
sis from which many other color spaces are defined.
The study in this paper is based on the thought that
whether the simulation of dichromatic vision can be
done directly on CIE x, y chromaticity values.
3 ALGORITHM
Alike the assumption of major axis in the uniform
chromaticity by Meyer and Greenberg, our method
assumes that the CIE chromaticity space of normal
color vision collapses to a curve connecting the an-
chor points. The anchor points for this curve are de-
rived from the observations discussed in Section 2.
They are 470 nm and 575 nm for protanopes and
deuteranopes, and 485 nm and 660 nm for tritanopes.
We also assume that D6500 white stays as the same
hue in normal and dichromatic vision. So the color
space will collapse into a curve passing through the
anchor points and D6500. We use the Lagrange inter-
polation to get the other points on this hue curve.
The conversion matrix to transform from CIE XYZ
coordinates to RGB coordinates is known (Pharr and
Humphreys, 2004):
[XY Z
to RGB] =
3.2405 −1.5372 −0.4985
−0.9693 1.8760 0.0416
0.0556 −0.2040 1.0573
For a pixel in the picture, we firstly transform its
RGB value to XYZ coordinates by
"
X
Y
Z
#
= [RGB
to XY Z]
"
R
G
B
#
where
[RGB
to XY Z] = [XY Z to RGB]
−1
then transform XYZ coordinates to chromaticity
coordinates by:
x =
X
X + Y + Z
y =
Y
X + Y + Z
In this algorithm, we use confusion point data from
(Wyszecki and Stiles, 1982):
x
p
= 0.747 x
d
= 1.080 x
t
= 0.171
y
p
= 0.253 y
d
= −0.080 y
t
= 0
For each chromaticity point A(x,y) in chromaticity
space, the chromaticity point A
p
(x’,y’) actually seen
by dichromats is found by intersecting the confusion
line passing A with the hue curve we get by interpo-
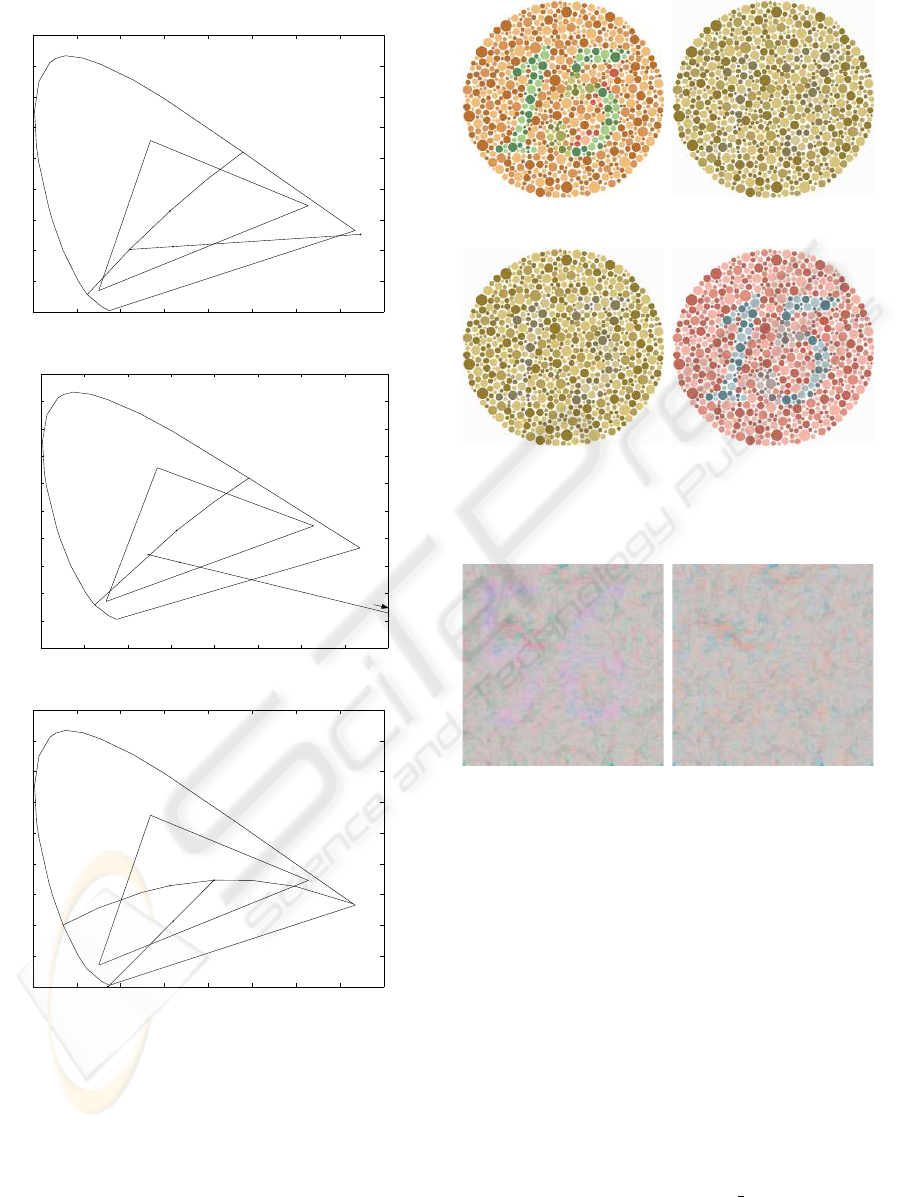
lation (See Figure 1).
The new chromaticity and original luminance is
then transformed back to RGB space:
X
′
=
Y
y
′
∗ x
′
Y
′
= Y Z
′
=
Y
y
′
∗ z
′
"
R
′
G
′
B
′
#
= [XY Z
to RGB]
"
X
′
Y
′
Z
′
#
If the new color fell outside the monitor gamut (the
triangle in Figure 1), it is adjusted by holding its chro-
maticity constant and adjusting its luminance.
VISUAL SIMULATING DICHROMATIC VISION IN CIE SPACE
93
0 0.1 0.2 0.3 0.4 0.5 0.6 0.7 0.8
0
0.1
0.2
0.3
0.4
0.5
0.6
0.7
0.8
0.9
470
575
D65
P
A
Ap
protanopic
x
y
0 0.1 0.2 0.3 0.4 0.5 0.6 0.7 0.8
−0.1
0
0.1
0.2
0.3
0.4
0.5
0.6
0.7
0.8
0.9
470
575
D65
A
Ad
deuteranopic
x
y
D
0 0.1 0.2 0.3 0.4 0.5 0.6 0.7 0.8
0
0.1
0.2
0.3
0.4
0.5
0.6
0.7
0.8
0.9
485
660
D65
T
A
At
tritanopic
x
y
Figure 1: Curve of colors actually seen by dichromats and
adjustments made to a single chromaticity point to create a
dichromatic version of image. D65 represents D6500 white
and the triangle is the monitor gamut. Point P, D and T are
confusion points and the straight lines decided by confusion
points and A are confusion lines. A
p
, A
d
, A
t
are the chro-
maticity points actually seen by protanopes, deuteranopes
and tritanopes on point A.
(a) Normal (b) Protanopic
(c) Deuteranopic (d) Tritanopic
Figure 2: Dichromatic versions of a testing image.
(a) Normal (b) Tritanopic
Figure 3: Tritanopic version of a testing image.
4 RESULTS
We implemented the algorithm in MATLAB. The
program takes the type of dichromat and a color
image as input, and generates as output an image
for the specified dichromat. We present the results
of our algorithm for standard images used for
colorblindness testing. In Figure 2, the original
Ishihara test image from Colorblind homepage
(http://www.colorvisiontesting.com/) is transformed
to protanopic and deuteranopic images where ”15” in
the normal version is recognized as ”13” or nothing.
Figure 3 shows an image from Wikipedia website
(http://en.wikipedia.org/wiki/Color
blindness) used
for testing tritanopia and its appearance in the
tritanopic vision generated by our algorithm.
GRAPP 2006 - COMPUTER GRAPHICS THEORY AND APPLICATIONS
94

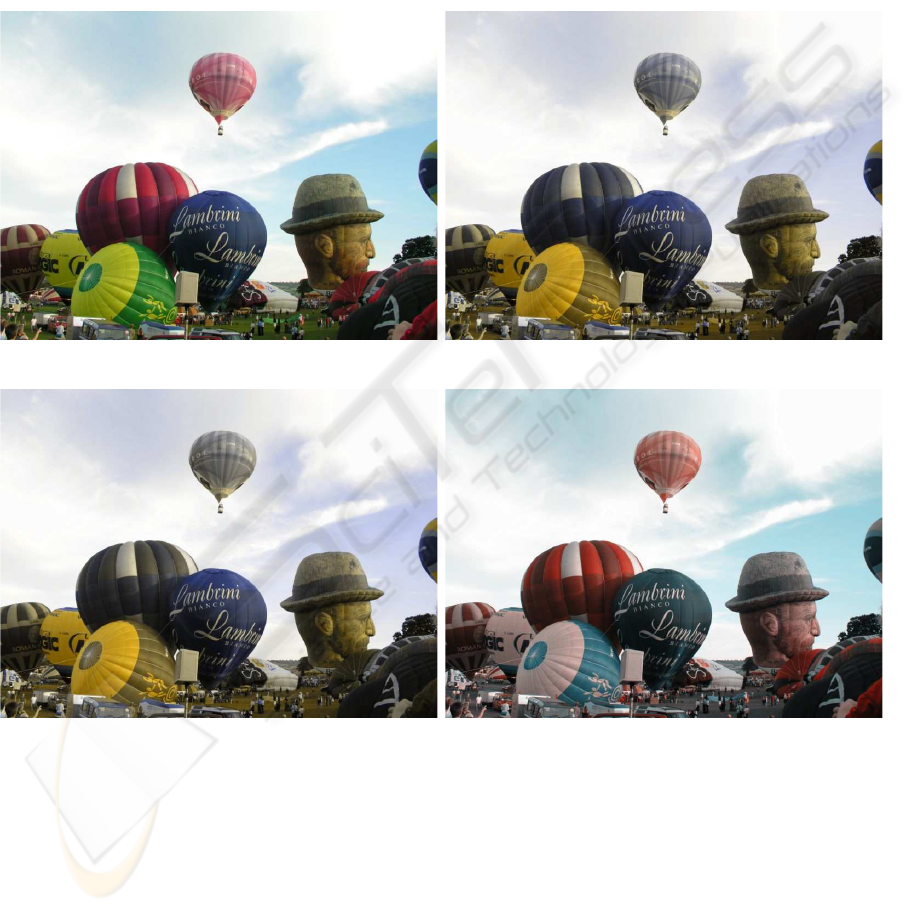
A colorful picture and its appearance in dichro-
matic vision are shown in Figure 4.
5 DISCUSSION
To compare our algorithm and the previous work,
we run a test to convert the image in Figure 4(a) to
protanopic version using this algorithm, our imple-
mentation of Meyer’s algorithm and Brettel’s algo-
rithm. The resulting images are shown in Figure 5.
The test is done on a PC with a CPU of 2.00 GHZ
AMD Athlon XP 2400+ and 512 Mb memory. The
elapsed time for our algorithm, Meyer’s algorithm
and Brettel’s algorithm are respectively 87.5 s, 94.0 s
and 117.4 s. Our algorithm is more efficient because
it does not require the procedure to transform color
value from CIE XYZ space to uniform chromaticity
value or LMS value as in Meyer or Brettel’s work.
6 CONCLUSION AND FUTURE
WORK
In this paper, we show that the simulation of dichro-
matic vision can be done by simple transformations
in CIE x, y chromaticity space. Our method saves the
steps for transformation of CIE chromaticity value to
uniform chromaticity value or LMS value as required
in the previous work and still gets reasonable results.
(Wachtler et al., 2004) propose that the color appear-
ance in dichromatic vision is richer than was previ-
ously thought. They insist that previous linear color
vision models fail to account for the richness of color
experience that dichromats enjoy and express. They
also propose a nonlinear model to simulate hue scal-
ing results. Using their model for realistic rendition of
dichromatic vision will be an interesting future work.
ACKNOWLEDGEMENTS
We thank Sumanta N. Pattanaik for his great help
since the inception of this research. We also thank
reviewers for their valuable comments.
REFERENCES
Alpern, M., Kitahara, K., and Krantz, D. H. (1983). Per-
ception of colour in unilateral tritanopia. J. Physiol.,
335:683–697.
Brettel, H., Vi
´
enot, F., and Mollon, J. D. (1997). Comput-
erized simulation of color appearance for dichromats.
J. Opt. Soc. Am. A, 14:2647 – 2655.
Graham, C. and Hsia, Y. (1958). Color defect and color
theory. Science, 127(3300):675–682.
Judd, D. B. (1948). Color perceptions of deuteranopic
and protanopic observers. J. Res. Natl. Bur. Stand.,
41:247–271.
Meyer, G. W. and Greenberg, D. P. (1988). Color-defective
vision and computer graphics displays. IEEE Comput.
Graph. Appl., 8(5):28–40.
Pharr, M. and Humphreys, G. (2004). Physically Based
Rendering : From Theory to Implementation, page
234. Morgan Kaufmann Publishers.
Sharpe, L. T., Stockman, A., J
¨
agle, H., and Nathans, J.
(1999). Color vision: from genes to perception, chap-
ter Opsin genes, cone photopigments, color vision and
colorblindness, pages 3–50. Cambridge: Cambridge
University Press.
Vi
´
enot, F. and Brettel, H. (2001). Color Imaging: Device-
Independent Color, Color Hardcopy, and Graphic
Arts VI, chapter Color display for dichromats, pages
199–207. Proc. SPIE.
Vi
´
enot, F., Brettel, H., and Mollon, J. D. (1999). Color
research and application. Color Research and Appli-
cation, 24(4):243–251.
Wachtler, T., Dohrmann, U., and Hertel, R. (2004). Mod-
eling color percepts of dichromats. Vision Research,
44(24):2843–2855.
Wyszecki, G. and Stiles, W. S. (1982). Color Science: Con-
cepts and Methods, Quantitative Data and Formulae,
Second Edition, page 464. John Wiley & Sons, Inc.
VISUAL SIMULATING DICHROMATIC VISION IN CIE SPACE
95
(a) Normal (b) Protanopic
(c) Deuteranopic (d) Tritanopic
Figure 4: A colorful picture and its appearance in dichromatic vision.
GRAPP 2006 - COMPUTER GRAPHICS THEORY AND APPLICATIONS
96
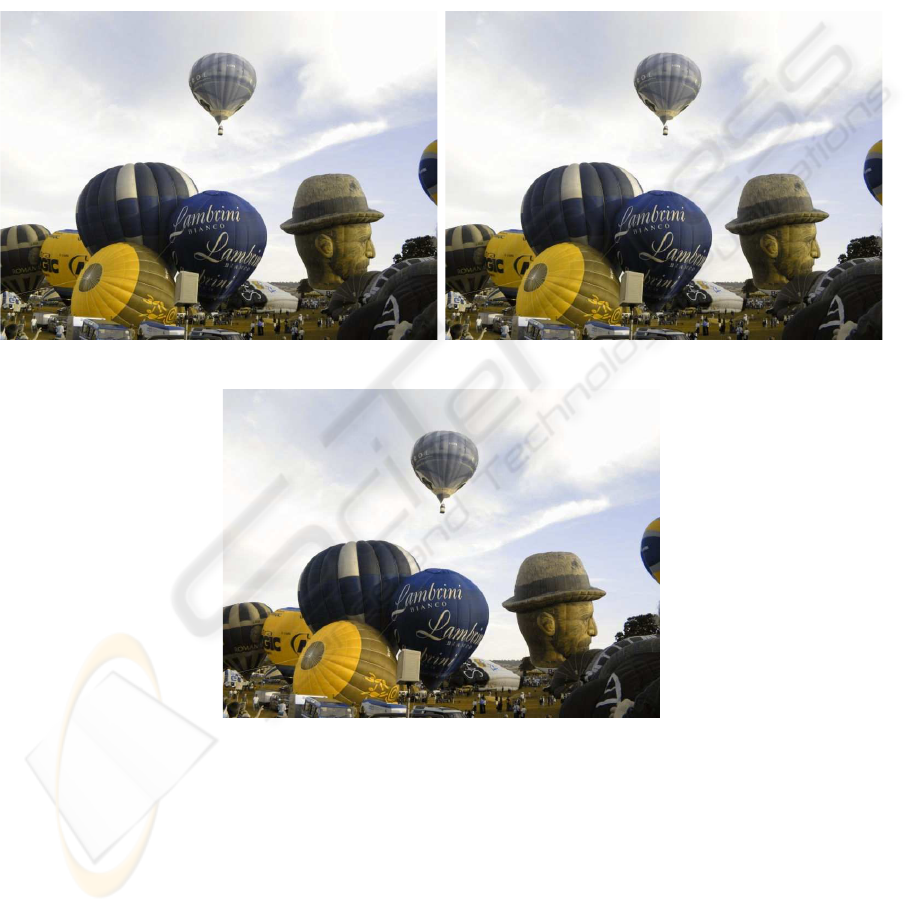
(a) Our algorithm (b) Meyer’s algorithm
(c) Brettel’s algorithm
Figure 5: The protanopic results of our algorithm and other algorithms applied on Figure 4(a).
VISUAL SIMULATING DICHROMATIC VISION IN CIE SPACE
97
