A DATA MINING APPROACH TO LEARNING PROBABILISTIC
USER BEHAVIOR MODELS FROM DATABASE ACCESS LOG
Mikhail Petrovskiy
Faculty of Computational Mathematics and Cybernetics, Moscow State University, Vorobjevy Gory, Moscow, Russia
Keywords: User behavior modeling, Data mining, Da
tabase access logs, Probabilistic models.
Abstract: The problem of user behavior modeling arises in many fields of computer science and software engineering.
In this paper we investigate a data mining approach for learning probabilistic user behavior models from the
database usage logs. We propose a procedure for translating database traces into representation suitable for
applying data mining methods. However, most existing data mining methods rely on the order of actions
and ignore time intervals between actions. To avoid this problem we propose novel method based on
combination of decision tree classification algorithm and empirical time-dependent feature map, motivated
by potential functions theory. The performance of the proposed method was experimentally evaluated on
real-world data. The comparison with existing state-of-the-art data mining methods has confirmed
outstanding performance of our method in predictive user behavior modeling and has demonstrated
competitive results in anomaly detection.
1 INTRODUCTION
User behavior modeling is one of the most important
and interesting problems needed to be solved when
developing and exploiting modern software systems.
By user behavior modeling we mean discovering
patterns of user activity and constructing predictive
models based on precedent behavior information.
These models allow forecasting next user action on
the basis of the current activity. Primarily such
technique was oriented to the commercial
applications in recommendation systems (Sarwar,
2001), (Manavoglu, 2004). At present time the area
of its application is significantly wider. These
methods play a great role in computer security
systems (Ghosh, 1999), (Lee, 1998), where they are
used for detecting malicious or unqualified user
actions. Besides, recently user behavior modeling is
applied for analysis, understanding and optimization
of the architecture and business logic of various
software systems. Models of user behavior can help
to improve the UI usability, to optimize the database
structure and data cashing strategy, to detect hidden
use-cases, etc. Traditionally, data mining techniques
are used for constructing user behavior models. The
process of user behavior modeling can be presented
as KDD-process (Knowledge Discovery in
Databases), defined as extracting nontrivial,
previously unknown and potentially useful
information from large sets of data (Piatetsky-
Shapiro, 1996):
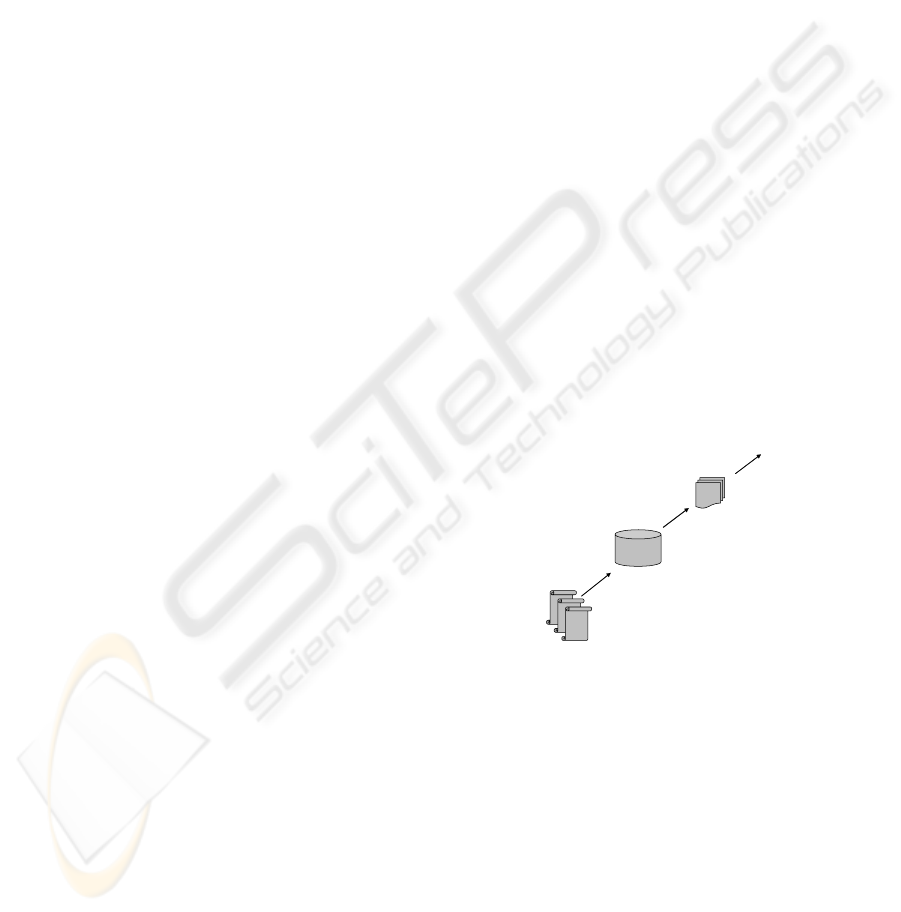
Trace Log
Files
Data
stora
g
e
Trace data preprocessing:
cleaning, normalization,
transformation, consolidation
Data mining
methods
User
behavior
m
User models
validation,
visualization and
interpretation
Knowledge
ode
l
s
Figure 1: User behavior modeling as KDD process.
On the first stage, necessary data is extracted
from log-files, transformed into unified
representation suitable for analysis, and stored in the
data warehouse. Then data mining techniques are
applied for building behavior models. Finally, the
models are validated and interpreted by an expert. It
is necessary to outline such features of the
information sources used for user behavior modeling
as large volume, heterogeneity and complicated
structure of data coming from log-files. But the most
significant features are temporal nature of the data
and ordering of user actions. The source log-files
can be of different levels – from high-level
application logs (Sarwar, 2001) and web access logs
73
Petrovskiy M. (2006).
A DATA MINING APPROACH TO LEARNING PROBABILISTIC USER BEHAVIOR MODELS FROM DATABASE ACCESS LOG.
In Proceedings of the First International Conference on Software and Data Technologies, pages 73-78
DOI: 10.5220/0001321200730078
Copyright
c
SciTePress

(Manavoglu, 2004) to low-level system calls traces
(Ghosh, 1999). In this paper, we consider the
intermediate level, in particular the database access
logs. User behavior modeling on this level has not
been well studied yet and it was considered mainly
in the context of optimization of database server
settings (Dan, 1995). Though, from our point of
view, user behavior models built on database level
can be very useful in other tasks as well, because
nowadays many modern software systems use
relational SQL databases as information storage and
all important user actions leave a trace in the
database access log.
The paper is organized as follows. In Section 2
we give the formal problem statement of
probabilistic user behavior modeling. In Section 3
we present our new approach based on classification
method of autoregressive type and specially
designed empirical feature map of data from
structured log-files into finite dimensional metric
space. This mapping allows taking into account both
time and frequency of user actions. Section 4 is
devoted to experiments and comparative analysis on
real-world data. In the final section we formulate
main results and contributions of our research.
2 PROBLEM DEFINITION
Traditional probabilistic statement of the user
behavior modeling problem is the following
(Manavoglu, 2004). Precedent information on the
activity of a user U is given in the form of ordered
sequences of actions
21 N
. Model
of user behavior is defined as the following
probabilistic function:
),...,,()( AAAUH =
))(),(|( UHUSAP
next
.
(1)
It defines the probability that next user action will be
under conditions that current user activity is
described by the sequence of actions
SKSS
and historical activity of
the user is defined by H(U).
next
A
),...,,()(
21
AAAUS =
Practically all existing methods of constructing
models (1) are based on the following propositions.
Any user action can be coded as a symbol from
some finite alphabet
Ω
∈
i
A
. And a training set
train
is formed from the
H(U), where are all available
subsequences. Usually
i
are selected
consequently by a sliding window method, but
sometimes application-oriented methods are used
(e.g. sequences may correspond to user sessions).
)}(),...,({)(
1
UHUHUH
L
Probabilistic models (1) can be applied for
solving practical tasks of next action prediction;
detecting anomalies (unexpected user actions); and
discovering patterns and frequent episodes of user
activity. For the last problem, it is difficult to
indicate universal performance evaluation measure
since representation of the patterns and frequent
episodes depend on the used data mining technique.
For the first two problems general performance
evaluation measures do exist. Forecasting of next
user action is performed according to the
formula derived form (1) with the use of Bayes rule:
next
A
))(),(|(maxarg UHUSAPA
A
next
Ω∈
=
.
(2)
In this case, the performance evaluation measure is
hit ratio that is a proportion of correctly predicted
actions to total number of actions. For the anomaly
detection, a threshold cutting (confidence level)
α
should be specified. Then user action is
considered to be anomalous if:
next
A
))(),(|(|{
α
>Ω∈∉ UHUSAPAA
next
.
(3)
Precision of anomaly detection is estimated by
standard coefficients (Lee, 1998): detection rate and
false positive rate. They depend on the threshold
value and that is why the final comparison is
performed with the help of ROC-curves (Maxion,
2004) representing the mutual dependence of these
coefficients.
The most popular traditional data mining
techniques applied for constructing probabilistic
model (1) are association rules (Liu, 1998),
sequential models (Manavoglu, 2004) and
autoregressive classification methods (Debar, 1992).
Although these methods are widely used and
demonstrate acceptable results in many practical
applications they all can be criticized for calculation
complexity; using a priori set critical parameters;
and either poor accuracy with good model
interpretation or, on the contrary, high accuracy with
non-interpreted models. In addition to these
disadvantages, almost all these methods rely on
order of actions and ignore time between actions.
We think that in the case of database logs analysis it
is significant defect for the following reasons. There
exists tendency that recent actions have more
influence to next possible action then those
happened long time ago. Besides, there might be
situations, when single db login is used by several
different persons simultaneously (for example, most
public web systems do not provide individual db
logins for their users). In such case the sequences of
actions in log files will be mixed up that will break
the order of actions. The only thing to do here is
including time feature in the model.
=
)()( UHUH
i
⊂
)(UH
ICSOFT 2006 - INTERNATIONAL CONFERENCE ON SOFTWARE AND DATA TECHNOLOGIES
74

3 OUR APPROACH
Before we turn to the problem of constructing
function (1) we need to define the structure of
database access log in the form of sequences of
actions
i
. Most of database access logs consist
of records of similar structure:
Ω∈A
featuresothertimesqleventiduser ,,,,
,
where user id is user login; event is a type of event
(e.g., start or finish of a query execution); sql is
SQL text of a query; time is a timestamp; other
features can be divided into execution group that
includes numerical characteristics of query
execution (e.g. number of read/write operations,
duration, etc); and identification group with discrete
characteristics of query such as identifiers of client
process, server’s process, user aliases, etc. Thus the
problem is to map such structure into a finite
alphabet. We suggest the following procedure.
DB Access Log Pre-processing Procedure:
Step 1. “Uninteresting” attributes
reduction.
Step 2. Numeric attributes
descritization.
Step 3. Extracting templates
(skeletons) from SQL statement.
Step 4. Mapping discrete attributes
combination to finite alphabet
Ω
.
On the first step we exclude attributes that are not
interesting for analyzing. For example, db server
process id, as a rule, is not interesting for the model.
On the second step the rest numerical attributes are
discretizied by some unsupervised discretization
algorithm. In particular, we use equal frequency
interval method with small (3-10) number of
intervals. On the next step SQL statement text is
processed. We extract its so called skeleton or, in
other words, template, that presents the query syntax
with removed user parameters. We use the approach
similar to (Valeur, 2005). SQL statement is
converted into the sequence of tokens, where each
token has either keyword type (for SQL language
keywords) or name type (for db related names, i.e.
table names, fields, stored procedure, etc.). Let us
clarify this idea on the example. Assume we are
given the following query:
SELECT FROM USERS WHERE NAME=’Bob’ AND
CITY=’London’
We convert it to the sequence of tokens:
(SELECT,keyword)(FROM,keyword)(USERS,
name)(WHERE,keyword)(NAME,keyword)(AND,
keyword)(CITY,name)
Then each unique template gets its unique identifier.
Thus, before the fourth step the initial log file record
has the form of vector of discrete attributes, where
each attribute is either discrete attribute of the initial
record or SQL template identifier, or interval id of
discretizied initial numeric attribute. Records with
the same SQL template, the same discrete attributes
and close numeric attributes have the same
representation, i.e. the same combination of resulting
discrete attributes. Such representation of the similar
records identifies the possible action, to which a
unique symbol from the alphabet is assigned. In
this way the alphabet
Ω
Ω
determines the set of all
possible user actions. At the first glance the
suggested procedure can be criticized for the
possibility of unbounded growth of the size of the
alphabet
Ω
. In practice, for production systems
being in stable exploitation, it is found that the
growth comes to stop quickly enough, just for few
hundreds. Besides, number of different possible
actions can be reduced by grouping them, using
clustering or frequent episodes or expert’s domain
knowledge.
After applying this procedure for mapping db
access logs structures into the alphabet
Ω
we can
use traditional data mining methods based on
association rules, sequential models or
autoregressive classification. However, as we
outlined before, these methods do not take time
feature into account, only the order. To avoid this
problem we propose novel approach. Its main idea is
constructing empirical feature map
ϕ
that explicitly
maps an arbitrary sequence of symbols from
Ω
with timestamps into a finite-dimension metric space
H. First of all, we need to extend the representation
of user actions by adding time labels to them. Then
each action from S(U) or H(U) is described by the
pair
TimetmA
×
Ω
∈
),(
. Let us formulate the basic
assumptions for
ϕ
mapping:
- recently performed actions have more influence on
the upcoming action than actions performed
long time ago;
next
A
- requently performed actions have more influence
on the upcoming action than actions
performed rarely.
next
A
Appropriate background for constructing such
mapping comes from the theory of potential
functions (Aizerman,1970). We assume that any
possible action
Ω
∈
i
A
has its own potential at any
moment t. This potential is being reduced
proportionally to the time passed from the moment
when the action was performed. The exact form of
this reduction is given by a priori chosen potential
function
ℜ→
×
TimeTimePf :
. If the sequence
contains the same actions in different times, in
accordance to the potential function theory, their
A DATA MINING APPROACH TO LEARNING PROBABILISTIC USER BEHAVIOR MODELS FROM DATABASE
ACCESS LOG
75

potentials are summed up. In this manner, we define
the mapping of the sequence (of an arbitrary length)
of user actions with timestamps into the real vector
space of dimensionality
Ω=L
:
Ω∈
>∈
⎟
⎟
⎠
⎞
⎜
⎜
⎝
⎛
=
∑
A
tmtUHtmA
tmtPftUH
0
),(),(
00
),()),((
ϕ
.
(4)
According to (4) the internal “state of a user
activity” at any moment t is described by the set of
Ω=L
potentials
)),((
nA
tUH
ϕ
. It allows
considering both time and frequency features of
previous actions.
Functions from RBF class are convenient for use
as potential function Pf (4). Potential functions of
this type depend only on time interval between
actions in series and do not depend on exact time
moments. In our experiments we use exponential
function
)exp(),( yxyxPf −−=
σ
, where
parameter
σ
controls the speed of the past actions
influence vanishing, i.e. how quickly potentials go
down. Besides, such RBF can be efficiently
calculated for continuous sequence using the
recursive formula (where
0)0( =
A
ϕ
):
⎪
⎩
⎪
⎨
⎧
=+
≠
=
−
−
−−
−
−−
−
n
tt
nA
n
tt
nA
nA
AAet
AAet
t
nn
nn
,1*)(
,*)(
)(
)(
1
)(
1
1
1
σ
σ
ϕ
ϕ
ϕ
.
(5)
The feature mapping function (4) allows a
sequence of actions to be presented as a feature
vector from L-dimensional real vector space. At any
moment the “state of the user activity” is
unambiguously described by the given vector.
Therefore, it is naturally to use the approach based
on autoregressive classification methods for
constructing user behavior models. In such case a
training set is represented as the set of pairs
Ω×ℜ∈
Ω
Ω∈
t
AA
At ,))((
ϕ
:
t
t
AAtrain
AtUH },))(({)( ><=
Ω∈
ϕ
(6)
Then learning algorithm is used to construct a multi-
class probabilistic classifier of the form:
Ω→ℜ
Ω
:
)(UH
that estimates probabilities (1) for
any given state
F
Ω∈AA
t))((
ϕ
:
))))(((())(),(|(
)(
t
AAUH
t
AtFPUHUSAP ==
Ω∈
ϕ
(7)
Since almost all probabilistic multi-class
classification method can be applied, when the input
space is finite-dimensional real vector space, we
concentrate our attention on the two main criteria –
accuracy of prediction and understandability of the
obtained model for a human expert. From our point
of view, decision trees (Hastie, 2001), (Quinlan,
1987) have the best balance between accuracy and
interpretation power among all classification
methods. Tree based methods partition the input
feature space into a set of rectangular regions
n
, and fit a simple model in each one.
Usually this simple model is a class probability
distribution. Applying a standard algorithm, e.g.
CART (Hastie,2001) or C4.5 (Quinlan,1987) to the
training set (6) we come to the model that can be
represented as a tree, where each terminal node m is
connected with a region described by the
following predicate system:
RRR ,...,,
21
m
R
IF AND …
))((
upper
AiAi
low
Ai
CtC <<
ϕ
AND …
))((
upper
AjAj
low
Aj
CtC <<
ϕ
THEN
mAA
Rt
∈
Ω∈
))((
ϕ
(8)
Here
Aj
and
Aj
are constants bounding
possible value of the potential for action
low
C C
upper
Ω
∈
j
A
at
the moment t. The distribution of class probabilities
is associated with each region
m
. For each possible
action
R
Ω
∈
t
A
we take probability (7) as a ratio of
samples presented in the
m
and having class
R
t
A
( ) to the total number of samples in
( ):
)(
m
A
RCount
t
m
R
()
m
Count R
)(
)(
)))((|(
m
m
A
mAA
t
RCount
RCount
RtAP
t
=∈
Ω∈
ϕ
(9)
Class probabilities (9) are considered as estimates
(7), and the whole procedure looks as follows.
User Behavior Modeling Procedure:
Preparation process:
Step 1: For any given db trace find
Ω
and prepare historical data H(U) using
the proposed log translation procedure.
Step 2: Choose potential function type
and parameters for feature map (4).
Step 3: Convert H(U) into training set
(6) using feature map (4).
Training process:
Calculate regions (8) and class
probabilities (9) using decision tree
algorithm (e.g. CART or C4.5).
Prediction process:
At any moment t for any current user
actions sequence do the following:
Step 1: Translate the sequence into S(U)
using the proposed log translation
procedure.
Step 2: Calculate potentials
Ω∈AA
t))((
ϕ
using (4).
Step 3: For each
Ω∈AA
t))((
ϕ
use (8) to
find the target region
m
and use (9)
to estimate probabilities (7) that
define model (1).
R
ICSOFT 2006 - INTERNATIONAL CONFERENCE ON SOFTWARE AND DATA TECHNOLOGIES
76
It should be noticed that proposed model has simple
and meaningful interpretation for a human expert. It
can be visualized as a decision tree with
distributions of possible actions in terminal nodes.
Its semantics is described by a system of rules in the
form: “IF at the moment t potentials of the previous
user actions are in specified ranges THEN next user
action would be A with probability P”.
4 EXPERIMENTS
In this section the results of experimental
performance evaluation are presented. The goals of
experiments are to check how traditional data
mining methods (sequential patterns and association
rules) work on real-world data with our proposed
SQL-trace translating procedure and to compare
performance of existing methods to our novel
method, based on time-dependent feature mapping
and decision tree learning algorithm. We consider
two scenarios: “next action prediction” and
“anomaly detection”.
Below we denote our method as Pf-DT that
stands for “Potential function feature space with
Decision Tree”. We use recursive exponential RBF
(5) as a potential function in the feature map (4),
time is calculated in milliseconds,
1000=
σ
. In our
method, we use С4.5 learning algorithm with
probabilistic cutting threshold (Quinlan, 1987). As
competitors we tried Expectation-Maximization
based sequence clustering algorithm (Seq-EM) and
Apriori association rules mining algorithm (A-
Rules). Both algorithms are implemented in MS
2005 SSAS (Tang, 2005).
We run experiments on real-world data, collected
from MS SQL Server trace logs and generated by
real-world banking intranet application. The task of
the application is registering, evaluating and
processing consumer credit requests. An operator
enters and processes customer’s requests in the
system. Several real persons usually work
simultaneously under the same operator’s login. We
collected traces of operators’ activity in one branch
of the bank during two days, one day – for training,
another for testing. There are about 30000 SQL
queries per day. Applying SQL trace transformation
procedure we consider only SQL query text,
execution time, duration and number of read/write
operations in a query. As a result we obtain the
alphabet size
Ω=L
=65.
The first series of experiments was for “next
action prediction” scenario. To study how the size of
the training set affects the model precision we
prepared three training sets of different sizes: 2
hours, 4 hours and 8 hours (the whole working day)
of activity. The testing dataset is 8 hours of activity
in another day. Training time of all algorithms in
these experiments was nearly the same, about one
minute or less. The experimental performance
results (hit ratio) are presented in the table below:
Table 1: “next action prediction” experiments.
Experiment Settings Algorithm hit ratio
Training: 8h (33856 records) Pf-DT 85.76%
Testing: 8h (28060 records) Seq-EM 59.72%
No anomalies A-Rules 42.47%
Training: 4h (16180 records) Pf-DT 79.77%
Testing: 8h (28060 records) Seq-EM 43.72%
No anomalies A-Rules 41.65%
Training: 2h (4039 records) Pf-DT 51.91%
Testing: 8h (28060 records) Seq-EM 21.07%
No anomalies A-Rules 8.6%
In this scenario our method dramatically
outperforms its competitors. Another thing is that
accuracy of all algorithms growths with the size of
the training set, though the difference between 4 and
8 hours is not significant. It means that user activity
in the investigated application is very stable and we
do not need large datasets to train.
The second series of experiments is devoted to
the investigation of the problem of anomaly
detection. To estimate the ability of the algorithms to
discover anomalies we have added to the testing
dataset 10% of randomly generated anomalous
actions (possible actions but in a random places).
We also tried 1% and 5% but the results turned out
to be very similar to 10%, that is why (and because
of space limitation) we leave only results for 10%.
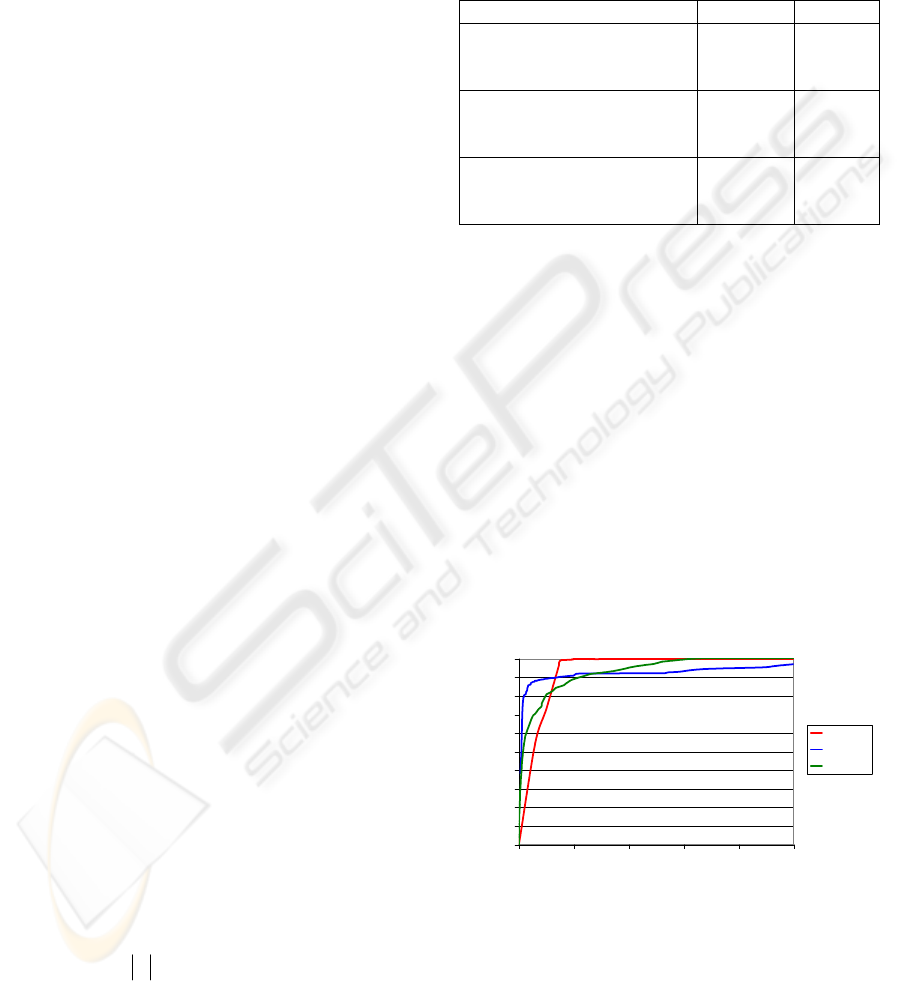
They are presented on ROC curve chart below:
0
10
20
30
40
50
60
70
80
90
100
0 1020304050
False Positive Rate (%)
Detection Rate (%)
Pf-DT
Seq-EM
A-Rules
Figure 2: ROC curve for anomaly detection task with 10%
anomalies in the testing set (31912 records).
However, unlike other methods, our method reached
the detection rate of 100% the corresponding false
positive rate is too big (about 7%). In the area of
smaller false positive rates Seq-EM and even A-
A DATA MINING APPROACH TO LEARNING PROBABILISTIC USER BEHAVIOR MODELS FROM DATABASE
ACCESS LOG
77

Rules outperformed our method. Outstanding
performance in the “next action prediction” task and
average results in anomaly detection mean that
proposed method very precisely guesses the most
expected action, but not enough accurately estimates
the set of all expected actions (that Seq-EM and A-
Rules do). It means that the mechanism of
probabilities estimation used in the decision tree
algorithm (9) is not perfect for the anomaly
detection task. In the future research we will check
the anomaly detection ability of the proposed
approach with other probabilistic multi-class
classification algorithms, e.g. with kernel methods
(Hastie, 2001), and we hope to obtain outperforming
results in this scenario as well.
5 CONCLUSIONS
The main contributions of this paper can be
summarized as following:
1. New type of data source for user behavior
modeling has been considered. This is the database
access log consisting of traces of SQL queries
executed by users. It is promising information
source because the major part of modern software
systems use relational databases as information
storage, and usually all critical user actions leave a
trace in database access logs.
2. Simple but effective procedure for translating
SQL traces structures into a finite alphabet of
symbols has been proposed. It allows analyzing
database access log data with traditional data mining
techniques such as sequential mining and association
rules mining methods.
3. Novel method for mining probabilistic user
behavior models has been formulated. Unlike other
existing data mining methods it incorporates time
feature in the user model. The empirical feature
map, motivated by potential functions theory, has
been proposed for that. Combining this feature map
with decision tree algorithm we obtain new method
with following advantages: it is precise enough; it
takes into account time intervals between user
actions; it gives understandable for a human expert
interpretation of generated behavior models in the
form of “IF…THEN” rules.
4. Experimental performance evaluation on real-
world data has been conducted. It has demonstrated
that database access logs can be successfully used
for user behavior modeling and reliable models can
be constructed. In these experiments, our proposed
method has demonstrated outstanding results in the
“next action prediction” scenario and competitive
results in “anomaly detection” scenario.
ACKNOWLEDGEMENTS
This research is supported by grant of RFFI (Russian
Foundation for Basic Research) # 05-01-00744 and
by grant of the President of Russian Federation MK-
2111.2005.9.
REFERENCES
Aizerman, M.A., Braverman, E.M., & Rozonoer, L.I.,
(1970). Method of Potential Functions in the Theory of
Learning Machines. Nauka, Moscow (in Russian).
Dan, P., Yu, S. & Chung, J.-Y. (1995). Characterization
of database access pattern for analytic prediction of
buffer hit probability. VLDB J., 4(1):127--154.
Debar, H., Becke, M. & Siboni, D. (1992). A neural
network component for an intrusion detection system.
In IEEE Symp. on Security and Privacy, pp. 240--250.
Ghosh, A., Schwartzbard, A. & Schatz, M. (1999).
Learning Program Behavior for Intrusion Detection. In
1th USENIX Workshop on Intrusion Detection and
Network Monitoring. Florida, CA.
Hastie, T. (2001). The Elements of Statistical Learning,
Springer, New York.
Lee, W. & Stolfo, S. (1998). Data mining approaches for
intrusion detection. In 7th USENIX Security
Symposium (SECURITY'98).
Liu, B., Hsu, W. & Ma, Y. (1998). Integrating
classification and association rule mining. In 4th Int.
Conf. on KDD and Data Mining, pages 80–96.
Manavoglu, E., Pavlov, D. & Giles, C. (2003).
Probabilistic User Behavior Models. In IEEE Int.
Conf. on Data Mining (ICDM-03). Melbourne, FL.
Maxion, R. & Roberts, R. (2004). Proper Use of ROC
Curves in Intrusion/Anomaly Detection, Tech. report
CS-TR-871, University of Newcastle upon Tyne.
Piatetsky-Shapiro, G., Fayyad, U., Smyth, P. &
Uthurusamy, R. (1996). Advances in Knowledge
Discovery and Data Mining, AAAI Press/MIT Press.
Quinlan, J. (1987). Generating production rules from
decision trees. In 10th International Joint Conference
on Artificial Intelligence, pp. 304--307.
Sarwar, B., Karypis, G., Konstan, J. & Riedl, J. (2001).
Item-based Collaborative Filtering Recommendation
Algorithms. In 10th International World Wide Web
Conference, pp. 285-295
Tang, Z.-H. & MacLennan, J. (2005). Data Mining with
SQL Server 2005, Wiley Publishing.
Valeur, F., Mutz, D. & Vigna, G. (2005). A Learning-
Based Approach to the Detection of SQL Attacks. In
IEEE Conf. on Detection of Intrusions and Malware &
Vulnerability Assessment, pp. 123-140.
ICSOFT 2006 - INTERNATIONAL CONFERENCE ON SOFTWARE AND DATA TECHNOLOGIES
78
