
A DETECTION METHOD OF STAGNATION SYMPTOMS BY USING
PROJECT PROGRESS MODELS GENERATED FROM PROJECT
REPORTS
Satoshi Tsuji, Yoshitmo Ikkai, Masanori Akiyoshi
Graduate School of Information Science and Technology
Osaka University
Suita, Osaka, Japan
Keywords:
Text mining, stagnation symptom, knowledge management, project management, modeling.
Abstract:
The purpose of this research is to extract “stagnation symptoms” from progress reports related to a research
project. A stagnation symptom is defined in a portion where remarkable stagnation is seen during the progress
of a project. Specifically, according to project managers, stagnation symptoms can be classified into the
following three kinds: first one is a project bottleneck grasped from one document; the second is clarified by
comparing it with the most recent document; and the third is clarified from changes to a working object in a
series of documents. We propose a method of extracting stagnation symptoms using the structural analysis
of a project’s progress. A progress model that is a structural chart to expressing the progress of a project is
generated from documents with label tags, which indicate prior contexts or attributes. This progress model has
the following features: a multilevel layer model using detailed degrees and situation analysis using color, and
relation analysis of these details and basis using color propagation. Stagnation symptoms are automatically
extracted by applying stagnation symptom extraction rules to the progress model. This proposed method
was been applied to a set of real progress reports. It could extract stagnation symptoms that were extracted
manually.
1 INTRODUCTION
Research projects are planned and enacted at enter-
prises and universities every day. In progress of
a projects, progress management greatly influences
the success of a project(Takemoto, 2005; Sakthivel
and Kalyanaraman, 1993). At this time, an enor-
mous array of varied documents such as business
daily reports, weekly reports, and progress confirma-
tion minutes meeting are drawn up and circulated. To
manage progress, management staff must examine all
these documents(Paul and Khan, 1999; Kloppenborg
and Petrick, 2004). If a project has some problems,
they need to think about appropriate measures. How-
ever, looking for problem that is not necessarily de-
scribed in an enormous number of documents requires
a large amount of labor. Therefore, there is a strong
need to develop a system that automatically extracts
portions of a problem about the progress of a project
from progress reports.
In existing research, a method that accumulates
data, such as similar failure cases in the past, has been
proposed and used for project management(Tsukuda
and Morita, 2004; Y. Uchida and Tatebe, 2005). How-
ever, there is an assumption that data of similar cases
in the past has been accumulated in this research. In
any case, these methods are not effective if there is no
such data.
In our research, a portion where remarkable stagna-
tion is seen during the progress of a project is defined
as a “stagnation symptom”. Stagnation symptoms are
extracted using the following method. First, label tags
that show attribute information such as ID, work con-
tent, and so on are added to each sentence of an input
documents. Next, a progress model that is a structural
chart that expresses the progress of a project is gener-
ated from documents with label tags. Analyzing the
structure of the generated model and applying stagna-
tion symptom extraction rules to the progress model
then extract stagnation symptoms.
2 STAGNATION SYMPTOMS
EXTRACTION
2.1 Stagnation Symptoms
A portion where remarkable stagnation is seen in a
project progress is defined as a “stagnation symp-
165
Tsuji S., Ikkai Y. and Akiyoshi M. (2006).
A DETECTION METHOD OF STAGNATION SYMPTOMS BY USING PROJECT PROGRESS MODELS GENERATED FROM PROJECT REPORTS.
In Proceedings of the First International Conference on Software and Data Technologies, pages 165-169
DOI: 10.5220/0001315401650169
Copyright
c
SciTePress
tom”. Figure 1 shows a typical example in which
project managers consider stagnation symptoms when
reading documents.
1st report
1.Work report
3.Impression
2.Problem in the future
•I want to investigate the
background firmly, and
to prove it.
•Problem of the research
was set.
•Background investigation
•Design of approach
1.Work report
3.Impression
2.Problem in the future
•It is necessary to still
investigate the problem
setting.
•An approach was set.
•There is still an opaque part
though the background was
investigated.
•Examination of approach
•Background is continuously
investigated.
1.Work report
3.Impression
2.Problem in the future
•An approach is not
effective under a present
problem setting.
•Review of problem setting
•Background investigation
•I want to find the condition
that the approach becomes
effective.
S-1
S-2
S-3
3rd report2nd report
Figure 1: An example of stagnation symptom in a document
group.
Stagnation symptoms are categorized into the fol-
lowing three kinds:
• One related to the fundamental aspects of project
progress detected from one document. (cf. S-1 in
Figure 1)
• One detected by comparing documents with the
most recent document. (cf. S-2 in Figure 1)
• One detected from changes to a working object in
a series of documents. (cf. S-3 in Figure 1)
In this research, the fundamental portion is defined
as an important portion that is a fundamental part of
a project’s progress. On the other hand, the detailed
portion is defined as a portion that describes funda-
mental contents in detail.
2.2 Stagnation Symptoms Extraction
In extracting the stagnation symptoms listed in the
preceding section, the following problems occur:
• It is difficult to extract stagnation symptoms if doc-
uments are simply compared and analyzed using
plain texts.
• It is necessary to judge whether a detailed portion is
related to the fundamental aspects of the project’s
progress.
• It is not possible to use a method that uses a past
failure case to extract stagnation symptoms if there
is no failure case.
Therefore, we think that progress of a project
should be modeled to solve problems listed above.
This model is named the “progress model”. Stag-
nation symptoms are extracted by analyzing the
progress of the project with this model. The following
functions are given for this progress model:
• A multilevel layer model using a degree of detail
• Situational analysis using color and relational
analysis of details and fundamentals using color
propagation
• The extraction of stagnation symptoms using rules
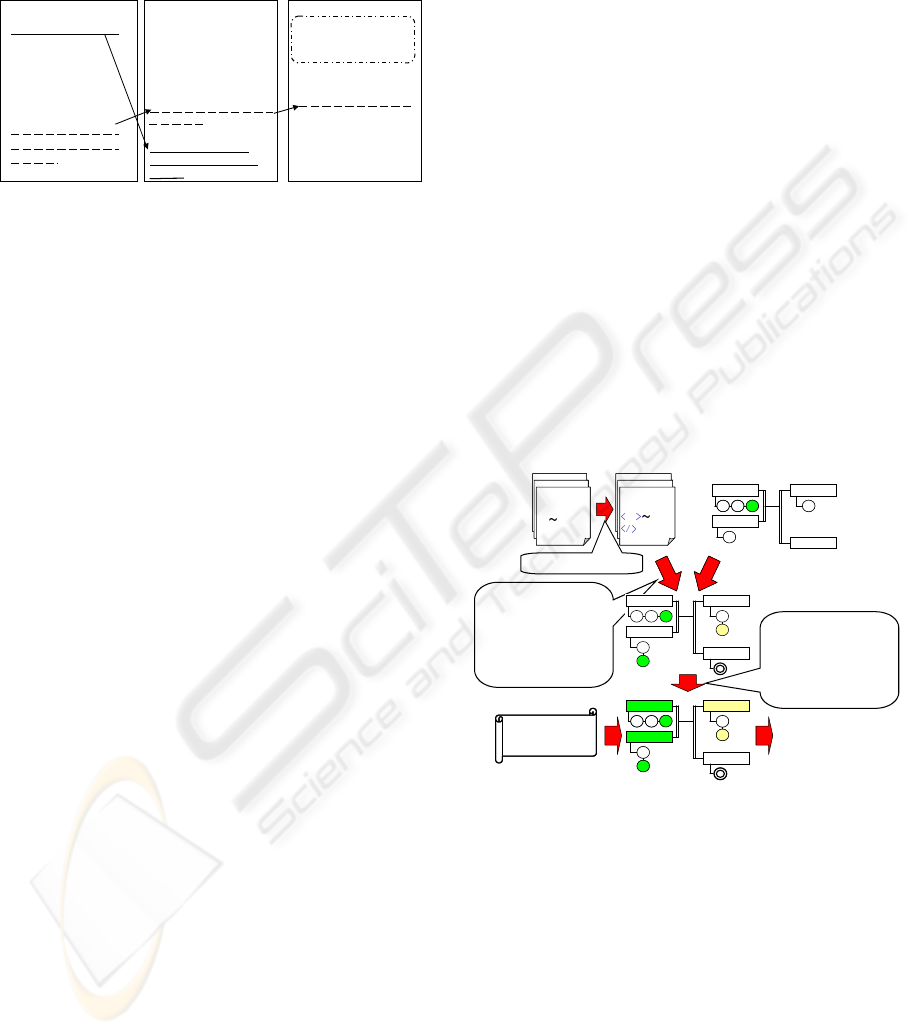
Thus, stagnation symptoms are extracted by the
flow shown in Figure 2. First, “label tags” that show
attribute information such as work content, ID, and
pointers to a related sentence are added to each sen-
tence for each meaning within an input document. A
“progress model”, which is a structural chart that ex-
presses the progress of a project, is generated from a
document with label tags. At this time, a target doc-
ument with label tags and the most recent progress
model are input. Adding information in the input doc-
ument to the most recent progress model generates a
new progress model. When the project starts, obvi-
ously the most recent progress model doesn’t yet ex-
ist. Instead, a model generated beforehand is input.
Next, we apply “color propagation”, which analyzes
colors used in the model to understand how a detailed
portion influences fundamental portion. Finally, we
extract stagnation symptoms by applying three stag-
nation symptom extraction rules to a progress model
that has propagated color.
Extraction of
problem symptom
report
…
…
…
report
…
…
…
Original document
…
…
report
…
…
report
The most recent progress model
Extraction rulesExtraction rules
A progress model is
generated by adding
information in the
input document to the
most recent progress
model.
In order to analyze how
a detailed portion in a
model influences core
portion, color of nodes
are propagated.
Giving label tags
Figure 2: Flow of extracting stagnation symptom.
2.3 Definition of a Progress Model
In this model, the following two kinds of nodes are
used to distinguish fundamental or detailed descrip-
tions and to indicate project progress:
• Status node
A fundamental node that shows the work procedure
of a project that is given prior to a progress model
being generated. This node is drawn in a rectangle,
as shown in Figure 2.
• Label node
This is a node that shows the detailed work for a
ICSOFT 2006 - INTERNATIONAL CONFERENCE ON SOFTWARE AND DATA TECHNOLOGIES
166
status node. This node is added by referring to a
sentence of an input document. This node is drawn
in a circle, as shown in Figure 2.
The status node is a superior position node indicat-
ing the fundamental portion of project. On the other
hand, a label node is given as a subordinate position
node of a status node.
Steps in a project progress such as “research pur-
pose” and “approach” are written in the rectangle of
a status node. The sentence number of an input sen-
tence is written in the single circle of a label node. In
addition, a label node to a current work is drawn with
a double circle.
Labels are painted in four different colors ac-
cording to a content of the target sentences, for in-
stance, “red” is remarkable stagnation in the project’s
progress. Other colors are “white” as not-processed,
“green” as no stagnation, and “yellow” as more in-
spection.
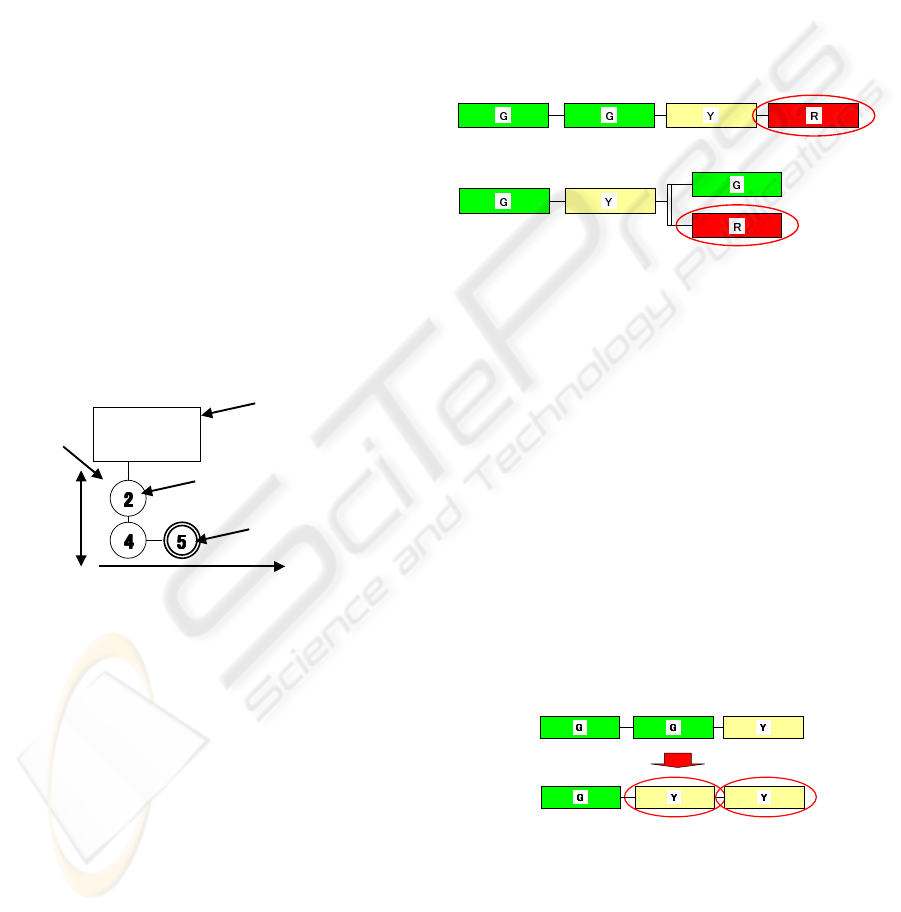
The model has two axes: The “description level
axis”, which is vertical and the “time axis”, which is
horizontal. A “description level axis” shows that near
a status node is fundamental and distant from a status
node is detail. Figure 3 shows a graphical representa-
tion of nodes.
Approach
2
3
status node
label node
level
working node
time
detail
core
Figure 3: Example of writing status node and label node.
If some processes are worked in parallel, they are
shown by two lines as an “AND connection”. On the
other hand, if some processes are worked in an alter-
native manner, they are shown by one line
2.4 An Extraction Method that Uses
Stagnation Symptom Extraction
Rule
After generating a progress model and propagating
color, stagnation symptoms are extracted. There are
three kinds of stagnation symptoms as described in
Section 2.1. In order to extract these stagnation symp-
toms, the following three rules are used:
2.4.1 A Rule that Extracts Stagnation
Symptoms Related to the Fundamental
Elements of Project’s Progress
This stagnation symptom is extracted by analyzing
one progress model. Specifically, if the color of a sta-
tus node connected with a series or an “AND connec-
tion” in a target progress model is red, it is thought
that stagnation symptoms related to the fundamental
elements of project’s progress exist, as shown in Fig-
ure 4. Thus, a sentence in a label node that causes a
status node to be red using color propagation is ex-
tracted as a stagnation symptom. This extraction rule
is defined as rule 1.
Figure 4: Example of stagnation symptom by rule 1.
2.4.2 A Rule that Extracts Stagnation Symptoms
Detected By Comparing the Most Recent
Document with a Target Document
This stagnation symptom is extracted by comparing
the color of a target progress model’s status node with
the color of the most recent progress model’s status
node. There are two cases. The first case is an oc-
casion when progress is not seen, such as from white
to white or yellow to yellow. The second case is an
occasion when state has deteriorated, such as from
green to yellow. We think that stagnation symptoms
exist at the portion that corresponds to these cases’ as
shown in Figure 5. Thus, a sentence in a label node
that causes the color deterioration of a status node is
extracted as a stagnation symptom. This extraction
rule is defined as rule 2.
recent progress model
target progress model
Figure 5: Example of stagnation symptom by rule 2.
2.4.3 A Rule that Extracts Stagnation
Symptoms Detected From the Changes of
a Working Target In a Series of Documents
This stagnation symptom is extracted by seeing the
position and situation of a working node in a target
A DETECTION METHOD OF STAGNATION SYMPTOMS BY USING PROJECT PROGRESS MODELS
GENERATED FROM PROJECT REPORTS
167
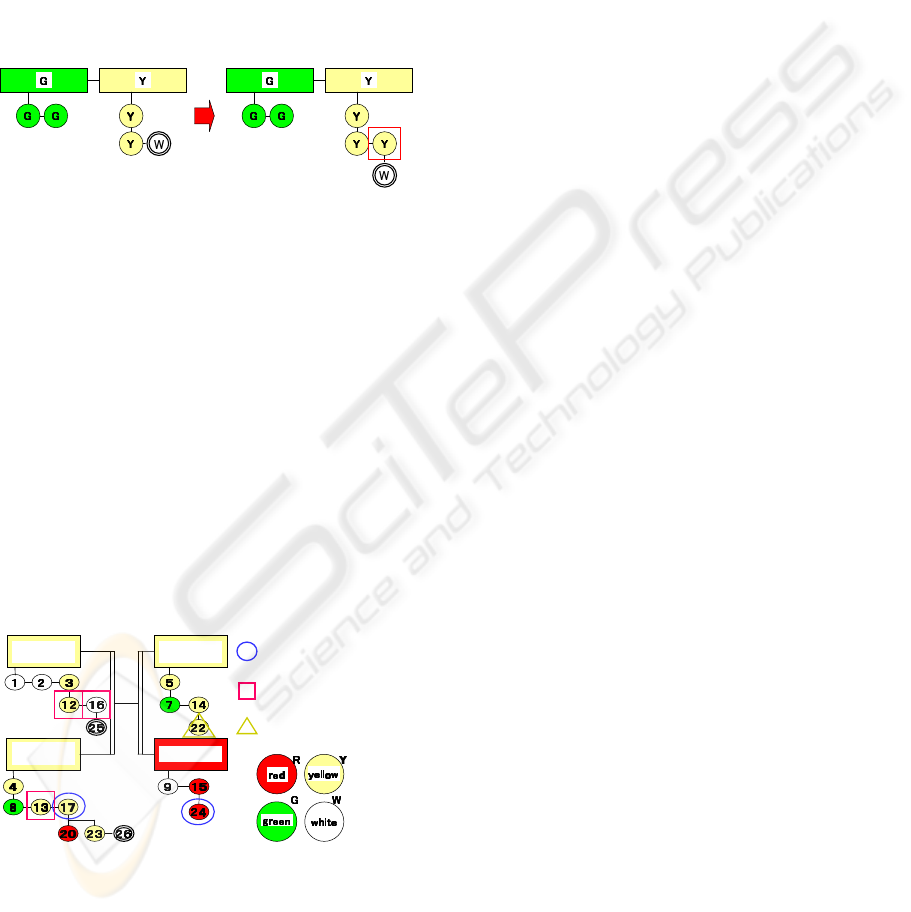
progress model and past progress models. Specif-
ically, when no progress can be seen in a working
node in a past progress model, it becomes a stagna-
tion symptom as shown in Figure 6. So, in a target
progress model, a case where a working node is con-
nected to the lower side or right side of working node
in a past progress model is a target of this rule. If the
color of the working node is any color except green,
a sentence in the last working node is extracted as a
stagnation symptom. This extraction rule is defined
as rule 3.
recent progress model target progress model
2 222
3 3
4
Figure 6: Example of stagnation symptom by rule 3.
3 EXPERIMENTAL RESULTS
We applied the proposed method to an actual failure
case in a research project at university, and extracted
stagnation symptoms. The data of the input docu-
ments used in the experiment are as follows:
• Kind of document: Regular progress report
• Style of report: One A4 size paper
• Volume: five sheets
In this experiment, stagnation symptoms extracted
with the proposed method are compared with ones
taken by hand. Figure 7 shows a generated progress
model and portions where stagnation symptoms were
extracted.
Manual and the proposed
method could extract.
Manual couldn’t extract though
the proposed method could extract.
Manual didn’t extract though
the proposed method extract
Research
purpose
Research
background
Approach
Basic
technique
2
3
2
3
2
3
2
3
4
4
4
Figure 7: The extracted stagnation symptoms from the
progress model.
Some of extracted sentences are shown below.
• Manual operation and the proposed method ex-
tracted the following elements:
– “It is necessary to design other approaches.”
Portion: The fourth sheet, Rule: rule-1
• The proposed method extracted the following ele-
ments that manual operation could not extract:
– “Differentiation with existing research”
Portion: The third sheet, Rule: rule-3
• The proposed method extracted the following ele-
ments that manual operation didn’t extract:
– “There is repetition with the product trend key
word”
Portion: The fourth sheet, Rule: rule-2
The proposed method could extract three stagna-
tion symptoms that the manual operation couldn’t.
These were the stagnation symptoms detected from
situation changes in the past, so the manual extrac-
tor had overlooked these stagnation symptoms. A
portion that the extractor judged weren’t stagnation
symptoms were extracted by the proposed method.
4 CONCLUSION
From the results of the evaluation experiments, we be-
lieve that it is possible to extract stagnation symptoms
from actual progress reports.
The following areas are our future work:
• Automatically adding label tags to the input docu-
ment data.
• Introducing the importance degrees of the stagna-
tion symptom
As for the automatic addition of the label tags, if
input progress reports are assumed to made with a
predefined format, we think that the label tag can be
added by reading words and analyzing the layered
structure of the sentences.
The proposed method figures out whether there are
stagnation symptoms or not. However, there are dif-
ferent degrees of stagnation symptoms. Thus, we
think that we need degree of importance to judge the
extracted stagnation symptoms as numerical values.
REFERENCES
Kloppenborg, T. and Petrick, J. (2004). Managing project
quality. In Engineering Management Review, IEEE
Volume 32, pp.86 - 90.
Paul, R.A, K. T. S. Y. and Khan, M. (1999). Software
metrics knowledge and databases for project manage-
ment. In Knowledge and Data Engineering, IEEE
Transactions on Volume 11, pp.255 - 264.
ICSOFT 2006 - INTERNATIONAL CONFERENCE ON SOFTWARE AND DATA TECHNOLOGIES
168

Sakthivel, T. S. and Kalyanaraman, V. (1993). Standards
processing in an integrated engineering system. In
Computing Systems in Engineering Volume 4, pp.295-
305.
Takemoto, S. (2005). Study for project management using
practical evm. In IPA Forum 2005 SEC conference.
Tsukuda, G. and Morita, Y. (2004). Using project status
reports to create and reuse project management know-
how. In in Proc. of 2nd International Conference on
Project Management, pp. 72-77.
Y. Uchida, G. Tsukuda, K. H. and Tatebe, K. (2005). Pro-
posal of a risk management support method using fail-
ure knowledge. In in Proc. of The Sino-Japan Work-
shop on Meta-synthesis and Creativity Support System
(CD-ROM).
A DETECTION METHOD OF STAGNATION SYMPTOMS BY USING PROJECT PROGRESS MODELS
GENERATED FROM PROJECT REPORTS
169
