
AN ALGORITHM EVALUATION TEST SUITE FOR BLIND SOURCE
SEPARATION PROBLEM
Marina Charwath, Imke Hahn, Sascha Hauke, Martin Pyka, Slawi Stesny,
Dietmar Lammers, Steffen Wachenfeld and Markus Borschbach
Dept. of Mathematics and Natural Science, Institute for Computer Science
Einsteinstr. 62, D-48149 M
¨
unster, Germany
Keywords:
Blind signal separation, automated evaluation, reference matlab based test engine and test data suite.
Abstract:
To ensure the integration and a systematic performance evaluation of the CubICA, the JADE and the EfICA
algorithm, a previously developed testsuite for BSS-problems is used. All the steps to perform a competition
of methods for source separation are part of a testsuite that supports the development and evaluation of blind
source separation (BSS) algorithms in a highly automated way. The concept of the testsuite is presented
and it is shown how the testsuite can be used to apply a selection of BSS-algorithms to four standard sub-
problems. To compare the performance of arbitrary algorithms on given problems the testsuite allows the
integration of new algorithms and testing problems using well defined interfaces. A brief example is given by
the integration of the FlexICA, EVD, EVD24 and the FastICA. Also the integration of CubICA, JADE and the
EfICA algorithm and the results achieved from automated tests and parameter optimizations will be described
in comparison.
1 INTRODUCTION
Given that in the last decade, the interest in Blind Sig-
nal Separation for the application in various fields,
like processing of biomedical or geophysical data,
speech or image processing and wireless communi-
cation code recognition is growing steadily (refer to
(Cichocki, 2002), (Oja, 2001) for an introduction),
the development of new blind source separation algo-
rithms is accompanied by the constant need of eval-
uating and comparing the newly created algorithms
with existing ones. The comparison of algorithms in
an objective manner requires test conditions, such as
the test-problem itself and the performance measures,
to be fixed. Furthermore, the quality of each algo-
rithm depends on the algorithm’s parameters and the
performed steps of pre-processing and noise-addition,
see (Giannakopoulos, 1998), (Dougla, 2005) for in-
stance. To address this, a MATLAB-based test-
suite was developed that allows an automated per-
formance comparison of different algorithms under
definable testing conditions. Combinations of pre-
processing steps such as PCA or high-/low-pass fil-
tering and different noise models could be automat-
ically tested. For each combination the parameter
range of the algorithms can be searched for optima.
In order to determine optimum outcomes, different
performance measures can be used. In the next sec-
tion, the concept of the testsuite and how it can be
used for automated algorithm evaluation is presented
shortly. In section 3 the evaluation and comparison of
the seven algorithms is demonstrated, whereas they
were split up as follows: FlexICA (Cichocki, 2002),
EVD, EVD24 (Oja, 2001) and FastICA (Oja, 2001) in
one group and FlexICA, JADE (Cardoso, 1999), Cu-
bICA (Blaschke, 2003) and the EfICA (Koldovsky,
2005) in the other. The section as well contains the
achieved performance results of these algorithms for
the four sub-problems: (I.) Large scale problem, (II.)
Incomplete or reduced set data problem, (III.) Very
ill-conditioned problem (IV.) Noisy problem.
2 TESTSUITE
The generation of test-data and the application,
evaluation and comparison of algorithms is normally
performed in different stages. Accordingly, the
testsuite consists of multiple stages as shown in
figure 1. At each stage of the testsuite, interfaces
exist to allow for the addition of new signal mixing
methods, new pre-processing steps, different noise
186
Charwath M., Hahn I., Hauke S., Pyka M., Stesny S., Lammers D., Wachenfeld S. and Borschbach M. (2006).
AN ALGORITHM EVALUATION TEST SUITE FOR BLIND SOURCE SEPARATION PROBLEM.
In Proceedings of the Third International Conference on Informatics in Control, Automation and Robotics, pages 186-192
DOI: 10.5220/0001211301860192
Copyright
c
SciTePress
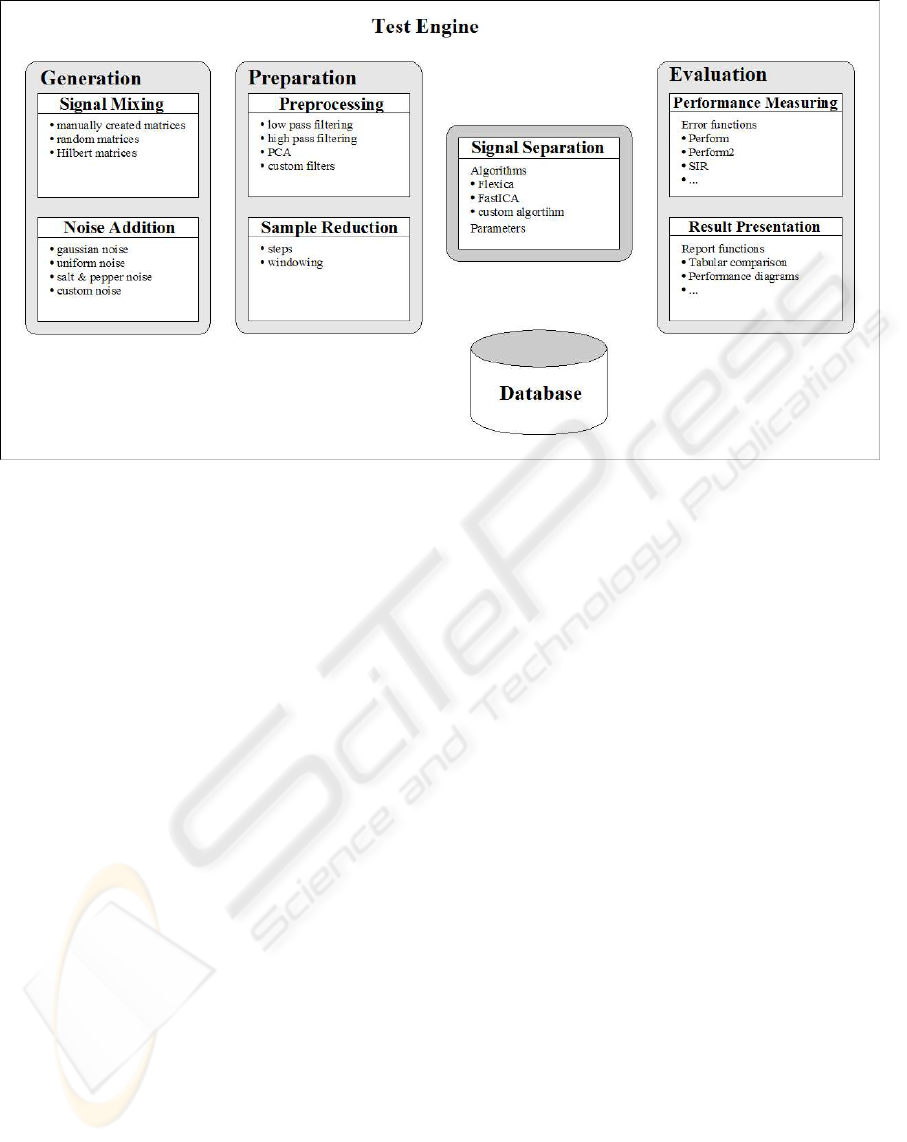
Figure 1: Stages of algorithm evaluation and comparison.
models, sample reduction methods, signal separation
algorithms and custom performance measures.
The different stages and the currently integrated mod-
ules/ functionalities at each stage will be described
briefly in the following.
Generation stage
The generation stage consists of signal mixing and
noise addition modules. The signal mixing modules
allow to mix any number of independent sources S
according to the linear standard ICA model X = AS
(Borschbach, 1999) (Hagen, 1997). The testsuite
supports any sources in MATLAB vector format
and allows to synthetically generate sources or
import .wav audio files using an integrated dataset
creation tool. The mixing matrix A can be explicitly
given or randomly created. Furthermore, the use of
Hilbert matrices for any dimension is possible. Other
matrix creation methods can be added if needed.
At the generation stage the addition of noise can be
performed so that the mixing model is extended to
X = AS + N . The added noise N is generated
according to a noise model which is currently
selectable from Gaussian-noise, Uniform-noise and
Salt-and-Pepper-noise. For each noise model, the
number of affected samples can be adjusted and a
target signal to noise ratio (SNR) can be specified in
dB. Other noise models can easily be added if wanted.
Preparation stage
The preparation stage offers signal pre-processing
and sample reduction functionalities. Before ex-
ecuting the main signal separation algorithms the
application of pre-processing steps such as principal
component analysis (PCA) and signal filtering is
possible. In addition to the currently implemented
low- and high-pass filters custom filters can be
easliy integrated. A windowing technique allows for
limiting the amount of considered data samples. Only
samples inside the window are used for blind signal
separation.
Separation stage
Within the separation stage the integrated blind
source separation algorithms are applied to the
generated and prepared data sets. The algorithms
can be called with different combinations of their
individually required parameters. The possibility to
call the algorithms with varied parameters allows
for systematical parameter testing and optimization.
Newly developed algorithms can be added in an easy
and comfortable way. A tutorial for developers on
how to integrate new algorithms into the application
is provided (Testengine, 2006).
Evaluation stage
The evaluation stage consists of performance mea-
suring and result representation functionalities. The
performance of algorithms is being determined
according to several measures, such as signal-to-
interference ratio (SIR) or intersymbol interference
(ISI, called Perform in the testsuite) (Schobben,
AN ALGORITHM EVALUATION TEST SUITE FOR BLIND SOURCE SEPARATION PROBLEM
187

1999). Further performance measures can be added
as required. Results are being presented primarily in
a tabular form, with other representations, such as
box plots (Oja, 1999), optionally available. As with
the other stages, further methods of presenting the
data can be integrated if needed. All test results can
automatically be written to a SQL database during
the test. This allows for data analysis with powerful
external tools.
Test Engine
The test engine controls all settings and parameters
passed to the modules during the test cycle. This helps
to find optimal settings and parameters in a systematic
fashion. Several steps in determining the algorithms’
best performance are automated. These include pro-
gression of noise intensity and sample reduction.
Noise progression is done by successively increasing
the signal-to-noise ratio (SNR) and per cent amount
of noise of a mixture up to a maximum. Sample re-
duction is done by gradually decreasing the size of the
window used by the algorithms. This shows how the
algorithms’ performance is affected by random noise
or the amount of data available, respectively. Noise
progression and sample reduction are mutually exclu-
sive. Automation of parameter values are also inte-
grated into the test engine.
Results can be stored in a SQL database, as mentioned
before, as well as in .mat files for further performance
analysis during the test-cycle and between the steps.
This allows for the reduction of signal generation and
modification to a single time and reusing the gener-
ated and preparated data with different algorithms.
This feature has been implemented using the MAT-
LAB database toolbox.
Finally, the test engine will generate a result report
showing the pertinent data. This includes options
to visualize the results, such as data sample plots of
source, mixed and unmixed data. Additionally, box-
plots of performance measures for the different algo-
rithms are supplied. This is done in order to improve
general comparability of different algorithms.
3 EVALUATION RESULTS
Using the developed testsuite, the following seven
algorithms have been tested: (I.) The FlexICA
algorithm, developed by S. Choi, A. Cichocki and S.
Amari (Cichocki, 2002), (II.) The EVD algorithm,
developed by P. Georgiev and A. Cichocki (Oja,
2001), (III.) The EVD24 algorithm, developed by
P. Georgiev and A. Cichocki (Oja, 2001), (IV.) The
FastICA algorithm, developed by J. Hurri, H. G
¨
avert,
J. S
¨
arel
¨
a, and A. Hyv
¨
arinen (Oja, 2001), (V.) JADE
algorithm, see J.-F. Cardoso (Cardoso, 1999), (VI.)
CubICA algorithm, see T. Blaschke and L. Wiskott
(Blaschke, 2003), (VII.) EFICA algorithm, see Z.
Koldovsky and P. Tichavsky (Koldovsky, 2005).
Using the testsuite to systematically try different
settings and parameter for the algorithms, a general
observation was, that high pass filtering during the
pre-processing stage yielded better results than unfil-
tered or low pass filtered data. Therefore all datasets
have been high pass filtered before applying the re-
spective algorithms. All tests were performed on two
types of datasets: real world data and synthetically
created random non-negative source signals. We used
T=5000 samples. The synthetic datasets have been
created using the testsuite’s integrated data generation
module. All experiments were conducted in a Monte
Carlo fashion with at least 100 independent runs
using randomly generated mixing matrices. All of
these have been applied to the four sub-problems.
The results the algorithms yielded will be presented
in the following sections. All synthetic datasets have
been created using the testsuite’s integrated data
generation module. The figures given in the next
sections represent the mean values of the SIR over
at least 100 runs using randomly generated mixing
matrices. This was done to guarantee stable results in
a Monte Carlo fashion.
Large scale problem
The first sub-problem deals with the algorithms’ per-
formance given an increasing dimension of the data
set. The data sets used for testing contain an equal
number of sub- and super-Gaussian sources, e.g. for
dimension 6 the data set would contain 3 sources of
each type. With increasing dimension the SIR drops,
as illustrated in the upper part of figure 2 for synthetic
data and in the lower part of figure 2 for real world
speech data. It can be noticed that the two EVD vari-
ants fare poorly compared to FastICA and FlexICA.
For synthetic data they are basically unable to sepa-
rate the mixtures. FastICA and FlexICA on the other
hand are performing better. Up to 20 sources can be
separated without the SIR falling below 15dB.
For real world data the algorithms perform better than
for the synthetic sources. This can probably be at-
tributed to the super-Gaussian nature of the signals.
For the comparison for the second algorithm group a
randomly generated proportion of sub-Gaussian and
super-Gaussian sources combined in one data set was
used, e.g. for dimension 4 the dataset would con-
tain either 2 sources of each type or 1 source of the
first and 3 sources of the other type. As expected,
the SIR drops with increasing dimension (see upper
part of figure 3). It clearly appeared that the FlexICA
performs poorly compared to the others. The best of
these four algorithms, the EfICA algorithm, has an
decreasing SIR reaching the 15dB mark for more than
64 dimensions.
ICINCO 2006 - SIGNAL PROCESSING, SYSTEMS MODELING AND CONTROL
188
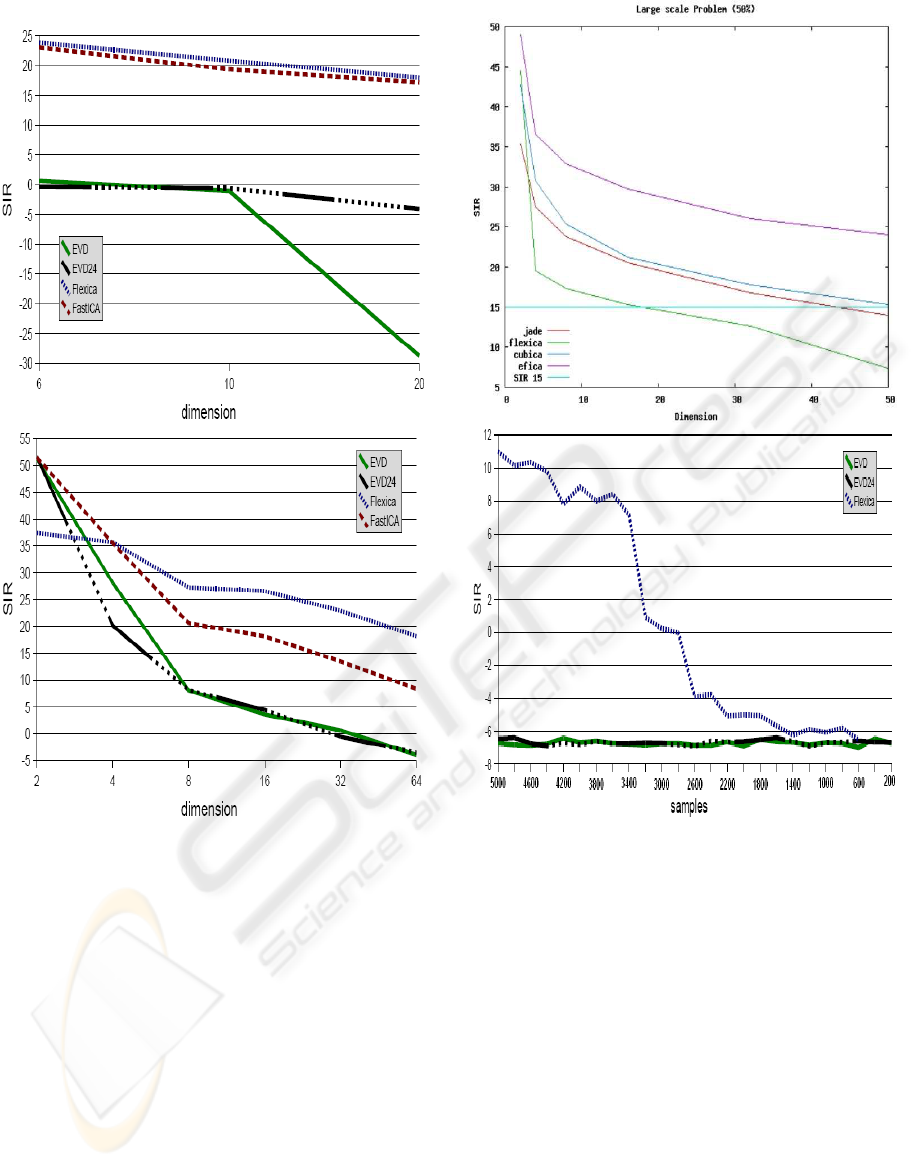
Figure 2: Upper part: SIR global performance index for
the large scale sub-problem 1 (set 2) using synthetic data.
Lower part: SIR global performance index for the large
scale sub-problem 1 (set 2) using real world speech data.
Incomplete or reduced set data problem
The second sub-problem is concerned with the
reduction of samples available to the algorithms. Al-
gorithmic performance in this task can be determined
using the test engine’s sample reduction feature. The
datasets are being reduced in length successively, the
algorithms attempt to estimate the inverse mixing
matrix using fewer samples each step. This is done
fully automated by the testsuite.
The lower part of figure 3 shows the performance
of the first three algorithms trying to separate 50
synthetically generated sources of decreasing sample
count. FastICA was not able to complete this task
in a stable way and was therefore not included. The
Figure 3: Upper part: Global performance index for sub-
problem 1 and a SIR of 50%, Lower part: SIR global per-
formance index for the incomplete/ reduced dataset.
EVD variants were not able to successfully separate
any of the sources, and even the FlexICA algorithm
never reached a SIR > 15dB, even at full sample
count of 5000. The performance for real world data
is somewhat better for the FlexICA algorithm, as
displayed in the lower part of figure 4. Even with
only 3200 available samples it still reaches a SIR of
approximately 15dB. EVD and EVD24 show unusual
behavior, as their performance improves significantly
beginning at 2800 samples. The cause of this has yet
to be determined. The lower part of figure 4 shows
the performance of four algorithms trying to separate
n=50 synthetically generated sources of decreasing
sample count. The FlexICA and the JADE algorithm
never reached a SIR > 15dB, even at full sample
count of T=5000. The CubICA just about reaches
AN ALGORITHM EVALUATION TEST SUITE FOR BLIND SOURCE SEPARATION PROBLEM
189
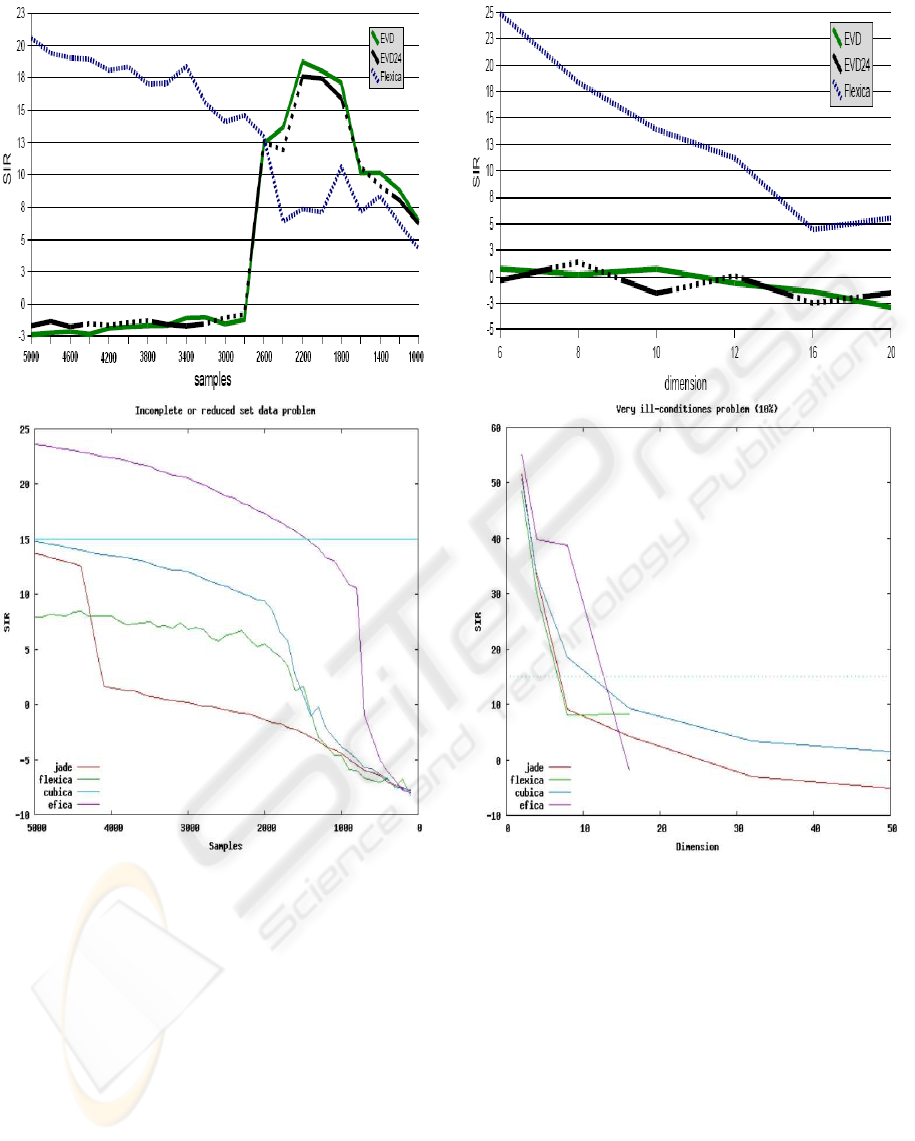
Figure 4: Upper part: SIR global performance index for the
incomplete/reduced sub-problem 2 (set 2) using real world
speech data. Lower part: SIR global performance index for
sub-problem 2.
the SIR > 15dB margin but only at full sample
count. Again the EfICA easily outnumbers all other
algorithms.
Very ill-conditioned problem
Sub-problem three uses Hilbert matrices in the
mixing process. Due to the nearly singular nature
of these matrices, inversion becomes more difficult.
This is mirrored by the results given in the lower part
of figure 5 and the upper part of figure 5 . Among the
tested algorithms reported in the upper part of figure
5, only FlexICA manages to provide acceptable
results.
Figure 5: Upper part: SIR global performance index for
the very ill conditioned sub-problem 3 (set 1) using syn-
thetic data. Lower part: Global performance index for sub-
problem 3 and a SIR of 10%.
For low dimensions below ten sources, the SIR
is higher than the required 15dB. While this is
significantly more than for the EVD variants, it still
is not a truly satisfactory performance. Overall these
results are congruent with those of the previous tests
and clearly show the inability of EVD to deal with
datasets comprised of both sub- and super-Gaussian
sources. For the simulation of the ICA-algorithm
competition (illustrated in the lower part of figure 5)
in case of FlexICA and EfICA, the condition of the
mixing matrices could not be calculated accurately
for each data matrix/ dimensionality. It should
be mentioned that both the FlexICA and EfICA
ICINCO 2006 - SIGNAL PROCESSING, SYSTEMS MODELING AND CONTROL
190
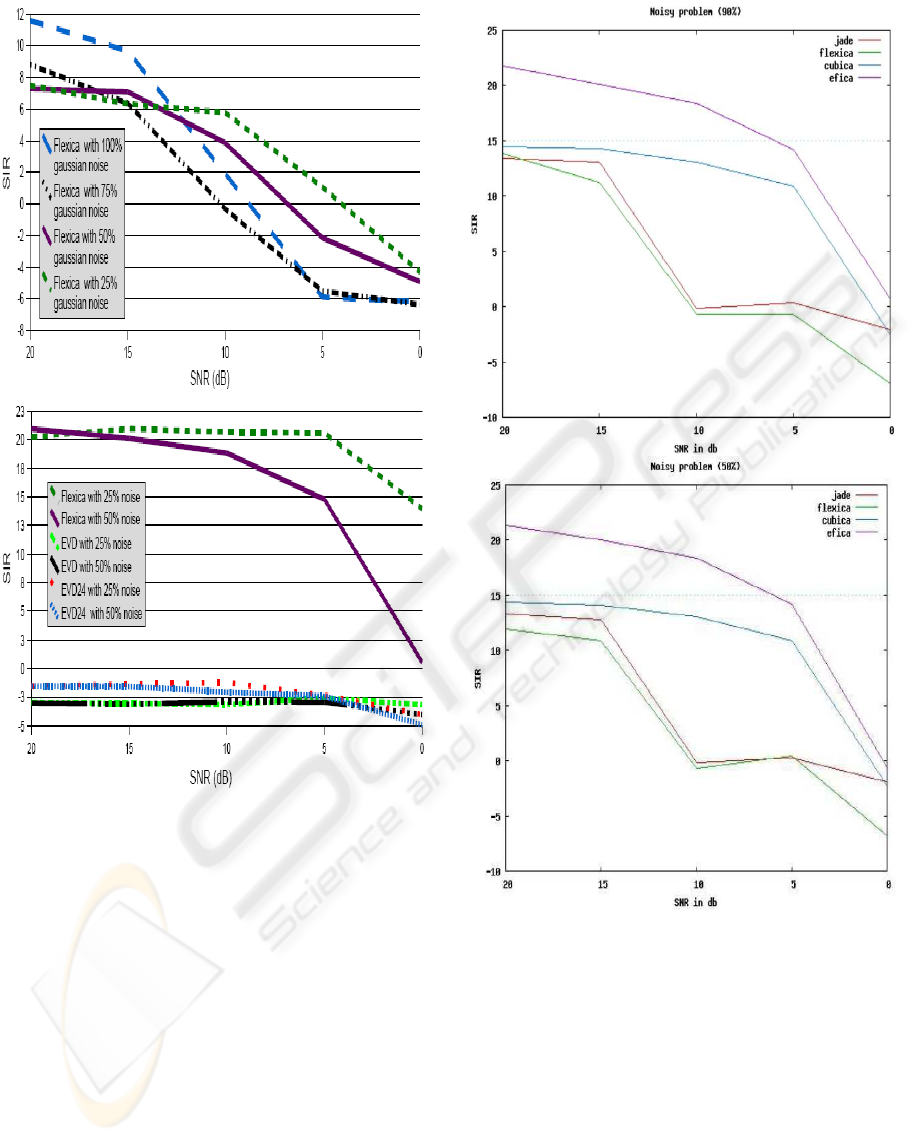
Figure 6: Upper part: SIR global performance index for the
noisy sub-problem 4 (set 1) using synthetic data. Lower
part: SIR global performance index for the sub-problem 4
(set 2) using real world data with 25% and 50% uniform
noise.
algorithms had serious problems coping with the in-
creasingly ill-conditioned mixing matrices and were
unable to converge, i.e. to complete computation in
cases where the matrix was unfortunately too close
to singular. This problem turned out to be dependent
on the dimension of the mixing matrices. Therefore
for these two algorithms, the only SIR values that
could be estimated are for dimensions 2 to 16.
Surprisingly, EfICAs performance drops significantly
between dimensions of 8 and 16 to a level below
that of the other algorithms. One might predict
that, on the contrary to the sub-problems examined
before, EfICAs performance will remain inferior to
the other algorithms with increasing dimensionality.
Furthermore when looking at the graphs in the lower
Figure 7: Upper part: SIR global performance index for
sub-problem 4. Lower part: Sub-problem 4 with 50% noise.
part of figure 5 showing FlexICAs performance up
to a dimension of 16 - FlexICA might turn out to
perform best among the four algorithms examined for
dimensions higher than 16 in the case of increasingly
ill-conditioned mixing matrices.
Noisy problem
The fourth and final sub-problem adds successively
increasing noise levels in the mixing process. This has
been achieved by using the noise progression module
provided by the test engine. This simplified testing
AN ALGORITHM EVALUATION TEST SUITE FOR BLIND SOURCE SEPARATION PROBLEM
191

the algorithms. For this sub-problem, only the per-
formance of the FlexICA algorithm was of interest
as the EVD methods did not manage to separate the
mixtures. Even FlexICA’s performance was not re-
markable, not reaching the required SIR of 15dB with
synthetic data at any noise level.
With speech data, FlexICA’s performance is some-
what better as can be seen in the lower part of fig-
ure 6. It remains satisfactory up to a SNR level of
5dB with 50% noise. This could be attributed to the
super-Gaussian nature of the speech signals. As wit-
nessed in all other sub-problems as well, both EVD
algorithms are unfit to address the tasks given. This
time even FlexICA’s performance on datasets with
Gaussian noise was not remarkable, not reaching the
required SIR of 15dB with synthetic data at any noise
level (see upper part of figure 6).
Starting out with 20dB, the SNR was gradually re-
duced by 5dB until it reached 0dB for the second
competition of algorithms (see figure 7 for reported
results). FlexICA’s performance on datasets with
Gaussian noise was not remarkable and did not reach
the required SIR of 15dB with synthetic data at any
noise level. On the other hand, for this specific sub-
problem, CubICA shows to perform best among those
algorithms that did not reach the required SIR>15dB
margin at any noise level. Finally, it is the EfICA
algorithm again that outperforms the others on aver-
age, showing its typical behaviour with respect to an
increasing SNR level. In comparison to the results
for 50% (upper part figure 7) and 10% noise (lower
part of figure 7), EfICA and CubICA performs ex-
actly equal.
4 CONCLUSION
We have shown that the testsuite allows for the sys-
tematic and automated evaluation of blind source sep-
aration algorithms and supports the development of
new algorithms by providing an easy way of standard-
ized comparison. For the given test problems we have
determined an optimal combination of pre-processing
steps and corresponding optimal parameters for se-
lected known algorithms. The systematic search for
optimal parameters may allow using the full potential
of existing and new algorithms. Concerning the algo-
rithms of the second group (FlexICA, CubICA, JADE
and EfICA) it remains to say, that they perform quite
well. Especially at higher dimensions and at higher
noise rates newer algorithms are able to outperform
FlexICA. The results strongly imply the use of spe-
cific algorithms for different application context. A
context dependent adaptive expert toolbox for differ-
ent application scenarios would maximize the BSS-
application performance.
REFERENCES
Cichocki, A. and Amari, S.-I. 2002. Adaptive Blind Signal
and Image Processing, (Wiley).
Hyv
¨
arinen, A., Karhunen, J. and Oja E. 2001. Independent
Component Analysis, (Wiley).
Giannakopoulos, X. 1998. Comparison of Adaptive Inde-
pendent Component Analysis Algorithms, (Helsinki
University: Master Thesis).
Calhoun, V., Adali, T., Larsen, J., Miller, D. and Douglas,
S. 2005. Proceedings of IEEE Machine Learning for
Signal Processing Workshop XV.
Cardoso, J.-F. 1999. High-Order Contrasts for Independent
Component Analysis, Neural Computation, 11(1):
157–192.
Blaschke, T. and Wiskott, L. 2003. CubICA: Indepen-
dent Component Analysis by Simultaneous Third-
and Forth-Order Cumulant Diagonalization, Com-
puter Science Preprint Server (CSPS): Computational
Intelligence/0304002.
Koldovsky, Z. and Tichavsky, P. 2005. Efficient Vari-
ant of Algorithm FASTICA for Independent Compo-
nent Analysis Attaining the CRAMER-RAO LOWER
BOUND, IEEE Statistical Signal Processing Work-
shop, Bordeaux..
Borschbach, M. and Schulte, M. 1999. Performance Analy-
sis of Learning Rules for the Blind Separation of Mag-
netencephalography Signals, Proc. of ICA’99, First
Int. Workshop on Independent Component Analysis
and Signal Separation, pp. 341–346.
Hagen, C. 1997. Neural Networks and Multivariate Statisti-
cal Data Analysis (in German), (University of Darm-
stadt: Ph.D. Thesis.)
Testengine and -suite. 2006. http://cs.uni-muenster.de/ICA/
;-last date of access 03.05.2006.
Schobben, D., Torkkola, K., and Smaragdis, P. 1999. Eval-
uation Blind Signal Separation Methods”, Proc. of
ICA’99, First Int. Workshop on Independent Compo-
nent Analysis and Signal Separation, pp. 261–266.
Giannakopoulos, X., Karhunen, J. and Oja, E. 1999. An ex-
perimental comparison of neural algorithms for inde-
pendent component analysis and blind separation, Int.
J. of Neural Systems, Vol. 9, No. 2.
ICINCO 2006 - SIGNAL PROCESSING, SYSTEMS MODELING AND CONTROL
192
