
FEATURE SELECTION FOR IDENTIFICATION OF SPOT
WELDING PROCESSES
Eija Haapalainen, Perttu Laurinen, Heli Junno, Lauri Tuovinen and Juha R
¨
oning
Intelligent Systems Group,Department of Electrical and Information Engineering
P.O. Box 4500, FIN-90014 University of Oulu, Finland
Keywords:
Feature selection, process identification, k-nearest neighbour classifier, resistance spot welding.
Abstract:
Process identification in the field of resistance spot welding can be used to improve welding quality and to
speed up the set-up of a new welding process. Previously, good classification results of welding processes have
been obtained using a feature set consisting of 54 features extracted from current and voltage signals recorded
during welding. In this study, the usability of the individual features is evaluated and various feature selection
methods are tested to find an optimal feature subset to be used in classification. Ways are sought to further
improve classification accuracy by discarding features containing less classification-relevant information. The
use of a small feature set is profitable in that it facilitates both feature extraction and classification. It is
discovered that the classification of welding processes can be performed using a substantially reduced feature
set. In addition, careful selection of the features used also improves classification accuracy. In conclusion,
selection of the feature subset to be used in classification notably improves the performance of the spot welding
process identification system.
1 INTRODUCTION
Resistance spot welding is one of the most important
methods for joining metal objects. It is in widespread
use in, for example, the automotive and electrical in-
dustries, where more than 100 million spot welding
joints are produced daily in European vehicle indus-
try only (TWI, 2004).
In resistance spot welding, two or more metal
sheets are joined together by passing an electrical cur-
rent through them. The current is conducted through
two electrodes pressed against the metal surfaces to
hold the parts to be welded tightly together. The
heat produced by the flowing current melts the met-
als, and a welding spot is formed. The amounts of
current, pressure and time are all carefully controlled
and matched to the type and thickness of the material.
After cooling, the quality of the welding joint can
be estimated by measuring its diameter. In general,
the bigger the diameter is, the firmer is the welding
joint. Some other factors, such as faults and embrit-
tlement in the welding joint, also affect its strength.
The most reliable and commonly used method to ver-
ify the quality of a welding joint is to tear the welded
parts apart and to measure the spot diameter. How-
ever, the welding joint is thereby destroyed. Some
nondestructive methods for estimating the spot diam-
eter also exist, but so far, no real-time, nondestructive
method for online use on production lines has been
developed. The two most common methods of nonde-
structive testing are radiographic and ultrasonic weld
inspection (Anderson, 2001). These methods can also
be used to detect discontinuities within the internal
structure of a weld. Another example of nondestruc-
tive quality control methods of spot welding is the
method based on primary circuit dynamic resistance
monitoring by (Cho and Rhee, 2002).
Different combinations of welding machines used
and materials welded constitute distinctive welding
processes. In other words, welding processes could
also be called production batches. In this study, the
properties of welding experiments that distinguish
different processes are the type of welding machine
used, the materials welded, the thicknesses of the
materials and the welding time. However, changes
in current, electrode force and electrode wear are
thought to be internal changes of processes. Recogni-
tion of the most similar process from a pool of previ-
ously stored processes is called process identification.
This study is a follow-up on a previous article by
the authors, in which different classification methods
were evaluated for use in the identification of spot
welding processes (Haapalainen et al., 2005). That
study showed that welding processes can be reliably
40
Haapalainen E., Laurinen P., Junno H., Tuovinen L. and Röning J. (2006).
FEATURE SELECTION FOR IDENTIFICATION OF SPOT WELDING PROCESSES.
In Proceedings of the Third International Conference on Informatics in Control, Automation and Robotics, pages 40-46
DOI: 10.5220/0001209100400046
Copyright
c
SciTePress

identified by extracting certain statistical and geomet-
rical features of current and voltage signals measured
during welding and performing classification based
on these features. The k-nearest neighbour classifier
(kNN) with the parameter value k = 3 was found to
be the most suitable method for the classification of
spot welding processes.
Process identification is needed to be able to utilise
information collected from previously run processes
to produce new welding spots of good quality.
The characteristics of a sample from a new weld-
ing process can be compared to information col-
lected from previously run processes to find a similar
process. After that, the process parameters of the pre-
vious process already proven to lead to high-quality
welding joints can be applied to the new process.
With this approach, good welding results are achieved
right from the beginning, and the time needed for the
set-up of a new process can be significantly reduced.
In addition, if a similar process is found, the quality
control methods that proved viable for that process
can also be used for the new process.
In the previous study by the authors, classifica-
tion of welding processes was performed using alto-
gether 54 distinctive features extracted from the signal
curves recorded during welding. The aim of this study
was to reduce the dimension of the feature space by
eliminating features with less classification-relevant
information and to consider the usefulness of the in-
dividual features. This was expected to cut down the
time needed for classification and, most importantly,
to further improve the classification accuracy. Various
feature selection methods were tested to find the min-
imal feature set yielding good classification results.
Previously, feature selection in the field of spot
welding has been studied by (Stoppiglia et al., 2003).
In that study, however, only one process was consid-
ered at a time, and the study concentrated exclusively
on nondestructive estimation of the diameter of the
welding spot. The existing feature selection methods
have been extensively reviewed in the studies (Dash
and Liu, 1997) and (Kudo and Sklansky, 2000). Es-
pecially, in (Kudo and Sklansky, 2000) and (Jain and
Zongker, 1997), the Sequental Floating Feature Se-
lection methods used in this study have been shown
effective and suitable for feature selection problems
with the dimension of the feature data of the same
magnitude as the data used in this study.
2 THE DATA
The data used in this study were supplied by two
welding equipment manufacturers. There were alto-
gether 20 processes, of which 11 had been welded
at Harms+Wende GmbH & Co.KG and 9 at Stanz-
biegetechnik. A total of 3879 welding experiments
were covered. The experiments were done by weld-
ing two metal objects together using a resistance spot
welding machine. Each of the observations contained
measurements of current and voltage signals recorded
during welding.
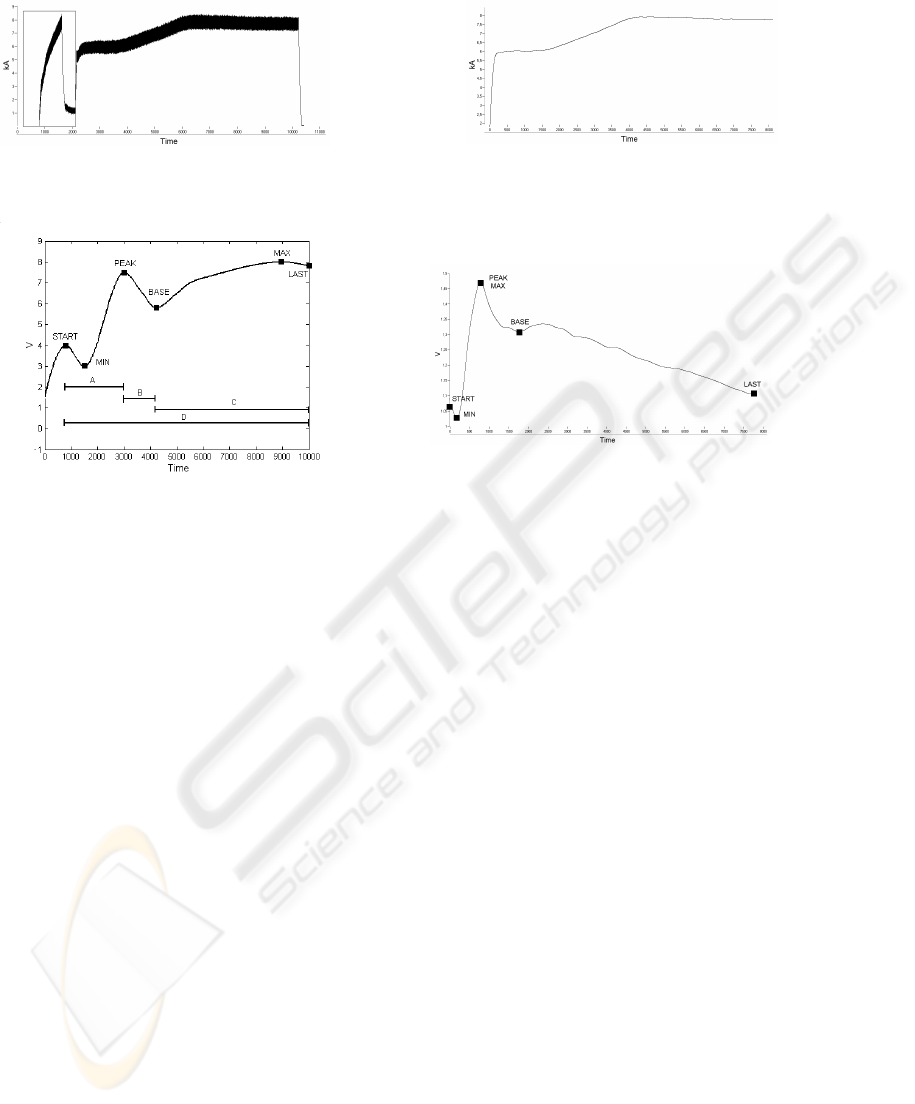
The raw signal curves contained plenty of oscilla-
tory motion and a pre-heating section, and they were
therefore pre-processed. The pre-heating parts of the
curves were cut off, so that all that remained was
the signal curves recorded during the actual welding
phase. In addition, the curves were smoothened using
the Reinsch algorithm (Reinsch, 1971). An example
of a signal curve before and after pre-processing is
shown in Figs. 1 a) and b).
3 THE FEATURES
Altogether 54 geometrical and statistical features
were extracted from the two signal curves relating to
a single welding experiment. The geometrical fea-
tures were chosen to locate the transition points of the
curves as precisely as possible. The statistical features
included the median of the signal and the arithmetic
means of the signal values calculated on four intervals
based on the transition points. In addition, the signal
curve was divided into ten intervals of equal length,
and the means of the signal values within these inter-
vals were used as features. There were altogether 12
geometrical and 15 statistical features extracted from
both signal curves. The features are demonstrated in
Figs. 2 a) and b).
In practice, it often happens that some of the geo-
metrical features overlap, and that the overlapping
features vary from one curve to another. However,
this can also be regarded as a characteristic of the
curve. In Fig. 2 a), all the geometrical features are
demonstrated on an artificial curve simulating the real
data. On this curve, the features do not overlap, but
the curve is otherwise notably similar to genuine sig-
nal curves. Figure 2 b) shows an example of the fea-
tures calculated on a real signal curve.
The ten means of a signal curve have earlier been
used as features in the articles (Junno et al., 2004a),
(Junno et al., 2004b), (Junno et al., 2005) and (Haa-
palainen et al., 2005). It has been discovered that they
present the main characteristics and differences of the
curves very well and are therefore suitable to be used
in the quality control and identification of welding
processes.
FEATURE SELECTION FOR IDENTIFICATION OF SPOT WELDING PROCESSES
41
a)
b)
Figure 1: a) A raw signal curve. The pre-heating section is outlined with a rectangle. b) The same curve after pre-processing.
a) b)
Figure 2: a) The geometrical features on an artificial voltage curve. The line segments A-D below the curve demonstrate the
intervals based on the transition points on which means were calculated. b) An example of how the geometrical features often
partially overlap in practice. On this voltage curve, the features named ’peak’ and ’max’ overlap.
4 FEATURE SELECTION
Of the classification methods evaluated in the previ-
ous article by the authors (Haapalainen et al., 2005),
the k-nearest neighbour classifier proved to be opti-
mal for the identification of spot welding processes.
The parameter value k = 3 was selected based on the
comparative study. The classification was performed
using alternatively either all the 54 features extracted
from the curves or only the ten mean values calcu-
lated on both signal curves (altogether 20 features).
The best results were obtained using the ten means.
In that case, a classification accuracy of 98.53 per-
cent was obtained, while the classification based on
all the 54 features yielded notably inferior results with
a classification accuracy of only 84.13 percent.
Although good classification results were obtained
using the ten means as features, there was still an in-
terest to study the usability of the other features. Also,
the amount of classification-related information car-
ried by each of the ten means was unknown. There-
fore, various feature selection methods were applied
to the entire feature set to find the optimal feature sub-
set to be used in classification. It was studied whether
classification accuracy could be further improved by
discarding redundant features. Since dimension re-
duction of the feature set also reduces the computa-
tional time required for classification, a minimal sub-
set was searched for.
Five different feature selection methods were
tested: Sequential Forward Selection (SFS), Se-
quential Backward Selection (SBS), Sequential For-
ward Floating Selection (SFFS), Sequential Back-
ward Floating Selection (SBFS) and n Best Features
Selection.
SFS is a simple bottom-up search procedure in
which one feature at a time is added to the current fea-
ture set. At each stage, the feature to be included is
selected from the set of remaining available features,
so that the new extended feature set yields a maxi-
mum value of the criterion function used (Devijver
and Kittler, 1982). The SBS method is the top-down
counterpart of the SFS algorithm.
The Floating Forward and Backward Feature Se-
lection methods, SFFS and SBFS, introduced in
(Pudil et al., 1994), are based on the plus l-take away
r method (Stearns, 1976), in which the feature set
is alternately enlarged by l features using the SFS
method and reduced by discarding r features applying
the SBS algorithm. In the Floating Feature Selection
methods, however, the number of forward and back-
ward steps is dynamically controlled instead of being
fixed in advance. The conditional inclusion and ex-
clusion of features is controlled by the value of the
criterion function. In the bottom-up algorithm, SFFS,
after each forward step, a number of backward steps
ICINCO 2006 - INTELLIGENT CONTROL SYSTEMS AND OPTIMIZATION
42

are applied as long as the resulting subsets yield bet-
ter values of the criterion function than the previously
evaluated ones of the same dimension. In the top-
down counterpart, SBFS, an exclusion of a feature
is followed by a series of successive conditional in-
clusions if an improvement to the previous sets can
be made. The feature to be included into the current
feature set or excluded from it is always the one that
improves the set most or degrades the value of the cri-
terion function least (Pudil et al., 1994).
The n Best Features Selection method simply
means selection of the n individually best features in
the sense of maximizing the criterion function. It is
the simplest alternative for feature subset selection,
but also the most unreliable since the features may
correlate with each other. Therefore, it was only used
for comparison in this study.
The best possible way to design the process identi-
fication system would have been to select the feature
set and the classification method used simultaneously.
However, because the kNN classifier had previously
been found suitable for the process identification task
(Haapalainen et al., 2005), the effectiveness of the
different feature subsets produced by the feature se-
lection methods were evaluated using the classifica-
tion accuracy of the 3N N classifier as the criterion
function. In addition, the k-nearest neighbour method
has been used to measure the goodness of a feature
set also in the studies (Jain and Zongker, 1997) and
(Kudo and Sklansky, 2000).
The SFS, SBS and n Best Features methods were
selected to be used in this study because of their
easy application and relatively short calculation time.
Compared to the basic sequential feature selection
methods, the main advantage of the floating meth-
ods is that the resulting feature sets of different di-
mensions are not necessarily nested, as in the case
of the SFS and SBS methods. This is because the
floating methods are able to correct the erroneous de-
cisions made at the previous steps of the algorithm.
Therefore, these methods provide a close to optimal
solution to the problem of feature subset selection
(Pudil et al., 1994). Because of this characteristic,
they are also highly applicable to problems involving
nonmonotonic feature selection criterion functions,
which was the case in this study. In addition, even
though the floating feature selection methods are only
nearly optimal, they are much faster than the optimal
but computationally prohibitive Branch and Bound
algorithm (Narendra and Fukunaga, 1977).
In order to evaluate classification accuracy when
using different feature sets, the data were divided into
training and test data sets, which consisted of 2/3 and
1/3 of the data, respectively. The training data set was
used to train the 3N N classifier, and the test data set
was used to evaluate the classification accuracy.
5 RESULTS
The best possible feature subsets for maximizing
the 3N N classifiers classification accuracy were
searched for. The feature selection methods were ap-
plied to both the original and a normalized feature set.
The latter was formed by normalizing the feature val-
ues of the original feature set to have an average of
zero and a standard deviation of one. The results of
the classification using feature subsets constructed by
the various feature selection methods are presented in
Tables 1 a) and b).
The tables show the best classification accuracy ob-
tained using feature sets formed by each of the feature
selection methods. The feature subsets of all dimen-
sions between 1 and 54 (dimension of the original fea-
ture set) were formed with each of the feature selec-
tion methods. Classification using each of these sets
was performed, and the best classification accuracy
obtained was recorded in the tables. The percentages
in the middle row indicate the ratios of correctly clas-
sified processes and the numbers in the bottom row
stand for the dimension of the feature set used in clas-
sification. It should be noted that the best feature sub-
sets produced by the different feature selection meth-
ods are composed of unequal numbers of features.
The classification results of feature subsets formed
from the unnormalized features are presented in Ta-
ble 1 a), and the results of the subsets constructed
from the normalized features are shown in Table 1
b). It can be seen that the subsets of the set of nor-
malized features are notably larger than the subsets of
the set of original features. However, the dimensions
and classification accuracies of the different feature
subsets are difficult to compare since only the sub-
sets yielding the best classification results were con-
sidered at this point. Only the backward methods,
SBS and SBFS, seem to yield better feature subsets
when applied to normalized data. Nevertheless, the
dimensions of these sets, 17 and 29, are much larger
than those of the subsets formed from the unnormal-
ized feature data, which are both of dimension 7. For
comparison, it can be studied what the classification
accuracies would be for smaller subsets of the set of
normalized features formed with the backward meth-
ods. These results are presented in Table 2. It can
be seen that quite good classification results are also
obtained by using the smaller feature sets. However,
these results do not compare with the classification re-
sults of the subsets produced from the unnormalized
feature set by the forward methods, SFS and SFFS.
From the point of view of this study, it was consid-
ered more important to find a moderately small fea-
ture set that yields excellent classification results than
to reduce the dimension of the feature set used to the
absolute minimum. It can be stated, however, that the
best classification results are obtained with small fea-
FEATURE SELECTION FOR IDENTIFICATION OF SPOT WELDING PROCESSES
43
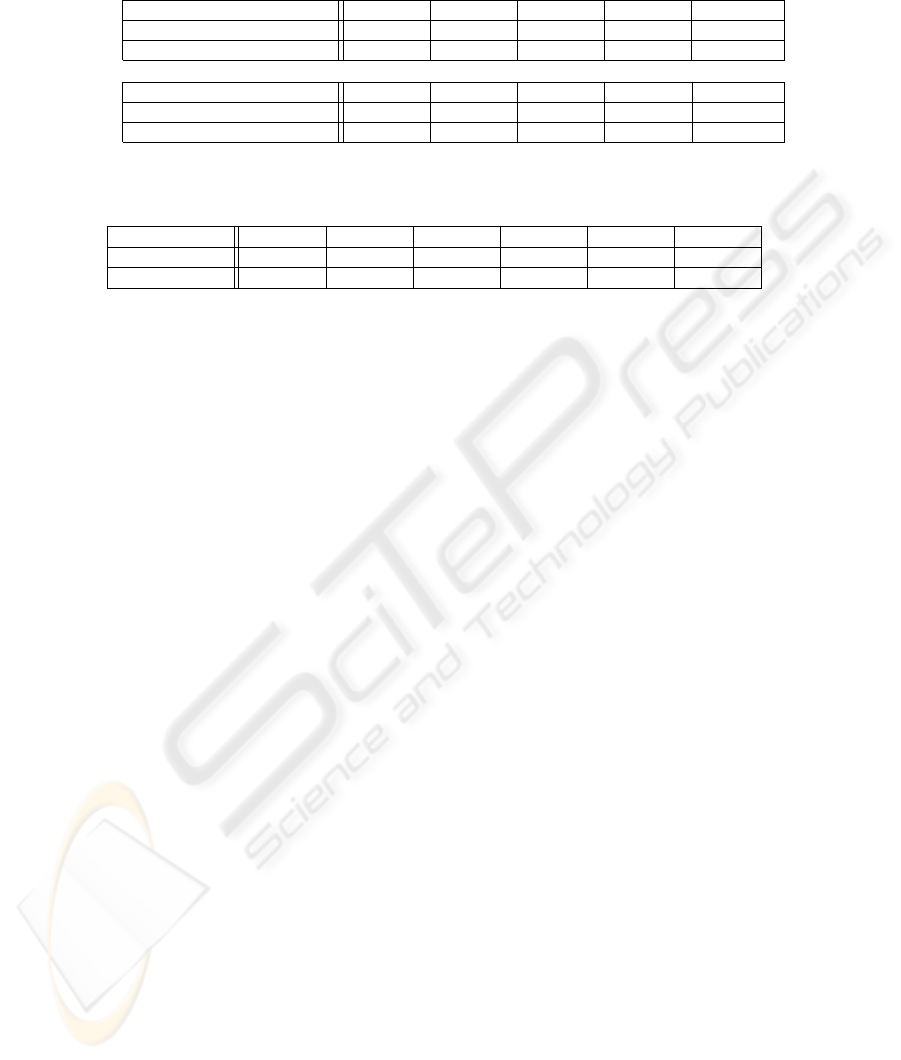
Table 1: Classification results of the 3N N classifier using different feature subsets formed by the feature selection methods
together with the number of features included in each feature set. a) Subsets formed from the original feature set. b) Subsets
formed from normalized feature data.
a) Feature selection method SFS SBS SFFS SBFS nBEST
Classification accuracy 98.92 84.67 99.30 84.75 95.28
Number of features used 6 7 11 7 10
b) Feature selection method SFS SBS SFFS SBFS nBEST
Classification accuracy 98.30 97.14 98.45 97.45 95.12
Number of features used 18 17 19 29 52
Table 2: Classification accuracies of subsets of different dimensions formed by the SBS and SBFS methods from the normal-
ized feature set.
Method/Dim. 6 7 8 10 15 20
SBS 95.74 96.28 96.44 96.83 96.75 97.06
SBFS 95.67 96.21 96.52 96.90 97.14 97.21
ture subsets formed from the original feature set. The
best of all feature subset with a classification accuracy
of 99.30 percent was produced by the SFFS method.
The dimension of this set was 11. The SFS method
also yielded a feature subset with almost equally good
classification accuracy of 98.92 percent. And what is
remarkable about this result is that this set consists of
only 6 features.
The observation that, in general, the subsets gener-
ated from the set of original features yield better clas-
sification results than the subsets formed from the nor-
malized data alludes that the measurements of current
contain more information related to process identifi-
cation than the measurements made of voltage. This
is because the original range of current measurement
values was wider than the range of voltage values.
Therefore, in the case of the original data, the fea-
tures extracted from the current signals affect the clas-
sification more than the features calculated from the
voltage signals. Since the influence of the two sig-
nals is equalized in normalized data, this implies that
the features calculated from current signals are more
significant to process identification than the features
extracted from the voltage signals. From experience,
however, it is known that only a rough classification
of welding processes can be made based on the cur-
rent signals alone, and the information carried by the
voltage signals is also needed to get more precise re-
sults.
The significance of the features extracted from the
current signals can also be established by comparing
the amount of classification-related information con-
tained in each of the features individually. Table 3 a)
presents the 20 individually best features of the nor-
malized feature set. The column in the middle shows
the accuracy of classification based on only one fea-
ture. The classification results of the feature subsets
formed with the n Best Features Selection method are
presented in the column on the right. It can be seen
that all the 20 individually best features are extracted
from the current curves. (The first feature extracted
from voltage signals would be the 22th on this list.)
However, the individual goodness of the features is
not a sufficient criterion for feature selection since the
features may correlate with each other. Because of
this, the feature subsets produced by the n Best Fea-
tures Selection method are generally inferior to the
subsets formed by the other methods. The best sub-
set formed from the normalized feature set yielded a
classification accuracy of 95.12 percent, and the sub-
set consisting of unnormalized features yielded an ac-
curacy of 95.28 percent as seen in Table 1.
It should also be noted in Table 3 that all of the
ten means calculated on the current signal (called in-
terval means) are among the 18 individually best fea-
tures. After this, it only seems logical that remarkably
better classification results were obtained in the previ-
ous study using a feature subset consisting of the ten
means than using the entire feature set in classifica-
tion.
In Table 4, the features selected by the SFS, SFFS
and n Best Features Selection methods are presented.
These feature subsets of the dimensions 6, 7 and 10
were formed from the unnormalized feature set. It can
be seen that several of the features have been selected
by two or all three of the methods. Again, the ten
means are well represented in the set of features se-
lected. It should also be noted that the SFS and SFFS
methods have selected approximately evenly features
extracted from the current and the voltage signals. As
the best classification results are obtained using fea-
ture subsets formed by these methods, it can be con-
cluded that the use of features extracted from both the
signals is necessary to obtain excellent classification
results.
ICINCO 2006 - INTELLIGENT CONTROL SYSTEMS AND OPTIMIZATION
44
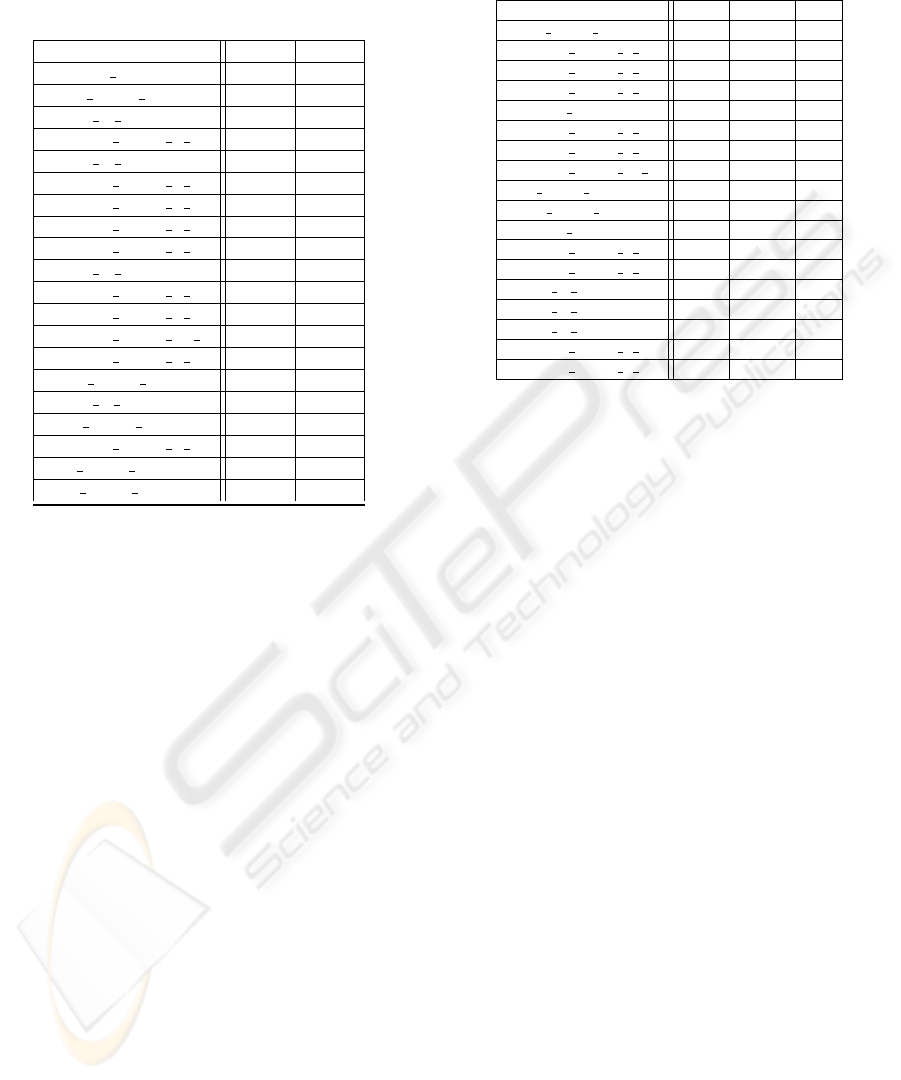
Table 3: The 20 individually best features of the normalized
feature set. A c at the end of a feature name means that the
feature has been extracted from the current signal, while a v
stands for voltage signal.
Feature % n
median c 72.45 72.45
start value c 72.29 89.47
mean C c 71.67 90.40
interval mean 5 c 71.36 92.57
mean D c 69.51 92.57
interval mean 6 c 69.20 92.26
interval mean 4 c 68.65 92.57
interval mean 2 c 68.50 94.58
interval mean 7 c 68.19 94.74
mean A c 66.33 94.97
interval mean 8 c 65.87 94.58
interval mean 9 c 65.71 94.50
interval mean 10 c 64.94 94.35
interval mean 3 c 64.63 94.43
peak value c 62.38 94.50
mean B c 61.84 94.50
max value c 61.77 93.96
interval mean 1 c 61.53 94.43
last value c 60.06 94.81
min value c 59.68 94.66
6 CONCLUSION
In this study, various feature selection methods were
discussed with an aim to improve the performance
of a spot welding process identification system. The
methods were applied to a set of features extracted
from current and voltage signals recorded during
welding. The classification accuracy of the 3NN clas-
sifier found suitable for the process identification task
in a previous study was used as the criterion func-
tion for the feature subsets produced by the meth-
ods. Altogether five different feature selection meth-
ods were tested on both the original and a normalized
feature set. These methods were the Sequential For-
ward Selection (SFS), the Sequential Backward Se-
lection (SBS), the Sequential Forward Floating Se-
lection (SFFS), the Sequential Backward Floating Se-
lection (SBFS) and the n Best Features Selection. In
general, the subsets generated from the set of original
features yielded better classification results than the
subsets formed from the normalized data.
It was discovered that classification accuracy can
be improved from the 84.13 percent obtained previ-
ously to 99.30 percent simultaneously reducing the
dimension of the feature set from 54 to 11. This
reduction in the feature set size facilitates both the
extraction of features and the actual process identi-
fication. The best feature subset (classification accu-
racy of 99.30 percent) was obtained using the SFFS
Table 4: The features selected by the SFS, SFFS and n Best
Features Selection method from the original feature set.
Feature SFS SFFS nB
start value c x x x
interval mean 2 c x x x
interval mean 1 v x x
interval mean 5 v x x
median c x x
interval mean 5 c x x
interval mean 6 c x x
interval mean 10 v x
last value v x
peak value v x
median v x
interval mean 3 v x
interval mean 6 v x
mean A c x
mean C c x
mean D c x
interval mean 4 c x
interval mean 7 c x
method. The feature subset produced by the SFS
method also yielded a very good classification re-
sult. The classification accuracy obtained using this
set was 98.92 percent. And what is most important
about this result is that the dimension of this set was
notably smaller than the dimension of the set pro-
duced by the SFFS method being only 6. Hence, it
was shown, that the dimension of the feature subset
used in classification can be significantly reduced and
the performance of the spot welding process identifi-
cation system notably improved.
By considering the amount of classification-related
information contained in each of the features individ-
ually, it was confirmed that the ten means calculated
on intervals of equal length of a signal curve are in-
deed very good features to be used in classification. In
addition, it was discovered that the features extracted
from current signals contain more information related
to process identification than those calculated from
voltage signals. Nevertheless, the use of both of these
is necessary to obtain excellent classification results.
ACKNOWLEDGEMENTS
We would like to thank our partners in coopera-
tion Fachochschule Karlsruhe, Stanzbiegetechnik and
Harms + Wende GmbH & Co.KG. Furthermore, we
would like to express our gratitude for the financial
support provided by the Commission of the European
Communities, specific RTD programme ”Competi-
tive and Sustainable Growth”, G1ST-CT-2002-50245,
”SIOUX”, and Infotech Oulu, an umbrella organiza-
tion for information technology research in Oulu re-
gion.
FEATURE SELECTION FOR IDENTIFICATION OF SPOT WELDING PROCESSES
45

REFERENCES
Anderson, T. (2001). Radiographic and ultrasonic weld in-
spection: Establishing weld integrity without destroy-
ing the component. Practical Welding Today, Decem-
ber 13th.
Cho, Y. and Rhee, S. (2002). Primary circuit dynamic resis-
tance monitoring and its application to quality estima-
tion during resistance spot welding. Welding Journal,
81(6):104–111.
Dash, M. and Liu, H. (1997). Feature selection for clas-
sification. International Journal of Intelligent Data
Analysis, 1(3):131–156.
Devijver, P. and Kittler, J. (1982). Pattern Recognition - A
Statistical approach. Prentice-Hall, Englewood Cliffs,
NJ.
Haapalainen, E., Laurinen, P., Junno, H., Tuovinen, L., and
R
¨
oning, J. (2005). Methods for classifying spot weld-
ing processes: A comparative study of performance.
In Proc 18th International Conference on Industrial
& Engineering Applications of Artificial Intelligence
& Expert Systems, pages 412–421.
Jain, A. and Zongker, D. (1997). Feature selection: Eval-
uation, application, and small sample performance.
IEEE Transactions on Pattern Analysis and Machine
Intelligence, 19(2):153–158.
Junno, H., Laurinen, P., Haapalainen, E., Tuovinen, L., and
R
¨
oning, J. (2005). Resistance spot welding process
identification using an extended knn method. In Proc.
IEEE International Symposium on Industrial Elec-
tronics, volume 1, pages 7–12.
Junno, H., Laurinen, P., Haapalainen, E., Tuovinen, L.,
R
¨
oning, J., Zettel, D., Sampaio, D., Link, N.,
and Peschl, M. (2004a). Resistance spot welding
process identification and initialization based on self-
organizing maps. In Proc. First International Confer-
ence on Informatics in Control, Automation and Ro-
botics (1), pages 296–299.
Junno, H., Laurinen, P., Tuovinen, L., and R
¨
oning, J.
(2004b). Studying the quality of resistance spot weld-
ing joints using self-organising maps. In Proc. 4th
International ICSC Symposium on Engineering of In-
telligent Systems.
Kudo, M. and Sklansky, J. (2000). Comparison of algo-
rithms that select features for pattern classifiers. Pat-
tern Recognition, 33:25–41.
Narendra, P. and Fukunaga, K. (1977). A branch and bound
algorithm for feature selection. IEEE Transactions on
Computers, C-26(9):917–922.
Pudil, P., Ferri, F., Novoviˇcov´a, J., and Kittler, J. (1994).
Floating search methods for feature selection with
nonmonotonic criterion functions. In Proc. 12th In-
ternational Conference on Pattern Recognition, pages
279–283.
Reinsch, C. (1971). Smoothing by Spline Functions, II. Nu-
merische Matematik, 16:451–454.
Stearns, S. (1976). On selecting features for pattern clas-
sifiers. In Proc. Third International Conference on
Pattern Recognition, pages 71–75.
Stoppiglia, H., Dreyfus, G., Dubois, R., and Oussar, Y.
(2003). Ranking a random feature for variable and
feature selection. Journal of Machine Learning Re-
search, 3:1399–1414.
TWI (2004). World centre for materials joining tech-
nology. Resistance Spot Welding, www doc-
ument. Retrieved September 29, 2005, from
www.twi.co.uk/j32k/protected/band$\
3$/kssaw0\\01.html.
ICINCO 2006 - INTELLIGENT CONTROL SYSTEMS AND OPTIMIZATION
46
