PITCH ESTIMATION OF DIFFICULT POLYPHONY SOUNDS
OVERLAPPING SOME FREQUENCY COMPONENTS
Yoshiaki Tadokoro, Masanori Natsui, Yasuhiro Seto
Dept. of Information and Computer Sciences, Toyohashi University of Technology,Toyohashi,441-8580 Japan
Michiru Yamaguchi
Dept. of Computer Engineering, Toyama National College of Maritime of Technology, Imizu, 933-0293 Japan
Keywords: pitch estimation, polyphony, unison, octave different tone, three-times tone, transcription.
Abstract: There are some difficult polyphony to estimate these pitches for transcription. This paper proposes two new
methods for the pitch estimation of these difficult polyphony. One of them is based on the beat components
of the polyphony analyzed by the short-time Fourier transform (STFT). The other is a method noticing the
period of the residual signal after the elimination of polyphony components using a comb filter
(
N
zzH
−
−= 1)(
). These methods are based on the fact that there is a small frequency difference between
the real sound and the ideal one.
1 INTRODUCTION
Musical transcription is to produce scores from
musical sounds and is necessary in the musical field,
musical retrieval and also a significant problem in
artificial intelligence (Roads, 1985), (Sterian and
Wakefield, 2000), (Pollastri, 2002). In the
transcription, the pitch estimation is most important
and many studies have been done (Roads, 1996),
(Tadokoro et al, 2001, 2002, 2003). We also
proposed a unique method of the pitch estimation
that is based on the elimination of the pitch and its
harmonic components using the cascade or parallel
connections of the comb filters (Tadokoro et al,
2001, 2002, 2003). But there is a difficult problem in
the pitch estimation that has not been solved clearly.
That is the pitch estimation of polyphony where the
frequency components of each tone overlap
completely or partly. For this problem, the methods
based on the musical rules (Katano et al, 1996), the
assumption of power spectra addition (Ueda and
Hashimoto, 1997) and the genetic algorithm (Ono et
al, 1997) have been proposed, but they have some
problems for the practical use.
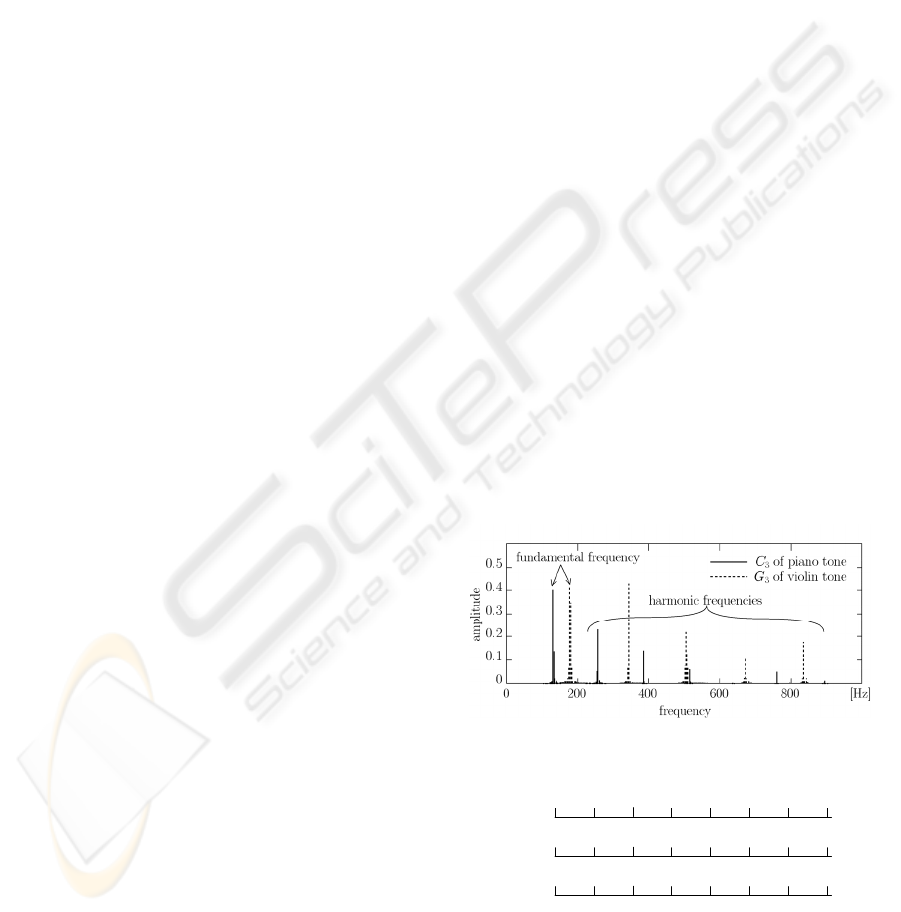
Figure 1 shows the spectra of a piano sound (
3
C :
tone name
C in octave 3) and a violin sound (
3
G ).
Showing in Fig.1, a musical sound is composed of a
basic frequency
p
f (pitch) and its harmonic
components
p
nf
. The frequency ratio between
adjacent tones in the equal temperament of 12
degrees is
12/1
2 . And so it is occurred that the
Figure 1: Examples of magnitude spectrum of musical
sounds.
tone p1
(C4)
tone p2
(C5)
tone p3
(G5)
1p
f
1
2
p
f
1
3
p
f
2p
f
3p
f
1
4
p
f
1
5
p
f
1
6
p
f
1
7
p
f
2
3
p
f
2
2
p
f
3
2
p
f
tone p1
(C4)
tone p2
(C5)
tone p3
(G5)
1p
f
1
2
p
f
1
3
p
f
2p
f
3p
f
1
4
p
f
1
5
p
f
1
6
p
f
1
7
p
f
2
3
p
f
2
2
p
f
3
2
p
f
Figure 2: Overlap relation of frequency components of
difficult polyphony.
168
Tadokoro Y., Natsui M., Yamaguchi M. and Seto Y. (2006).
PITCH ESTIMATION OF DIFFICULT POLYPHONY SOUNDS OVERLAPPING SOME FREQUENCY COMPONENTS.
In Proceedings of the Third International Conference on Informatics in Control, Automation and Robotics, pages 168-173
DOI: 10.5220/0001206101680173
Copyright
c
SciTePress
p
N
p
zzH
−
−= 1)(
p
f
p
f3
p
f2
p
N
p
zzH
−
−= 1)(
p
f
p
f3
p
f2
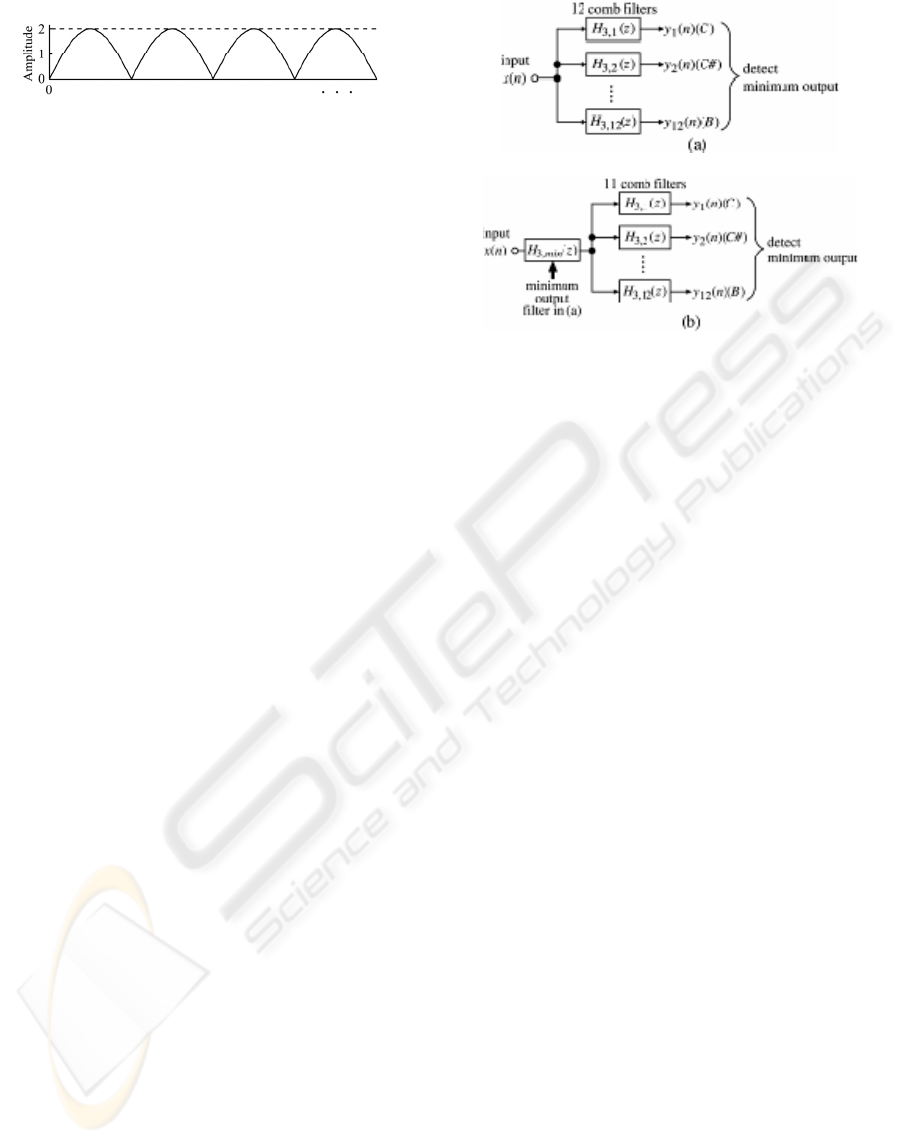
Figure 3: Magnitude characteristic of the comb filter.
frequency components of some polyphony overlap
as demonstrated in Fig.2. We have proposed the new
pitch estimation method using comb filters as shown
in Fig.3. The comb filter to eliminate the tone
1p
also eliminates the tones
2p and 3p in Fig.2, and so
we cannot estimate the pitches of tones
2p and 3p .
The pitch estimation for these polyphony is also an
unsolved problem in other pitch estimation methods.
This paper presents two new methods for the pitch
estimation of difficult polyphony. One of them is a
method based on the beat signals of polyphony
frequency components analyzed by the short-time
Fourier transform (STFT) and the starting point
difference of each tone. Actual polyphony has a
small time difference between the starting points of
each tone and a small frequency difference between
each frequency component, but ideally these start
points and frequency components are same. From
these starting point difference and the beat signals
by the frequency difference, we can estimate the
pitches of the difficult polyphony. The other is a
method based on the period measurement of the
residual signal that is an output signal of the comb
filter to eliminate the polyphony frequency
components. The residual signal is occurred by the
frequency difference between an ideal and a real
musical sounds. From the periods of the residual
signal, we can obtain the clues of the pitches of the
difficult polyphony.
In this paper, we assume that the polyphony is
composed of two tones in the octave 4 and 5 of
which lower pitch has already estimated by the pitch
estimation method described in section 2. And the
input polyphony is made from real sounds of the
RWC music database (the Real World Computing
Partnership in Japan). Each tone has almost same
amplitude. The sampling frequency is
kHzf
s
1.44= .
Figure 4: Pitch estimation system using parallel connected
comb filters and minimum output.
2 PITCH ESTIMATION METHOD
USING COMB FILTERS
Figure 3 shows a frequency characteristic of a comb
filter (
p
N
p
zzH
−
−= 1)( ). The comb filter has zero
points at
nNf
s
)/( where
s
f is a sampling
frequency. Using a comb filter, we can eliminate all
components of one tone of which basic frequency
p
f (pitch frequency) is Nf
s
/ . The feature of our
pitch estimation method is to eliminate the
frequency components of a musical sound using
these comb filters. The conventional pitch estimation
methods, on the other hand, are based on the
extraction of the pitch frequencies.
Figure 4 shows one of the pitch estimation systems
that have been proposed by us. This pitch estimation
system is composed of twelve comb filters
connected in parallel where the lowest notch
frequency (zero point) of each comb filter is
corresponding to each tone’s basic frequency in one
octave. If the input sound is monophony, then we
can estimate the pitch of its sound by knowing the
zero output of the parallel connected twelve comb
filters. When the input sound is polyphony, we can
detect the pitches by knowing the minimum output
of the parallel connected comb filters and then
connecting its comb filter to other parallel connected
eleven comb filters in cascade and detecting the
minimum output of the eleven comb filters as shown
in Fig.4. But if the polyphony is difficult one
showing in Fig.2, we cannot estimate the pitches
other than the lowest pitch, because other tones are
eliminated by the comb filter corresponding to the
lowest pitch. The pitch estimation method for these
PITCH ESTIMATION OF DIFFICULT POLYPHONY SOUNDS OVERLAPPING SOME FREQUENCY
COMPONENTS
169
difficult polyphony has not been developed also by
other pitch estimation methods.
(a)
(b)
2ms
STFT
STFT
(c)
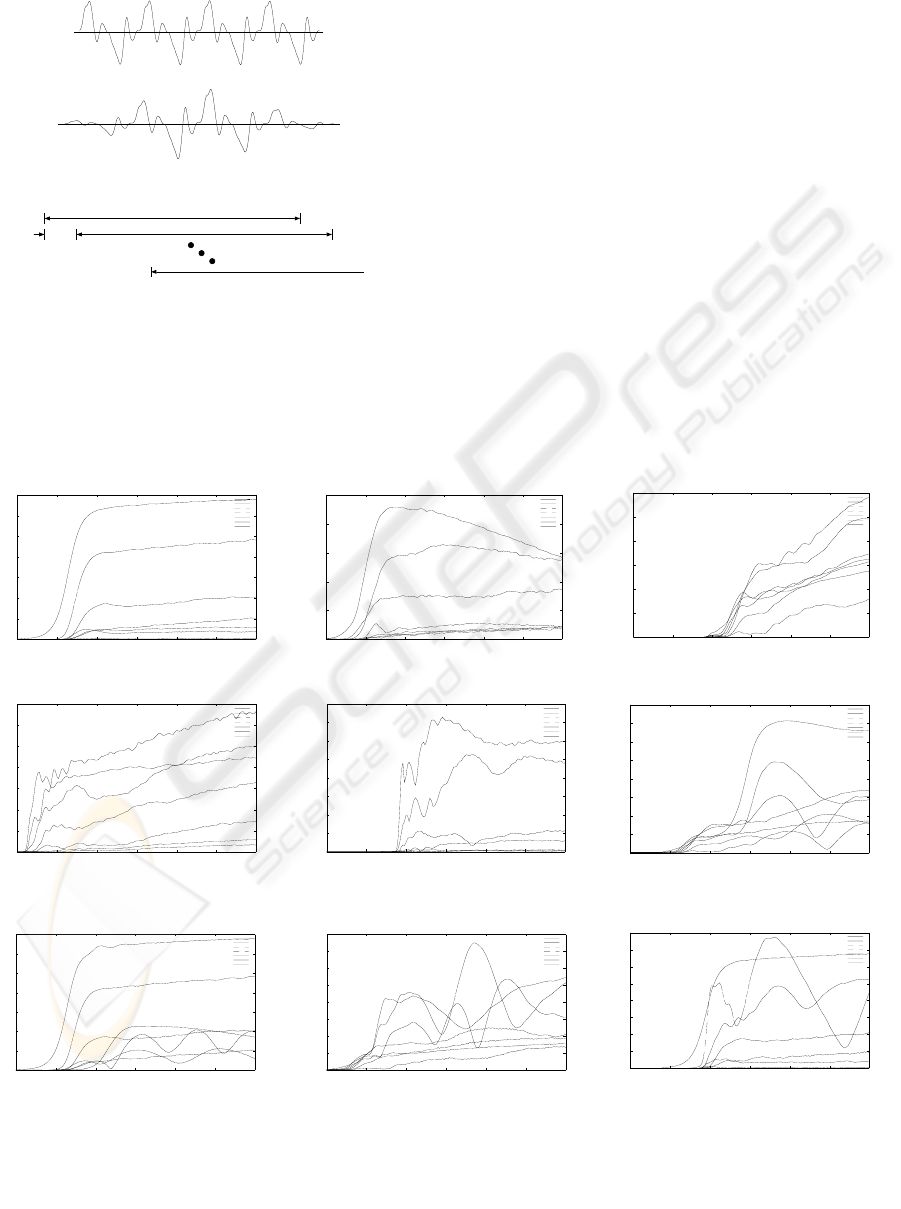
Figure 5: Calculations of STFTs, (a) four periods data, (b)
hamming windowed data, (c) STFTs every 2 ms.
3 SHORT-TIME FOURIER
TRANSFORM (STFT) METHOD
3.1 Calculations of STFTs and Their
Results
We calculate the STFTs for four periods data of a
basic component of a musical sound windowed by the
hamming window every 2 ms as shown in Fig.5.
Figure 6 shows the time changes of the magnitude
characteristics of each frequency component of some
musical sounds, where +50 ms or -50 ms means that
its tone starts at 50ms after or before the clarinet C4
tone starts, respectively.
3.2 Consideration of Pitch
Estimation
As mentioned in section 1, we assume that polyphony
is composed of two tones and we know the pitch of
the lower tone. From the results in Fig.6, we want to
discriminate the following four tones, that is, (1)
t
t
Figure 6: Magnitude spectrum components by STFT.
0
0.01
0.02
0.03
0.04
0.05
0.06
0.07
0 0. 05 0.1 0.15 0.2 0.25 0.
3
magnit ude
time
[
s
]
1
2
3
4
5
6
7
1
2
3
4
5
6
7
0
0.005
0.01
0.015
0.02
0.025
0.1 0.15 0.2 0. 25 0.3 0.35 0.
4
magnit ude
time
[
s
]
1
2
3
4
5
6
7
1
2
3
4
5
6
7
0
0.01
0.02
0.03
0.04
0.05
0.06
0.07
0.08
0 0.05 0.1 0.15 0.2 0.25 0.
3
magni tude
time
[
s
]
1
2
3
4
5
6
7
1
2
3
4
567
0
0.01
0.02
0.03
0.04
0.05
0.06
0.07
0.08
0 0.05 0.1 0.15 0.2 0.25 0.
3
magni tude
time
[
s
]
1
2
3
4
5
6
7
1
2
3
4
5
6
7
0
0.01
0.02
0.03
0.04
0.05
0.06
0.07
0 0.0 5 0.1 0.15 0.2 0.25 0.
3
magni t ude
time
[
s
]
1
2
3
4
5
6
7
1
2
3
4
5
6
7
0
0.01
0.02
0.03
0.04
0.05
0.06
0.07
0.08
0 0.0 5 0.1 0.15 0.2 0.25 0.
3
magnitude
time
[
s
]
1
2
3
4
5
6
7
1
2
3
4
5
6
7
0
0.01
0.02
0.03
0.04
0.05
0.06
0.07
0.08
0 0.0 5 0.1 0.15 0.2 0.25 0.
3
magnitude
time
[
s
]
1
2
3
4
5
6
7
1
2
3
4
5
6
7
(a) clarinet C4
(b) clarinet C5
(c) trumpet C4
(d) trumpet C5
(e) trumpet G5
(g) clarinet C4 +
clarinet C5 (+50 ms)
(h) trumpet C4 +
trumpet C5 (+50 ms)
0
0.005
0.01
0.015
0.02
0.025
0.03
0 0. 05 0.1 0.15 0.2 0.25 0.
3
magni tude
time
[
s
]
1
2
3
4
5
6
7
1
2
3
4
5
6
7
0
0.01
0.02
0.03
0.04
0.05
0.06
0.07
0 0.05 0.1 0.15 0.2 0.25 0.
3
magni tude
time
[
s
]
1
2
3
4
5
6
7
1
2
3
4
5
6
7
(i) clarinet C4+
trumpet G5 (+50 ms)
(f) clarinet C4+
trumpet C4(-50 ms)
ICINCO 2006 - SIGNAL PROCESSING, SYSTEMS MODELING AND CONTROL
170

monophony (C4) or polyphony (C4 +
α
), (2)
polyphony (C4 + C4 : unison), (3) polyphony
(C4+C5) :octave), (4) polyphony (C4+G5:three-
times tone), where we assume the lower tone is C4
and we denote these tones by (2) unison, (3) octave
and (4) three-times tone.
First, we must discriminate if the input sound is
monophony or polyphony. If we detect the beat
components, then we know the sound may be
polyphony. But there are some monophony with beat
components like trumpet G5 in Fig.6 (e). Another
method to determine if the sound is monophony or
polyphony is to notice the time difference of the
starting points. For example, we can detect the
difference of the starting points in the case of Fig.6 (f).
Next, we must determine if the tone is unison,
octave or three-times tone. If we detect that all most
components of the sound are beating, we can know
the sound may be a union, for example in the case of
Fig.6 (f). If even components are beating like Fig.6
(g) and (h), we can know the sound may be an octave.
If harmonic components of the third component are
beating like Fig.6 (i), we can determine the sound
may be a three-times tone.
The pitch estimation method by the beat signals
uses some measurement time, about 100 or 200ms.
This is a problem to estimate the pitches for shorter
sounds.
4 COMB FILTER METHOD
In this method, we process an input sound using a
comb filter and the sample data of 2000 (45 ms) to
3000 (68 ms) from the starting point of the input
sound. For simplicity, we assume that the lower tone
of polyphony is a C4 tone. In this case, we must
discriminate the following four tones, (1) monophony
C4 or polyphony, (2) polyphony (C4+C4: unison), (3)
polyphony (C4+C5:octave), (4) polyphony (C4+G5:
three-times tone).
First, an input sound is passed by a comb filter C4.
The comb filter C4 means the filter
p
N
p
zzH
−
−= 1)(
where
p =C4 and
62.261/1.44[]/[ kHzffN
psp
==
.168] =Hz Ideally the comb filter C4 can eliminate
all above four tones, i.e., monophony, unison, octave
and three times tone. But we can obtain a small output
signal caused by some frequency difference from
ideal frequencies. Next, we measure the periods of the
output signal of the comb filter C4. From these
periods, we can get the clues to discriminate the
above four tones.
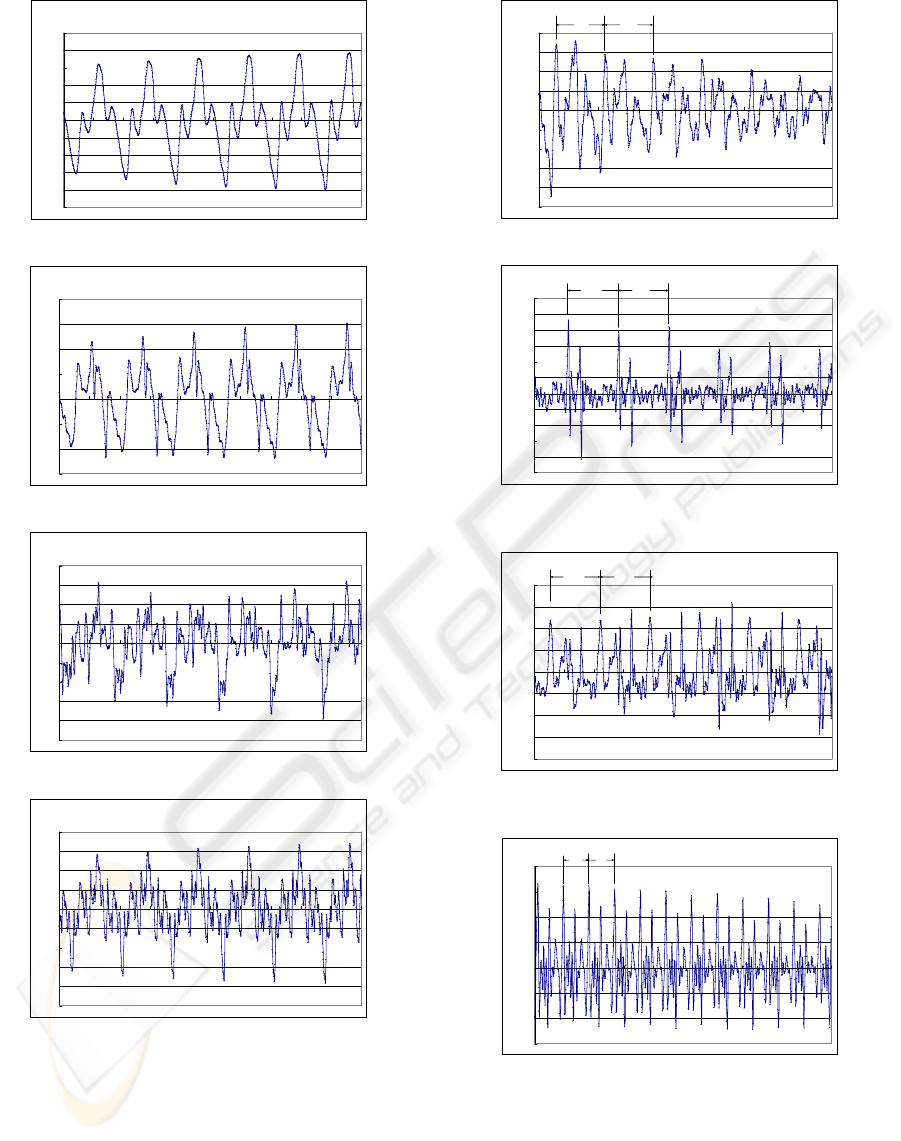
Figure 7 shows the input and output waveforms
(sample number, n=2000-3000) of the comb filter C4:
input ((a)-(d)) and output ( (e)-(i)).
First we use the comb filter C4 of
168
0
=
p
N that
is a sample number determined from
].62.261/44100[/ HzHzff
ps
= When the
monophony C4 in Fig.7(a) is filtered by the comb
filter C4 of
168
0
=
p
N
, we obtain the output signal in
Fig.7(e) of which amplitude is decreased by the factor
of 0.04 from the input one. Next we measure the
period of the comb filter output signal (Fig.7(e)) and
obtain the period of 166
1
=
p
N . Then we filter the
input sound again by the comb filter C4 of 166
1
=
p
N
and this time we measure the period to be
167
2
=
p
N .When we pass the input sound through
the comb filter C4 of
167
2
=
p
N
, we obtain the filter
output signal having its period
166
3
=
p
N . These
waveforms of the output signals in the comb filters of
167
2
=
p
N
and
166
3
=
p
N
are almost same and so
we determine that the input sound is monophony C4.
When the input sound of Fig.7(b) is filtered by the
comb filter C4 of
168
0
=
p
N
, we obtain the filter
output signal in Fig.7(f) of which amplitude is
decreased by the factor of 0.16. From the output
signal in Fig.7(f), we measure the period to be
170
1
=
p
N . Then we filter the input signal in
Fig.7(b) by the comb filter C4 of
170
1
=
p
N and we
obtain the output signal in Fig.7(g) with the period of
168
2
=
p
N (or 167). The waveforms of Fig.7(f) and
(g) are different and so we determine that the input
sound of Fig.7 (b) is polyphony (C4+C4: unison).
Above we showed an example to discriminate the
monophony and polyphony in the comb filter method.
But we think that a more effective method using a
comb filter is to use two input sounds obtained from
two different points and measure the amplitude ratio
of the output/input signals of the comb filter C5 or G5.
If the input sound is monophony, then the
output/input ratio does not change for two input
sounds. If the input sound is polyphony, the
waveforms of two input sounds change for the phase
relation of two tones and so the output/input ratio also
change. We can determine if an input sound is
monophony or polyphony by noticing the change of
the output/input ratio for two input sounds.
Next we consider the polyphony of octave and
three-times tone. When the input sound of Fig.7(c) is
passed through the comb filter C4 of
168
0
=
p
N
, we
PITCH ESTIMATION OF DIFFICULT POLYPHONY SOUNDS OVERLAPPING SOME FREQUENCY
COMPONENTS
171
clarinetC4 n=2000- 3000
-0.25
-0.2
-0.15
-0.1
-0.05
0
0.05
0.1
0.15
0.2
0.25
2000 2100 2200 2300 2400 2500 2600 2700 2800 2900 300
0
(a) input:clarinet C4
clarinetC4+alt - saxC4 n=2000- 3000
-0.3
-0.2
-0.1
0
0.1
0.2
0.3
0.4
2000 2100 2200 2300 2400 2500 2600 2700 2800 2900 300
0
(b) input:clarinet C4+alt-sax C4
clarinetC4+alt - saxC5 n=2000- 3000
-0.5
-0.4
-0.3
-0.2
-0.1
0
0.1
0.2
0.3
0.4
2000 2100 2200 2300 2400 2500 2600 2700 2800 2900 300
0
(c) input:clarinet C4+alt-sax C5
clarinetC4+alt - saxG5 n=2000- 3000
-0.5
-0.4
-0.3
-0.2
-0.1
0
0.1
0.2
0.3
0.4
2000 2100 2200 2300 2400 2500 2600 2700 2800 2900 300
0
(d) input:clarinet C4+alt-sax G5
Figure 7.1: Input waveforms for comb filter C4.
obtain the output signal of Fig.7 (h) of which
amplitude is decreased by the factor 0.5 and we can
measure the period of )87(86
1
=
p
N . The period
comb filt er
(
N=168
)
out
p
ut: in
p
ut
(
clarinetC4
)
n=2000- 3000
-0.01
- 0.008
- 0.006
- 0.004
- 0.002
0
0.002
0.004
0.006
0.008
2000 2100 2200 2300 2400 2500 2600 2700 2800 2900 300
0
166 166
(e) comb filter (N=168) output:input (clarinet C4)
comb filt er C4
(
N=168
)
out
p
ut: in
p
ut
(
clarinetC4+alt- saxC4
)
n=2000- 3000
-0.05
-0.04
-0.03
-0.02
-0.01
0
0.01
0.02
0.03
0.04
0.05
0.06
2000 2100 2200 2300 2400 2500 2600 2700 2800 2900 300
0
170 170
(f) comb filter (N=168) output :input (clarinet C4+ alt-sax
C4)
comb filt er C4
(
N=170
)
out
p
ut: in
p
ut
(
clarinetC4+alt- saxC4
)
n=2000- 3000
-0.04
-0.03
-0.02
-0.01
0
0.01
0.02
0.03
0.04
2000 2100 2200 2300 2400 2500 2600 2700 2800 2900 300
0
168 167
(g) comb filter (N=170) output :input (clarinet C4+alt-sax
C4)
comb filter C4
(
N=168
)
out
p
ut :in
p
ut
(
clarinetC4+alt- saxC5
)
n=2000- 3000
-0.15
-0.1
-0.05
0
0.05
0.1
0.15
0.2
2000 2100 2200 2300 2400 2500 2600 2700 2800 2900 300
0
86 87
(h) comb filter (N=168) output :input(clarinet C4+alt-sax
C5)
ICINCO 2006 - SIGNAL PROCESSING, SYSTEMS MODELING AND CONTROL
172

comb filt erC4
(
N=168
)
out
p
ut :in
p
ut
(
clar inetC4+alt - saxG5
)
n=2000- 3000
-0.03
-0.02
-0.01
0
0.01
0.02
0.03
0.04
2000 2100 2200 2300 2400 2500 2600 2700 2800 2900 3000
279/ 5=56
(i) comb filter (N=168) output:input (clarinet C4 +alt-sax
G5)
Figure 7.2: Output waveforms of comb filter C4.
of 86
1
=
p
N corresponds to the basic period of the
C5 tone and we can determine that the input sound is
polyphony of the octave (C4+C5). In this case, we
know that the basic frequency of the C5 tone is
different from
p
nf with some extend, because the
output amplitude of the comb filter is not decreased
largely.
When we pass the input sound of Fig.7 (d)
through the comb filter of
168
0
=
p
N
, we get the
output signal of Fig.7 (i) of which amplitude is
decreased by the factor of 0.1. From the output signal
of Fig.7 (i), we measure the period of
56
1
=
p
N and
its period corresponds to the G5 tone. We can clearly
measure the period of the output signal using the
autocorrelation function as shown in Fig.8. Then we
can determine that the input sound is polyphony
of the three-times tone (C4+G5).
By the method mentioned above, we can
discriminate the difficult four tones (monophony or
polyphony, unison, octave and three-times tone).
5 CONCLUSIONS
We proposed two new methods to estimate the
pitches of the difficult polyphony where all or some
frequency components of the tones overlap, i.e.
unison, octave and three-times tones. One of them is
the method using the beat signals of the spectrum
components analyzed by the STFT that are happened
for a small frequency difference between two tones.
This method has some measurement time of about
100 or 200 ms for the detection of the beat signals.
The other is the method using a comb filter. We can
obtain a small output signal of the comb filter for a
small frequency difference between the ideal and
real tones. We can discriminate these difficult four
clarinetC4+alt- saxG5 : autocorrelation function
-0.0015
- 0.001
-0.0005
0
0.0005
0.001
0.0015
0.002
0.0025
0.003
0.0035
0.004
1 21 41 61 81 101 121 141 161
56
clarinetC4+alt- saxG5 : autocorrelation function
-0.0015
- 0.001
-0.0005
0
0.0005
0.001
0.0015
0.002
0.0025
0.003
0.0035
0.004
1 21 41 61 81 101 121 141 161
56
Figure 8: Autocorrelation function of Fig.7-2 (i).
tones by the measurements of the periods of the
filter output signals. The measurement time of the
comb filter method is about 50 ms.
As a feature research, we want to test the
proposed two methods for many musical sound data.
REFERENCES
Kashino,K., Kinoshita,T., Nakadai,K. and Tanaka,H.,
1996. ”Chord recognition mechanisms in the OPTIMA
processing architecture for music scene analysis,”
Trans. IEICE of Japan, vol.J79-D-II, no.11, pp.1771-
1781.
Ono, T., Saito,H. and Ozawa,S., 1997. “Mixed tones
estimation for transcription using GA,” Trans.SICE of
Japan, vol.33, no.5, pp.417-423.
Pollastri,E., 2002. “A pitch tracking system dedicated to
process singing voice for musical retrieval,” Proc. of
IEEE Int. Conf. on Multimedia and Xpo, ICME2002.
Roads,C.,1985. ”Research in music and artificial
intelligence,” ACM computing Survey, vol.17, no.2,
pp.163-190.
Roads,C.,1996. ”The Computer Music Tutorial,” MIT
Press.
Sterian,A., Wakefield,G.H.,2000. ”Musical transcription
system : From sound to symbol,” Proc. AAAI-2000
Workshop.
Tadokoro,Y.and Yamaguchi,M., 2001. “Pitch detection of
duet song using double comb filters,” Proc. of
ECCTD’01, I, pp.57-60.
Tadokoro, Y., Matsumoto, W. and Yamaguchi,M.,2002.
“Pitch detection of musical sounds using adaptive
comb filters controlled by time delay,” ICME2002,
P03.
Tadokoro,Y., Morita, T. and Yamaguchi,M., 2003. “Pitch
detection of musical sounds noticing minimum output
of parallel connected comb filters, “ IEEE
TENCON2003, tencon-072.
Ueda,M. and Hashimoto,S., 1997. “Blind decomposition
alagorithm for the sound separation,” Trans. IPS of
Japan, vol.38, no.1, pp.146-157.
PITCH ESTIMATION OF DIFFICULT POLYPHONY SOUNDS OVERLAPPING SOME FREQUENCY
COMPONENTS
173
