
Classifying Web Metrics
1
Julián Ruiz, Coral Calero, Mario Piattini
ALARCOS Reseach Group
Computer Science Department. University of Castilla-La Mancha
Paseo de la Universidad, 4
13071, Ciudad Real (Spain)
Abstract. Quality is an essential characteristic for web success. Several authors
have defined different methodologies, guidelines, techniques and tools in order
to assure the quality of web sites. Recently, a wide ranging set of metrics have
been proposed for quantifying web quality attributes. However, there is little
consensus among them. These metrics are sometimes not well defined, neither
empirically or theoretically validated. Moreover, these metrics focus on
different aspects of web sites or different quality characteristics, confusing the
practitioners interested in using these metrics rather than helping them. With the
aim of classifying these metrics and make their use easier, we have elaborated
the WQM model (Web Quality Model), which distinguishes three dimensions
related to features, lifecycle processes and quality characteristics. In this paper
we analyze the most relevant web metrics using this framework and present
some preliminary conclusions.
1. Introduction
Nowadays web technology has attained an absolute importance within the
Information Systems. The ever increasing presence of web technology and its
criticality for organizations survival make essential to assure a minimum web quality,
which it is not always the case [3, 11]. In the last years several experts have work out
different proposals to improve web quality: methodologies [35], quality frameworks
[13], estimation models [28], guides of styles and criteria [47], etc.
Since nineties, a wide ranging set of metrics have been proposed for quantifying
web quality attributes [2,4,6-8,10,12-14,17-32,34-39,41-44]. However, these metrics
are sometimes not well defined, neither empirically or theoretically validated.
Moreover, these metrics focus on different aspects of web sites or different quality
characteristics, confusing the practitioners interested in using these metrics rather than
helping them. Recently, Dhyani et al. [12] proposed a web classification framework
using different categories: web graph properties, web page significance, usage
1
This research is part of the TAMANSI project (PCB-02-001) supported by the Consejeria de
Ciencia y Tecnología of Junta de Comunidades de Castilla-La Mancha (Spain) and the
CALIPO project (TIC 2003-07804-C05-03) supported by the Ministerio de Ciencia y
Tecnologia.
Ruiz J., Calero C. and Piattini M. (2004).
Classifying Web Metrics.
In Proceedings of the 1st International Workshop on Software Audits and Metrics, pages 22-37
DOI: 10.5220/0002686800220037
Copyright
c
SciTePress
characterization, web page similarity, web page search and retrieval, and theoretical
information. However they discard other important dimensions such as lifecycle and
web features which are included in our model. Moreover, in this survey they do not
consider some very interesting metrics such as [24, 28, 34].
With the aim of classifying these metrics and make their use easier, we have
elaborated the WQM model (Web Quality Model), which distinguishes three
dimensions related to web features, lifecycle processes and quality characteristics.
In the following section we present the WQM model explaining in depth each one
of its dimensions. In the third section we will summarize the result of the
classification of the most relevant web metrics. Conclusions and future work will
appear in the last section.
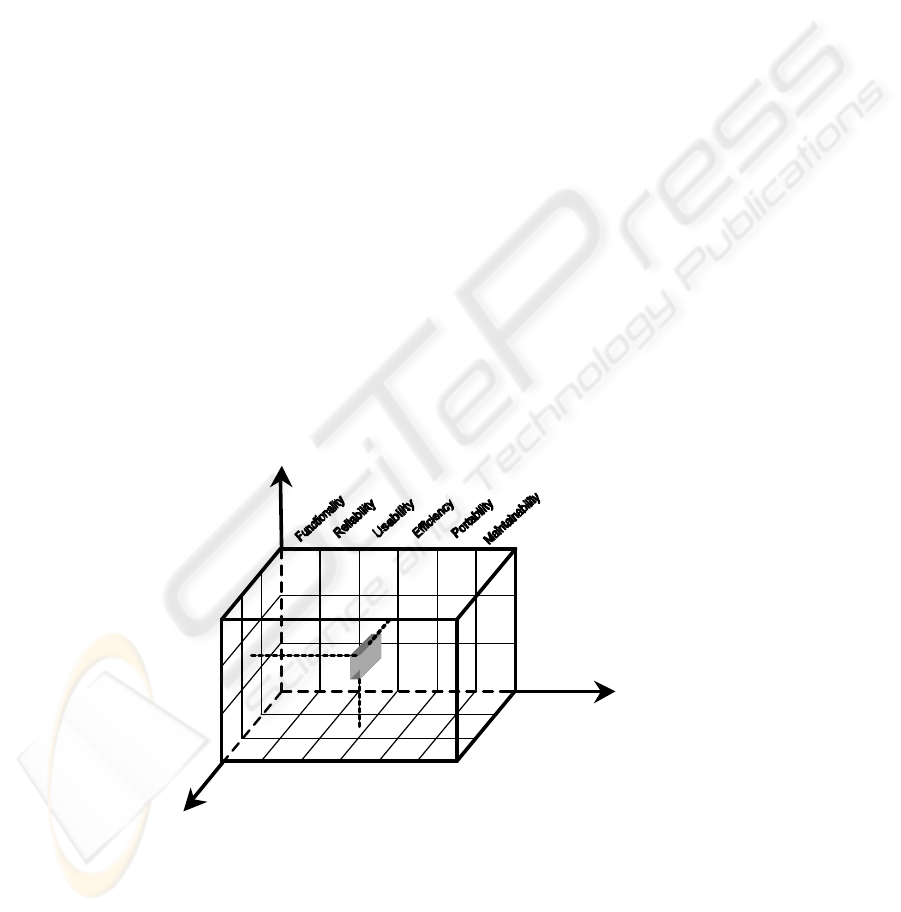
2 The Web Quality Model
In [41] the authors define a cube structure in which they consider three basic aspects
when making a test of a web site. Following this same idea, in [46] we proposed
another “cube” in which the three dimensions represent those aspects that must be
considered in the evaluation of the quality of a web site: features, life cycle processes
and quality aspects, that can be considered orthogonal. This model can be used for
classification purposes, so it will be possible to classify not only metrics but also
methodologies, style guides, and other proposals related to web. In fact we have used
this model for classifying different works on web engineering and we have refined
our dimensions.
In this section we will summarize the last the current version of the WQM, which
is represented in figure 1.
Figure 1. Graphic representation of the model.
Development
Exploitation
Maintenance
Content
Presentation
Navigation
Quality Characteristics
Lifecycle Processes
Web Features
23

2.1 Web Feature Dimension
In this dimension we include the three “classic” web aspects: Content, Presentation
and Navigation [7,15,16].
In Content we have included not only data as text, figures, images, video clips, etc,
but also programs and applications that provide functionalities as scripts, CGI
programs, java programs, and others. Data is not only pure data, but also structuring
and representation issues. Due to the closely intertwining of functions and data the
border between them is not clearly drawn, and we consider together.
Navigation concerns the facilities for accessing information and for moving across
the web.
Presentation is related to the way in which content and navigation are presented to
the user.
2.2 Quality Characteristics Dimension
For the description of this dimension we use as basis the Quint2 model [33] based on
the ISO 9126 standard [20]. We have decided to work with this model instead of the
standard because Quint2 extends the ISO standard with new characteristics very
appropriate for web products. Quint2 is a hierarchical model that fixes six basic
characteristics, each has a set of subcharacteristics, to which there a set of attributes
are associated. These are the basic elements. Table 1 shows the characteristic of
Quint2, indicating, if necessary, those subcharacteristics added or removed respect to
ISO 9126.
There is a compliance subcharacteristic for all characteristics (attributes of
software that make the software adhere to application related standards, conventions
in laws and similar prescriptions).
2.3 Life Cycle Processes Dimension
In this dimension we include the diverse processes of the web site life cycle which,
following the ISO 12207-1 standard [19] can be differentiated in main processes. In
the current version of the model we only included three main processes in this
dimension: the development process, the exploitation process (that includes the
operative support to the users) and the maintenance one (that includes the evolution
that experiences the web site).
It is necessary to consider that the development process contains diverse activities:
• Analysis of system requirements: in which the functional and nonfunctional
requirements of the system are specified, including the design restrictions
• Design of the system architecture: in which the main components of hardware
and software, as well as the manual operations of the system will be identified.
• Analysis of the software requirements, including the specification of the
functional and non-functional characteristics, exploitation and execution
requirements and maintenance requirements.
• Design of the software architecture, that is, the high level structure that identifies
the main components of the system.
24
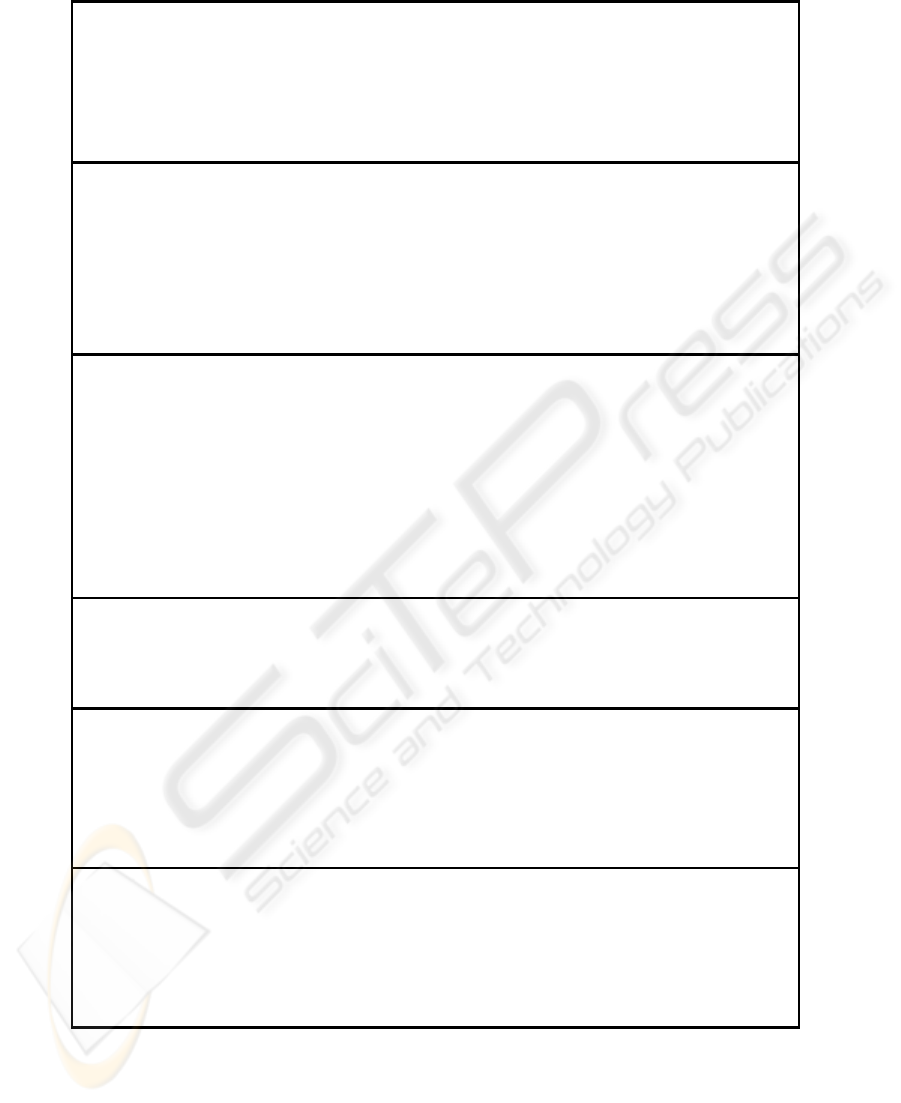
Functionality. A set of attributes that bear on the existence of a set of functions and their specifie
d properties.
The functions are those that satisfy stated or implied needs.
§ Suitability: Attribute of software that bears on the presence and appropriateness of a set of functions for specified tasks.
§ Accuracy: Attributes of software that bear on the provision of right or agreed results or effects.
§ Interoperability: Attributes of software that bear on its ability to interact with specified systems.
§ Security: Attributes of software that bear on its ability to prevent unauthorized access, whether accident
al or deliberate, to
programs or data.
§ Traceability
(Quint2): Attributes of software that bear on the effort needed to verify correctness of data processing on required
points.
Reliability. A set of attributes that bear on the capability of software to m
aintain its level of performance under
stated conditions for a stated period of time.
§ Maturity: Attributes of software that bear on the frequency of failure by faults in the software.
§ Fault tolerance: Attributes of software that bear on its ability to ma
intain a specified level of performance in cases of software
faults or of infringements of its specified interface.
§ Recoverability: Attributes of software that bear on the capability to re-
establish its level of performances and recover the data
directly affected in case of a failure and on the time and effort needed for it.
§ Availability
(Quint2): Attributes of software that bear on the amount of time the product is available to the user at the time it is
needed.
§ Degradability (Quint2): Attributes of software that bear on the effort needed to re-
establish the essential functionality after a
breakdown.
Usability
. A set of attributes that bear on the effort needed for use, and on the individual assessment of such
use, by a stated or implied set of users.
§ Understandability: Attributes of software that bear on the users’ effort for recognising the logical concept and its applicability.
§ Learnability: Attributes of software that bear on the users’ effort for learning its application (for example, control, inp
ut,
output).
§ Operability: Attributes of software that bear on the users’ effort for operation and operation control.
§ Explicitness (Quint2): Attributes of software that bear on the software product with regard to its status (progression bars, etc.).
§ Attractivity (Attractiveness
in Quint2): Attributes of software that bear on the satisfaction of latent user desires and
preferences, through services, behaviour and presentation beyond actual demand.
§ Customisability (Quint2): Attributes of software that enab
le the software to be customized by the user to reduce the effort
required for use and increase satisfaction with the software.
§ Clarity (Quint2): Attributes of software that bear on the clarity of making the user aware of the functions it can perform.
§ Helpfulness (Quint2): Attributes of software that bear on the availability of instructions for the user on how to interact with it.
§ User-friendliness (Quint2): Attributes of software that bear on the users’ satisfaction.
Efficiency. A set of attributes tha
t bear on the relationship between the level of performance of the software and
the amount of resources used, under stated conditions.
§ Time behaviour: Attributes of software that bear on response and processing times and on throughput rates in performing
its
function.
§ Resource behaviour
: Attributes of software that bear on the amount of resources used and the duration of such use in
performing its function.
Portability. A set of attributes that bear on the ability of the software to be transformed from o
ne environment
to another.
§ Adaptability
: Attributes of software that bear on the opportunity for its adaptation to different specified environments without
applying other actions or means than those provided for this purpose for the software in question.
§ Installability: Attributes of software that bear on the effort needed to install the software in a specified environment.
§ Replaceability
: Attributes of software that bear on the opportunity and effort of using it in the place of specified other
software in the environment of that software.
§ Co-existence (not included in Quint2): The capability of the software to co-
exist with other independent software in a
common environment sharing common resources.
Maintainability. A set of attributes that bear on the effort needed to make specified modifications.
§ Analysability
: Attributes of software that bear on the effort needed for diagnosis of deficiencies or causes of failures, or for
identification of parts to be modified.
§ Changeability: Attributes of software that bear on the effort needed for modification, fault removal or for environmental
change.
§ Stability: Attributes of software that bear on the risk of unexpected effect of modifications.
§ Testability: Attributes of software that bear on the effort needed for validating the (modified) software.
§ Manageability (Quint2): Attributes of software that bear on the effort needed to (re)establish its running status.
§ Reusability (Quint2): Attributes of software that bear on its potential for complete or partial reuse in another software product.
Table 1. Model Quality Characteristics
25

• Detailed design of software, including the databases.
• Codification and test, of the different software components and the databases.
• Software integration, where the software components are integrated and proven if
necessary.
• Test of software, that is, the test of qualification based on the specified
requirements.
• Integration of the system.
• Test of the system.
• Installation of software, in the final exploitation environment where it is going to
work.
It is important to emphasize that these activities must not to be developed
sequentially, because, due to the characteristics of the web development, it will be
necessary to use models more iterative even more flexible developments without
following formal methodologies [5].
3. Analysis of Existing Metrics
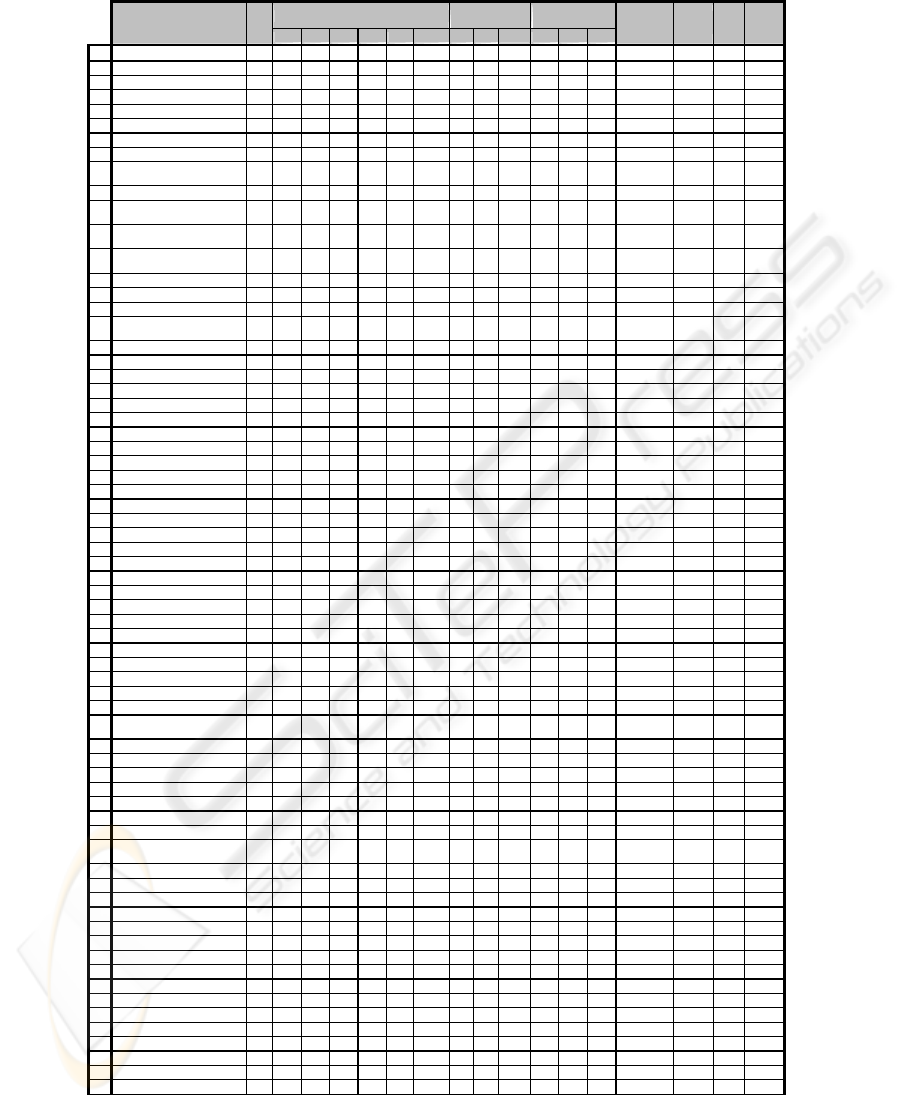
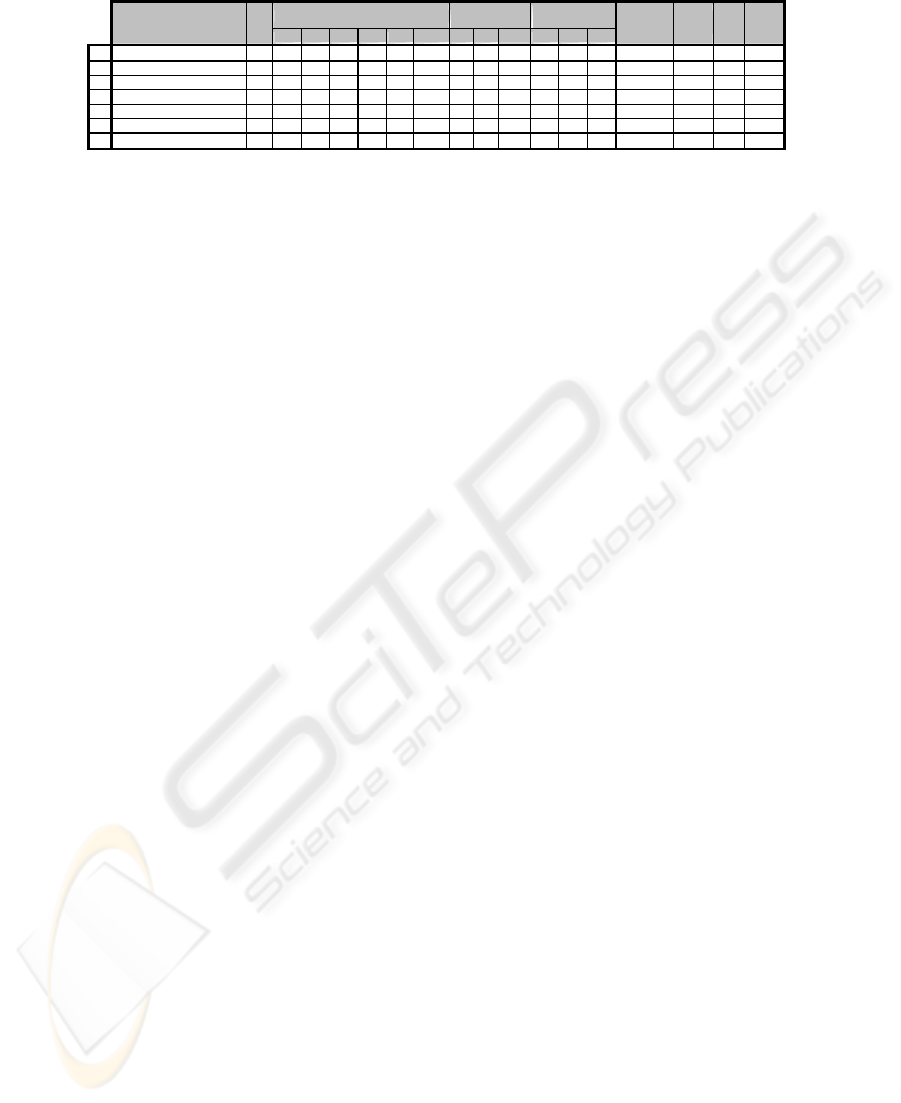
3.1. Surveyed Metrics
For the present study, we have surveyed different works related in some manner with
web topics. We have reviewed about 60 papers, from 1992 to 2003. From all these
works we have selected the ones (about 40) where metric proposals (considered
useful for our classification purposes on WQM) were included, discarding some other
works where the proposed metrics were not really applicable in our context and do
not provide any relevant information. Examples of the discarded metrics include all
the process metrics, focusing, then, our work only on the product metrics. We also
discarded repeated metrics, i.e., those metrics proposed by more than one author. We
included one instance of such metrics only. Finally, 326 metrics were selected, which
are listed in the Appendix of this paper. Finally, we want to note that the process of
classifying metrics is not a simple task. So, we are conscious that some of the
assignments done may be arguable.
3.2 Filling the Cells of the Cube
Although the model does not restrict the number of cells that can be assigned to a
given metric m, for the sake of simplicity and practicality we tried to minimize this
number assigning the metrics to the cells where the metric could be more useful. To
avoid unnecessary complexity, we decided to show in the WQM model only the
quality characteristic assigned, instead of the precise sub-characteristic.
In general, the classification of a metric has been done taking into account the
metric author opinion. However, this information was not complete (with respect to
WQM) and we have made the classification attending to our own understanding. In
26
validation (theoretical and empirical) we have used the results exposed in the
reference.
Assigning metrics to life cycle phases was not easy. We have taken some special
consideration for the exploitation and maintenance stages. In the web world, where
typical timeline in web development is 3-6 months [42], it is difficult to distinguish
when exploitation finishes and maintenance begins. In case of doubt we have
classified metrics in both phases.
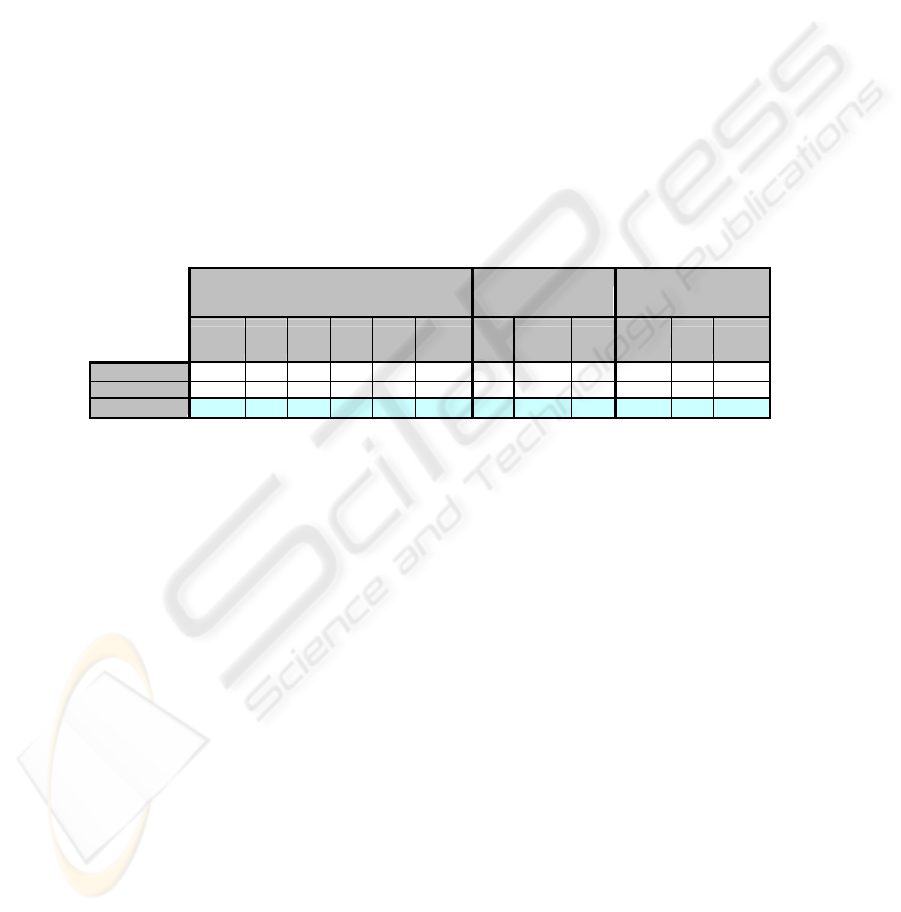
3.3 The Resulting Cube
The list with the detailed assignments of metrics to cells is included in the Appendix.
However, due to the extension of that list, in this section we will summarize its main
figures using one table (table 2) that shows the number of metrics in each cell of the
dimensions. In the row “% Absolute” the sum of the values is not exactly 100%
because a metric can be classified in more then one cell in the cube. We have prorated
these results in the below row, in order to get a 100% total. So, “% Prorated” values
represent the probability a metric to being to a specific cell.
Quality Characteristics
Lifecycle
Processes
Website
Features
Functio
nality
Relia
bility
Usa
bility
Effici
ency
Porta
bility
Maintain
ability
Design
Exploi
tation
Mainte
nance
Content
Presen
tation
Naviga
tion
Total
50
21
263
47
40 79
64
267
162
99 179 67
% Absolute
15%
6%
81%
14%
12% 24%
20%
82%
50%
30% 55% 21%
% Prorated
10%
4%
53%
9%
8% 16%
13%
54%
33%
29% 52% 19%
Table 2. Metrics Classification.
Figure 2 shows metric distribution across the three model dimensions: web
features, quality characteristics, and lifecycle processes, using prorated figures. Next
subsections present several conclusions that we can extract from it.
3.3.1 Web Features Dimension
About 52% of the metrics were “presentation” metrics. This value confirms the
tendency in the web world of giving the most importance to the web end-user making
the sites as attractive as possible.
At this point it is convenient to remark that usually there is a confusion between
presentation and navigation [7] so, perhaps the results for the navigation could vary
depending on the person who made the classification.
3.3.2 Quality Characteristics Dimension
Most of the metrics (53%) are usability metrics. Recording that this data is prorated,
because if we examine absolute data (table 2) we can see that 81% of metrics are
27
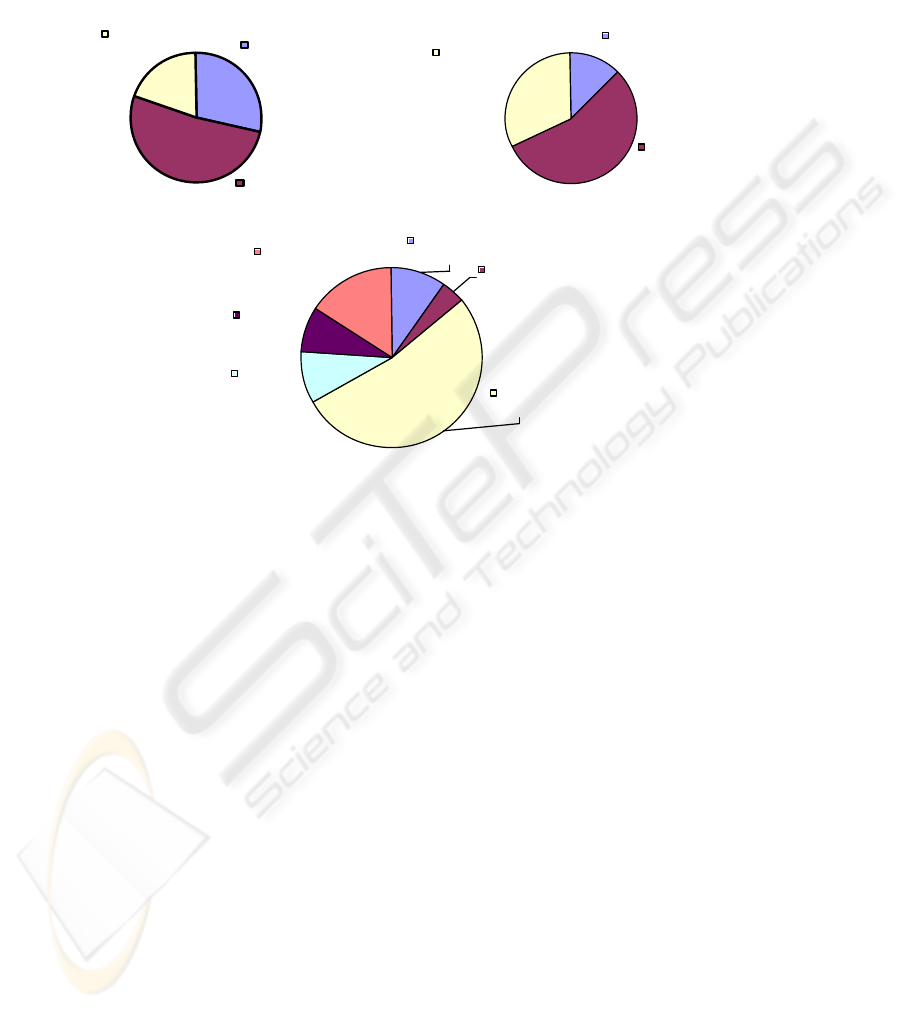
related to usability. Again this value confirms the end-user focus trying to design
usable web sites that attract users.
Figure 2. Metric Distribution across the Model Dimensions
However, it is curious that only 4% of metrics focuses on reliability, when this
characteristic it is also extremely important for customer acceptance of web sites.
Perhaps, reliability metrics for web do not differ too much from reliability metrics for
other kind of software or systems.
Finally, we think that the appearance of new devices (as PDA, mobiles, …) will
encourage the definition of new portability metrics.
3.3.3 Life-cycle Dimension
Finally, the fact that exploitation and maintenance are the phases with more
metrics can be justified taking into account the evolutionary nature of the web.
3.4 Metrics Properties
We have also evaluate the metrics considering the following properties [9]:
• Granularity Level, depending if the metric focuses on a single web page
(47%) or a web site (53%).
• Theoretical Validation helps us to know when and how to apply metrics.
Quality Characteristics
Efficiency
9%
Portability
8%
Maintainability
16%
Usability
53%
Functionality
10%
Reliability
4%
Website Features
Content
29%
Presentation
52%
Navigation
19%
Lifecycle Processes
Design
13%
Exploitation
54%
Maintenance
33%
28

• Empirical Validation, here the objective is to prove the practical utility of
the proposed metrics.
• Automated Support, i.e., whether or not there is a support tool that
facilitates the calculation of the metrics (79% are automated).
The results of this evaluation are shown in the Appendix of this document, which
contains the values assigned to the features of each metric. As we can see there is a
balanced distribution of metrics defined for web pages and web sites. The results for
the validation confirm that unfortunately in the web metrics world validation is not
considered as a main issue, specially theoretical validation (4%) but also, empirical
validation (32%). A big amount of metrics are automated. This is very important if we
want that metrics are really used in web development and maintenance projects.
4. Conclusions and Future Work
There have been many metric proposals for web quality, but no consensus has been
reached for their classification. To advance in this area, it is essential to rely on a
model that allows us to classify and systematize metric use. In this paper we have
presented such the WQM and we have surveyed the most relevant web metrics.
Nevertheless, this is only a first approach that needs to be reviewed until arriving at
a definitive and complete version that can be used with total reliability and guarantee
of success.
Regarding to the model, some modifications could be carry out in the life cycle
dimension including a project process (following the standard ISO 15288, System
Life Cycle Processes [21]) in order to include in the WQM proposals related to web
estimation effort [28].
Regarding to the metrics, we do not claim this survey is complete. It would be
necessary to make an even more exhaustive study of the state of the art. We also
intend to define new metrics in those “cells” in which the nonexistence of metrics is
detected.
References
1. Abrahão S., Olsina L., Pastor O. (2002) A Methodology for Evaluating Quality and
Functional Size of Operative WebApps, In Proc. of 2
nd
International Workshop on Web
Oriented Software Technology, ECOOP'02 Workshops, Málaga, Spain, pp. 1-20.
2. Abrahão, S., Condori-Fernandez, N., Olsina, L., Pastor, O. (2003) Defining and Validating
Metrics for Navigational Models. Ninth International Software Metrics Symposium
(METRICS'03), September 03 – 05.
3. Abrahão, S., Pastor, O. (2003) Calidad de Sistemas Web. En: Calidad en el Desarrollo y
mantenimiento del software. Madrid, Ed. Ra-Ma (spanish).
4. Alves de Silva, E.A., Ponti de Mattos Fortes, R. Web Quality Metrics: An Analysis Using
Machine Learning Systems. International Conference on Information Systems, Analysis
and Sintesis. World Multiconference on Systemics, Cybernetics and Informatics.
Information Systems Technology. SCI 2001/ ISAS 2001. Volumen XI.
29

5. Avison, D. E., Fitzgerald, G. (2003). Where Now for Development Methodologies?
Communications of the ACM, 46 (1), 79-82.
6. Bajaj, A., Krishnan, R. CMU-WEB: A Conceptual Model for Designing Usable Web
Applications. J. Database Manag. 10(4): 33-43 (1999)
7. Baresi, L., Morasca, S., Paolini, P. Estimating the Design Effort of Web Applications. Proc.
9
th
International Metrics Symposium (METRICS’03) IEEE, 2003.
8. Botafogo, R., Rivlin, E., Shneiderman, B. Structural analysis of hypertexts: Identifying
hierarchies and useful metrics. ACM Trans. Inform. Systems, 10(2):142--180, Apr. 1992.
9. Calero,C., Piattini, M., and Genero, M. (2001). Empirical Validation of Referential
Integrity Metrics. Information Software and Technology. Special Issue on Controlled
Experiments in Software Technology. Vol. 43, Nº 15. 2001.
10. Cleary (2000), Web-Based Development and Functional Size Measurement. Proc. IFPUG
Annual Conference, San Diego-CA, September.
11. Cutter Consortium, (2000) Poor Project Management – Problem of E-Projects. October
2000, http://www.cutter.com/press/001019.html
12. Dhyani, D., NG, W.K. and Bhowmick, S.S. (2002). A Survey of Web Metrics. ACM
Computing Surveys, 34 (4), 469-503.
13. Donaldson, A.J.M., Cowderoy, A.J.C. (1997). Towards Multimedia Systems Quality. ESSI-
SCOPE conference, Dublin.
14. Fink D. (2001) Web Site Effectiveness: A Measure of Information and Service Quality,
Information Resource Management Association International Conference, Toronto,
Canada.
15. Fraternali, P. Tools and Approaches for Developing Data-Intensive Web Applications: A
survey. ACM Computing Surveys, Vol 31, No. 3, Sept 1999
16. Gómez, J., Cachero, C., Pastor, O. (2001). Conceptual Modeling of Device-Independent
web applications. IEEE Multimedia. April-June 2001. pp. 26-39
17. Herder, E. Metrics for the Adaptation of Site Structure. Proc. of the German Workshop on
Adaptivity and User Modeling in Interactive Systems ABIS02 - Hannover, 2002 pp. 22-26
18. Herzinger M. Hyperlink Analysis for the web. IEEE Internet Computing, Jan-Feb 2001.
19. ISO/IEC (1995) ISO/IEC 12207. Information Technology. Software Life Cycle Processes.
20. ISO/IEC (2001) ISO/IEC 9126. Software Product Evaluation-Quality Characteristics and
Guidelines for their Use.
21. ISO/IEC (2001) ISO/IEC 15288. Systems Engineering – System Life Cycle Processes.
22. Ivory, M., Hearst, M. The State of the Art in Automating Usability Evaluation of User
Interfaces. ACM Comput. Surv. Vol. 33, No. 4: 470-516 (Dec. 2001)
23. Ivory, M.Y., Sinha, R.R., Hearst, M.A.: Empirically Validated Web Page Design Metrics,
SIGCHI 2001.
24. Ivory, M.Y.. An Empirical Foundation for Automated Web Interface Evaluation. PhD
Thesis, University of California, Berkeley, Computer Science Division, 2001.
25. Katterattanakul, P. and Siau, K. (2001). Information Quality in Internet Commerce Design.
“Information and database quality”. Kluwer Academic.
26. Lafuente, G., González, J., Olsina, L. (2001) Automatizando Métricas Web, 4º Encontro
para a Qualidade nas Tecnologias de Informação e Comunicações (QUATIC), Lisboa,
Portugal, pp.17-24.
27. Mendes, E., Counsell, S. Web Development Effort Estimation using Analogy. Proceedings
of the 2000 Australian Software Engineering Conference - ASWEC 2000, April 28-April
30, Australian National University, Canberra, ACT, Australia, IEEE CS Press. pp. 203-212.
28. Mendes, E., Mosley, N., Counsell, S. (2001) Web metrics - Metrics for estimating effort to
design and author Web applications. IEEE MultiMedia, special issue on Web Engineering,
January-March, pp. 50-57.
29. Mendes, E, Mosley, N., Counsell, S. Comparison of Web size measures for predicting Web
design and authoring effort. IEE Proceedings - Software 149(3): 86-92 (2002)
30

30. Mendes, E., Watson, I., Trigss, C., Mosley, N., Counsell, S. A Comparison of Development
Effort Estimation Techniques for Web Hypermedia Applications. Proceedings IEEE Metrics
June, 2002, Ottawa, Canada. Pp. 131-140.
31. Mendes, E., Mosley, N., Counsell, S. Early Web Size Measures and Effort Prediction for
Web Costimation. Proc. 9th International Metrics Symposium (METRICS’03) IEEE
METRICS 2003: 18-29.
32. Morisio, M., Stamelos, I., Spahos, V. Romano, D. Measuring Functionality and
Productivity in Web-Based Applications: A Case Study. Sixth IEEE International
Symposium on Software Metrics, November, 1999.
33. Niessink, F. (2002) Software Requirements: Functional & Non-functional Software
Requirements. www.cs.uu.nl/docs/vakken/swa/ Slides/SA-2-Requirements.pdf
34. Olsina, L., Quantitative Methodology for Evaluation and Comparison of Web Site Quality,
PhD Thesis, Ciencias Exactas School, UNLP, La Plata, Argentina, 2000.
35. Olsina, L., Lafuente, G., Rossi, G. (2001) Specifying Quality Characteristics and Attributes
for Websites. Web Engineering: Managing Diversity and Complexity of Web Application
Development. Springer-Verlag, June, pp. 266-277.
36. Olsina, L., Rossi, G. (2001) A Quantitative Method for Quality Evaluation of WebApps.
ASSE2001
37. Olsina L., Rossi G., Measuring Web Application Quality with WebQEM, IEEE Multimedia,
October-December 2002, pp. 20-29.
38. Olsina, L., Martín M., Fons, J., Abrahão, S., Pastor, O. Towards the Design of a Metrics
Cataloging System by Exploiting Conceptual and Semantic Web Approaches. Proc. of the
International Conference on Web Engineering (ICWE 2003), LNCS 2722, pp. 324-333.
39. Palmer, J. Web Site Usability, Design and Performance Metrics, Information Systems
Research, June 2002, 13(2), 151-167.
40. Pressman, R.S. (2000) What a Tangled Web We Weaved. IEEE Software, Vol. 17, No. 1.
Jan-Feb, pp. 18-21.
41. Ramler, R., Weippl, E., Winterer, M., Shwinger, W., Altmann, J. (2002). A Quality-Driven
Approach to Web Testing. Iberoamerican Conference on Web Engineering, ICWE’02.
Argentina. September. Vol. 1. pp. 81-95.
42. Reifer, D. Web Development: Estimating Quick-to -Market Software. IEEE Software, Nov-
Dec 2000. pp. 57-64. BUENO
43. Reifer, D. Ten Deadly Risks in Internet and Intranet Software Development. IEEE
Software, March-April, 2002. pp. 12-14. VALE
44. Rivlin, E., Botafago, R., Shneiderman, B. Navigating in hyperspace: Designing a structure-
based toolbox, Communications of the ACM, Vol. 37, No. 2, February 1994, pp. 87-96.
45. Ruhe, M., Jeffery, R., Wieczorek, I. Using Web Objects for Estimating Software
Development Effort for Web Applications. Proc. 9
th
International Metrics Symposium
(METRICS’03) IEEE, 2003.
46. Ruiz, J., Calero, C. and Piattini, M. (2003). A Three Dimensional Web Quality Model. Proc.
of the International Conference on Web Engineering (ICWE’03), LNCS 2722, pp. 384-385.
47. W3C (1999) WWW Consortium: Web Content Accessibility Guidelines 1.0, W3C Working
Draft. http://www.w3.org/TR/WCAG10/
48. Warren, P., Gaskell, C., Boldyreff, C., Preparing the Ground for Website Metrics
Research. Proc. 3
rd
International Workshop on Web Site Evolution (WSE’01). IEEE 2001.
31
Appendix
WQM Quality Characteristic
WQM Lifecycle
Process
WQM WebSite
Feature
Metric Ref
Func
Relia
Usab
Effic
Port
Maintb
Des
Expl
Maint
Cont
Pres
Nav
Granularity
Level
Theor.
Valid.
Emp.
Valid.
Autom
1
Distance 17 X X X X X Web X X
2
Depth 17 X X X X X Web X X
3
Breadth (Width) 17 X X X X X Web X X
4
Diameter 17 X X X Web X X
5
Radius 17 X X X Web X X
6
Converted Out Distance
(COD)
7 X X X X X Web Page
X X
7
Converted In Distance (CID) 7 X X X X X Web Page
X X
8
Converted Distance (CD) 7 X X X X X Web X X
9
Relative Out Centrality (ROC)
7 X X X X X Web Page
X X
10
Relative In Centrality (RIC) 7 X X X X X Web Page
X X
11
Status 7 X X X X X Web Page
X X
12
Contrastatus 7 X X X X X Web Page
X X
13
Prestige 7 X X X X X Web Page
X X
14
Compactness 3 X X X X X Web X X
15
Stratum 3 X X X X X Web X X
16
Impurity Tree 3 X X X X X Web X X
17
Number IN Links (NIL) 3 X X X X X Web X X
18
Number OUT Links (NOL) 3 X X X X X Web X X
19
Connectivity Density 28 X X X X X X Web X X
20
Structure 28 X X X X X X Web X
21
Total Link Count (NL) 38 X X X X X X Web X X
22
Number Broken Links (NBL) 38 X X X X X X Web X X
23
% Broken Links (%BL) 38 X X X X X X Web X X
24
Number of Different Broken
Links (NDBL)
38 X X X X X Web X X
25
% Different Broken Links
(%DBL)
38 X X X X X Web X X
26
Images Count 38 X X X X X X Web X X
27
Link Image Count 3 X X X X Web Page
X X
28
Surface of Images 3 X X X Web Page
X X
29
Different Image Count 38 X X X X Web X
30
% Image Redundancy 38 X X X X Web X
31
Page Count 28 X X X X X X Web X X
32
Media Count 28 X X X X X X X Web X X
33
Page Complexity 28 X X X Web Page
X X
34
Media Duration 28 X X X Web X
35
Quick Access Pages 38 X X X X Web Page
X
36
Program Complexity 28 X X X X Web X X
37
Program Count 28 X X X X X X X X X Web X X
38
Page Allocation 28 X X X Web Page
X X
39
Total Page Allocation 28 X X X X Web X X
40
Total Media Allocation 28 X X X Web X X
41
Total Code Length 28 X X X X Web X X
42
Media Allocation 28 X X X X Web X X
43
Audio Complexity 28 X X X X X X Web X X
44
Video Complexity 28 X X X X X X Web X X
45
Animation Complexity 28 X X X X X X X Web X X
46
Code Length (LOC) 28 X X X X X Web X X
47
Code Comment Length 28 X X X X Web X X
48
Image Allocation 28 X X X X X Web X X
49
Reused Media Count 28 X X X Web X
50
Reused Program Count 28 X X X Web X
51
Total Reused Media
Allocation
28 X X X Web X
52
Total Reused Code Length 28 X X X Web X
53
Reused Code Length 28 X X X Web X
54
Reused Comment Length 28 X X X Web X
55
Total Page Complexity 28 X X X X Web X X
56
Cyclomatic Complexity 28 X X X X Web X X
57
Graphic Complexity 28 X X X X Web Page
X X
58
Suitable Information 14 X X X Web
59
Updated Information 14 X X X X Web
60
Degree of Interest 18 X X X Web
61
Reused Docs 27 X X X X Web X X
62
Formatted Docs (.doc, .pdf,
.ps...)
28 X X X X Web X X
63
Size Formatted Docs (.doc,
.pdf, .ps...)
28 X X X Web X X
64
% Dead Pages 38 X X X X X Web X
65
% ALT Text 38 X X X X X Web X
32
WQM Quality Characteristic
WQM Lifecycle
Process
WQM WebSite
Feature
Metric Ref
Func
Relia
Usab
Effic
Port
Maintb
Des
Expl
Maint
Cont
Pres
Nav
Granularity
Level
Theor.
Valid.
Emp.
Valid.
Autom
66
Number of Panes Regarding
Frames
38 X X X X Web Page
X
67
Freq. Broken Links per Hit
Pages
39 X X X X X Web X
68
Images per Page 38 X X X X X Web Page
X
69
Coherence 5 X X X Web Page
70
Local Coherence 5 X X X Web Page
71
Global Coherence 5 X X X Web
72
Cognitive Overhead 5 X X X Web Page
73
Coupling Information Across
Docs
5 X X X Web
74
Local Coherence due to
Relationship between
Information Chunks (LCRIC)
5 X X X Web Page
75
Local Coherence due to Sort
Term Memory (LCSTM)
5 X X X Web Page
76
Global Coherence due to
Hyperlink Within Application
(GCHLWA)
5 X X X Web
77
Global Coherence due to
Cognitive Jumps (GCCJ)
5 X X X Web
78
Cognitive Overhead due to
Consistency (COC)
5 X X X Web
79
Cohesion (COH) 5 X X X Web
80
Coupling (COU) 5 X X X Web
81
Download Time 5 X X X X X Web Page
X
82
Invalid Links Count 38 X X X X Web X
83
Unimplemented Link Count 38 X X X X Web X
84
Spelling Errors 38 X X X X X Web X
85
Deficiencies or absent
features due to different
browsers
38 X X X X X Web X
86
Deficiencies or unexpected
results independent of
browsers
38 X X X X X Web X
87
Orphan Pages 38 X X X X X Web X
88
Destination Nodes Under
Construction
38 X X X X X X Web X
89
Support for Text-Only Version
38 X X X Web X
90
Image Title 38 X X X X X Web X
91
Global Readability (without
browsing Images)
38 X X X Web X
92
NON-Frame Version 38 X X X Web X
93
Table of Contents 38 X X X X Web X
94
Site Map 38 X X X X X Web X
95
Subject Index 38 X X X X Web X
96
Alphabetical Index 38 X X X X Web X
97
Chronological Index 38 X X X X Web X
98
Geographical Index 38 X X X X Web X
99
Other indexes (audience,
format, hybrids, etc.
38 X X X X Web X
100
Quality Labeling System 38 X X X X Web X
101
Audience-Oriented Guided
Tour
38 X X X Web X
102
Conventional Tour 38 X X X X Web X
103
VR Tour 38 X X X X Web X
104
Global Help 38 X X X X Web X
105
Specific Help 38 X X X X Web X
106
E-mail Directory 38 X X X X Web X
107
Phone-Fax Directory 38 X X X X Web X
108
Post mail Directory 38 X X X X Web X
109
FAQ Feature 38 X X X X Web X
110
What's New Feature 38 X X X X Web X
111
Questionnaire Feature 38 X X X Web X
112
Comments/Suggestions 38 X X X Web X
113
Subject-Oriented Feedback 38 X X X Web X
114
Guest Book 38 X X X Web X
115
Cohesiveness by Grouping
Main Control
38 X X X Web
116
Direct Control Permanence 38 X X X Web
117
Indirect Control Permanence 38 X X X Web
118
Stability 38 X X X Web
119
Link Color Style Uniformity 38 X X X Web
120
Global Style Uniformity 38 X X X Web
121
Foreign Language Support 38 X X X X X X Web X
122
Global 38 X X X X Web X
123
Scoped (sub-site or page) 38 X X X X Web X
33
WQM Quality Characteristic
WQM Lifecycle
Process
WQM WebSite
Feature
Metric Ref
Func
Relia
Usab
Effic
Port
Maintb
Des
Expl
Maint
Cont
Pres
Nav
Granularity
Level
Theor.
Valid.
Emp.
Valid.
Autom
124
Screen Resolution Indicator 38 X X X X Web X
125
Global Search 38 X X X Web X
126
Scoped Search 38 X X X Web X
127
Level of Retrieving
Customization
38 X X X Web X
128
Level of Retrieving Feedback
38 X X X Web X
129
Indication of Path 38 X X X Web X
130
Label of Current Position 38 X X X Web X
131
Contextual Permanence
Controls
38 X X X Web X
132
Contextual Stability Controls 38 X X X Web X
133
Vertical Scrolling 38 X X X Web X
134
Horizontal Scrolling 38 X X X Web X
135
Link Title (with explanatory
help)
38 X X X Web X
136
Quality of Link Phrase 38 X X X Web X
137
Quick Browse Controls 38 X X X X Web X
138
Number of Navigational
Contexts
1 X X X X Web X X
139
Number of Navigational Links
1 X X X X X Web X X
140
Density of a Navigational Map
1 X X X Web X X
141
Depth of a Navigational Map 1 X X X X Web X X
142
Breadth of a Navigational
Map
1 X X X X Web X X
143
Minimum Path Between
Navigational Contexts
1 X X X Web X X
144
Number of Paths Between
Navigational Contexts
1 X X X Web X X
145
Compactness 1 X X X X X X X Web X X
146
Fan-In of a Navigational
Context
1 X X X Web X X
147
Fan-Out of a Navigational
Context
1 X X X Web X X
148
Number of Navigational
Classes
1 X X X X Web X X
149
Number of Attributes 1 X X X X Web X X
150
Number of Methods 1 X X X X X Web X X
151
Number of Building Blocks 44 X X X X X X X Web X
152
Number of COTS
Components
44 X X X X X X Web X
153
Number of Object or
Application Points
44 X X X X Web X
154
Number of XML, SGML,
HTML and Query Language
Lines
44 X X X X Web X
155
Number of Web Components
44 X X X X X X X X Web X
156
Number of Scripts (Visual
Language, Audio, Motion,
and so forth)
44 X X X X X X X Web X
157
Function Points 33 X X X X Web X
158
Object-Oriented Function
Points
33 X X X X Web X
159
Reuse Level LOCs 33 X X X Web X
160
Reuse Level OOFPs 33 X X X Web X
161
Total Number of Flash
Animations
31 X X X X Web X
162
Total Number of
Icons/Buttons
31 X X X X Web Page
X
163
Average Length Audio Clips 31 X X X X X Web X
164
Average Length Video Clips 31 X X X X X Web X
165
Total Embedded Code
Length
31 X X X X Web X
166
Size CFSU 31 X X X X Web X
167
Number of Entities 6 X X X X X Web X
168
Number of Components 6 X X X X X X Web X
169
Number of InfoSlots 6 X X X X X Web X
170
Slots Semantic Association 6 X X X X Web X
171
Slots Collection Center 6 X X X X Web X
172
Components Entity 6 X X X X Web X
173
Slots Components 6 X X X Web X
174
Semantics Associations 6 X X X Web X
175
Semantics Association
Centers
6 X X X X Web X
176
Segments 6 X X X Web X
177
Nodes 6 X X X X X X Web X
178
Navigational Slots 6 X X X X Web X
179
Nodes Cluster 6 X X X X Web X
180
Slots Node 6 X X X Web X
181
Clusters 6 X X X Web X
34
WQM Quality Characteristic
WQM Lifecycle
Process
WQM WebSite
Feature
Metric Ref
Func
Relia
Usab
Effic
Port
Maintb
Des
Expl
Maint
Cont
Pres
Nav
Granularity
Level
Theor.
Valid.
Emp.
Valid.
Autom
182
Publishing Units 6 X X X Web X
183
Presentation Links 6 X X X Web X
184
Sections 6 X X X Web X
185
Word Count 24 X X X X X X X Web Page
X X
186
Page Title Word Count 24 X X X X Web Page
X
187
Overall Page Title Word
Count
24 X X X X Web Page
X
188
Invisible Word Count 24 X X X X X Web Page
X
189
Meta Tag Word Count 24 X X X X Web Page
X
190
Body Word Count 24 X X X X X X X Web Page
X X
191
Display Word Count 24 X X X X Web Page
X
192
Display Link Word Count 24 X X X X Web Page
X
193
Link Word Count 24 X X X X Web Page
X
194
Average Link Words 24 X X X X Web Page
X
195
Graphic Word Count 24 X X X X X X Web Page
X
196
Ad Word Count 24 X X X X X Web Page
X
197
Exclamation Point Count 24 X X X X Web Page
X
198
Spelling Error Count 24 X X X X X X Web Page
X
199
Good Word Count 24 X X X X Web Page
X
200
Good Body Word Count 24 X X X X Web Page
X
201
Good Display Word Count 24 X X X X Web Page
X
202
Good Display Link Word
Count
24 X X X X Web Page
X
203
Good Link Word Count 24 X X X X Web Page
X
204
Average Good Kin Words 24 X X X X Web Page
X
205
Good Graphic Word Count 24 X X X X Web Page
X
206
Good Page Title Word Count 24 X X X X Web Page
X
207
Overall Good Page Title
Word Count
24 X X X X Web Page
X
208
Good Meta Tag Word Count 24 X X X X Web Page
X
209
Reading Complexity 24 X X X Web Page
X
210
Overall Reading Complexity 24 X X X Web Page
X
211
Fog Word Count 24 X X X Web Page
X
212
Fog Big Word Count 24 X X X Web Page
X
213
Overall Fog Big Word Count 24 X X X Web Page
X
214
Fog Sentence Count 24 X X X Web Page
X
215
Overall Fog Sentence Count 24 X X X Web Page
X
216
Text Link Count 24 X X X Web Page
X
217
Page Link Count 24 X X X Web Page
X
218
Redundant Link Count 24 X X X Web Page
X
219
Redundant Graphic Count 24 X X X X Web Page
X
220
Graphic Link Count 24 X X X Web Page
X
221
Graphic Ad Count 24 X X X X X X Web Page
X
222
Animated Graphic Ad Count 24 X X X X X X Web Page
X
223
Emphasized Body Word
Count
24 X X X X Web Page
X X
224
Bolded Body Word Count 24 X X X X Web Page
X
225
Capitalized Body Word Count
24 X X X X Web Page
X
226
Colored Body Word Count 24 X X X X Web Page
X
227
Exclaimed Body Word Count 24 X X X X Web Page
X
228
Italicized Body Word Count 24 X X X X Web Page
X
229
Underlined Word Count 24 X X X Web Page
X
230
Serif Word Count 24 X X X Web Page
X
231
Sans Serif Word Count 24 X X X Web Page
X
232
Undetermined Font Style
Word Count
24 X X X Web Page
X
233
Font Style 24 X X X Web Page
X
234
Minimum Font Size 24 X X X Web Page
X
235
Maximum Font Size 24 X X X Web Page
X
236
Average Font Size 24 X X X Web Page
X
237
Body Color Count 24 X X X Web Page
X
238
Display Color Count 24 X X X Web Page
X
239
Text Positioning Count 24 X X X Web Page
X X
240
Text Column Count 24 X X X Web Page
X
241
Text Cluster Count 24 X X X Web Page
X X
242
Link Text Cluster Count 24 X X X Web Page
X
243
Border Cluster Count 24 X X X Web Page
X
244
Color Cluster Count 24 X X X Web Page
X
245
List Cluster Count 24 X X X Web Page
X
246
Rule Cluster Count 24 X X X Web Page
X
247
Non-Underlined Text Links 24 X X X X Web Page
X
248
Link Color Count 24 X X X X Web Page
X
249
Standard Link Color Count 24 X X X X Web Page
X
250
Minimum Graphic Height 24 X X X X X X Web X
251
Maximum Graphic Height 24 X X X X X X Web X
35
WQM Quality Characteristic
WQM Lifecycle
Process
WQM WebSite
Feature
Metric Ref
Func
Relia
Usab
Effic
Port
Maintb
Des
Expl
Maint
Cont
Pres
Nav
Granularity
Level
Theor.
Valid.
Emp.
Valid.
Autom
252
Average Graphic Height 24 X X X X X X Web X
253
Minimum Graphic Wide 24 X X X X X X Web X
254
Maximum Graphic Wide 24 X X X X X X Web X
255
Average Graphic Wide 24 X X X X X X Web X
256
Color Count 24 X X X X Web Page
X X
257
Minimum Color Use 24 X X X X Web Page
X
258
Browser-Safe Color Count 24 X X X X Web Page
X
259
Good Text Color Combination
24 X X X X Web Page
X
260
Neutral Text Color
Combination
24 X X X X Web Page
X
261
Bad Text Color Combination 24 X X X X Web Page
X
262
Good Panel Color
Combinations
24 X X X X Web Page
X
263
Neutral Panel Color
Combinations
24 X X X X Web Page
X
264
Bad Panel Color
Combinations
24 X X X X Web Page
X
265
Font Count 24 X X X X Web Page
X X
266
Serif Font Count 24 X X X X Web Page
X
267
Sans Serif Font Count 24 X X X X Web Page
X
268
Undetermined Font Style
Count
24 X X X X Web Page
X
269
Page Height 24 X X X X X Web Page
X
270
Page Width 24 X X X X X Web Page
X
271
Page Pixels 24 X X X X X Web Page
X
272
Vertical Scrolls 24 X X X X X Web Page
X
273
Horizontal Scrolls 24 X X X X X Web Page
X
274
Interactive Element Count 24 X X X X X X X Web Page
X
275
Search Element Count 24 X X X X X X X Web Page
X
276
External Stylesheet Use 24 X X X X X Web Page
X
277
Fixed Page Width Use 24 X X X X X Web Page
X
278
Page Depth 24 X X X X Web Page
X
279
Page Type 24 X X X X Web Page
X
280
Self Containment 24 X X X X Web Page
X
281
Spamming Use 24 X X X X X Web Page
X
282
Table Count 24 X X X X Web Page
X
283
Script File Count 24 X X X X X Web Page
X
284
Script Bytes 24 X X X X X Web Page
X
285
Object File Count 24 X X X X X Web Page
X
286
Object Bytes 24 X X X X X Web Page
X
287
Object Count 24 X X X X X Web Page
X
288
Bobby Approved 24 X X X Web Page
X
289
Bobby Priority 1 Errors 24 X X X Web Page
X
290
Bobby Priority 2 Errors 24 X X X Web Page
X
291
Bobby Priority 3 Errors 24 X X X Web Page
X
292
Bobby Browser Errors 24 X X X Web Page
X
293
Weblink Errors 24 X X X X X X Web Page
X
294
Visible Page Text Terms 24 X X X X Web Page
X
295
Visible Unique Page Text
Terms
24 X X X X Web Page
X
296
Visible Page Text Hits 24 X X X X Web Page
X
297
Visible Page Text Score 24 X X X X Web Page
X
298
All Page Text Terms 24 X X X X Web Page
X
299
All Unique Page Text Terms 24 X X X X Web Page
X
300
All Page Text Hits 24 X X X X Web Page
X
301
All Page Text Score 24 X X X X Web Page
X
302
Visible Link Text Terms 24 X X X X Web Page
X
303
Visible Unique Link Text
Terms
24 X X X X Web Page
X
304
Visible Link Text Hits 24 X X X X Web Page
X
305
Visible Link Text Score 24 X X X X Web Page
X
306
All Link Text Term 24 X X X X Web Page
X
307
All Unique Link Text Term 24 X X X X Web Page
X
308
All Link Text Hits 24 X X X X Web Page
X
309
All Link Text Score 24 X X X X Web Page
X
310
Page Title Terms 24 X X X X Web Page
X
311
Unique Page Title Terms 24 X X X X Web Page
X
312
Page Title Hits 24 X X X X Web Page
X
313
Page Title score 24 X X X X Web Page
X
314
Text Element Variation 24 X X X X Web Page
X
315
Page Title Variation 24 X X X X Web Page
X
316
Link Element Variation 24 X X X X Web Page
X
317
Graphic Element Variation 24 X X X X Web Page
X
318
Text Formatting Variation 24 X X X X Web Page
X
319
Link Formatting Variation 24 X X X X Web Page
X
36
WQM Quality Characteristic
WQM Lifecycle
Process
WQM WebSite
Feature
Metric Ref
Func
Relia
Usab
Effic
Port
Maintb
Des
Expl
Maint
Cont
Pres
Nav
Granularity
Level
Theor.
Valid.
Emp.
Valid.
Autom
320
Graphic Formatting Variation 24 X X X X Web Page
X
321
Page Formatting Variation 24 X X X X Web Page
X
322
Page Performance Variation 24 X X X X Web Page
X
323
Overall Element variation 24 X X X X Web X
324
Overall Formatting Variation 24 X X X X Web X
325
Overall Variation 24 X X X X Web X
326
Median Page Breadth 24 X X X Web X
37
