
PROPOSAL FOR AUTOMATING THE GENERATION PROCESS
OF QUESTIONNAIRES
TO MEASURE THE SATISFACTION LEVEL OF SOFTWARE
USERS
Mauro Paparo, Sergio Zapata, María Inés Lund
Institute of Informatics, National University of San Juan, Ignacio de la Roza y Meglioli, San Juan, Argentina
Keywords: Software quality, softwar
e metrics, software users’ satisfaction, quality dimension.
Abstract: The most recent concepts on software quality take into account the factors of product quality, process
quality and the satisfaction level of users. Therefore, when putting forth a plan for improving a software
product, special attention should be paid as to incorporate the level of users’ satisfaction into the
development premises. On this latter respect, well-designed surveys have proven to be a valuable tool to
obtain and measure satisfaction variables. The survey-based strategies, however, present a drawback on the
fact that the tasks involved in questionnaire generation are difficult to automate, which renders the entire
approach almost impracticable. This work presents a proposal for automating the various stages defined in
questionnaire generation, with the aim at making the measurement method be both applicable and more
practical.
1 INTRODUCTION
The low quality level of business software products
is a known fact both in the software industry and in
the scientific community. “Unreliable products –in
general- quickly vanish from the market.
Unfortunately, software products are not touched by
this ideal condition” (Ghezzi,1991). During the
nineties “…computers and software were ranked
eighth and tenth among the products receiving the
highest number of user complains” (Kaner, 1998).
In the software industry, the costs related to the
so
lution of problems caused by low quality products
are significant. Several authors have presented
research works on the measurement of software
quality, though focused mainly on product quality
and without taking into account the satisfaction of
software users as a main parameter in quality
measurement.
There are two viewpoints as regards software
q
uality: one which is intrinsic to the product and
often limited to the defects ratio of the product, and
another wider and more recent viewpoint involving
product quality, process quality and user’s
satisfaction. “product quality, process quality and
user’s satisfaction make up the entire meaning of
quality” (Kan, 1995). Regrettably, “software user’s
satisfaction has fallen to untold levels in the last ten
years” (Kaner, 1998).
In order to analyze and improve the satisfaction
of
software users, a measurement mechanism should
be established. “There is no way of improving
whichever cannot be measured” (De Marco, 1982).
Well-designed surveys on software user’s
satisfaction may turn to be an appropriate way to
obtain valuable data for the software industry.
Through statistical techniques, such questionnaires
can render information on less-satisfied quality
attributes or, conversely, on those attributes
considered more important by the users. With such
information, the software developers may apply re-
engineering techniques to the development
processes, with the aim at improving the quality of
the final product.
The measurement of software users’ satisfaction
has al
ready been incorporated on most standards and
norms on software quality, namely: IEEE, CMMi,
ISO9001:2000, which emphasize the measurement
of satisfaction levels of clients and final users.
Therefore, those involved in software development
should establish a process to obtain, monitor and
publish the information on users’ satisfaction, as a
basic feature released by any software system to
allow improving the process. All the proposals
113
Paparo M., Zapata S. and Inés Lund M. (2004).
PROPOSAL FOR AUTOMATING THE GENERATION PROCESS OF QUESTIONNAIRES TO MEASURE THE SATISFACTION LEVEL OF SOFTWARE
USERS.
In Proceedings of the Sixth International Conference on Enterprise Information Systems, pages 113-118
DOI: 10.5220/0002642901130118
Copyright
c
SciTePress
presented so far employ surveys to gather
information on users’ satisfaction levels.
Lund and Zapata (Lund, 2000) have proposed a
technique for software users’ satisfaction levels
based on Bob Hayes’ methodology on clients’
satisfaction (Hayes, 1992). This technique follows
the guidelines suggested by IEEE, though by adding
some new concepts arisen in this disciplinary area -
measurement technique guided by user, statistically
reliable questionnaires -. Although these proposals
have proven useful at the time of identifying users’
satisfaction, all of them show a common drawback
(Lund, 2001), (Lund, 2001b), (Lund, 2002): the
process requires a great deal of non-automated,
manual work to generate the questionnaire, which
renders these methods almost impracticable.
On such a sense, this work presents a proposal
for automating the various stages established to
generate statistically reliable questionnaires, as a
helping tool for the software developers to gather
information on software users’ opinions. The
automation of this process shall considerably
increase the applicability of the above measurement
techniques.
It is expected that by applying this measurement
technique for users’ satisfaction will render the
following benefits for software developers and the
industry as well:
• Software developers will be able to measure the
satisfaction level of their products form the
users’ viewpoint, because the questionnaire
generated by the proposed application is
brought about from the very suggestions of the
users.
• Based on the results obtained, software
developers will be able to improve such aspects
of their software whose satisfaction
expectancies are not fulfilled; they will be able
to improve both the process and the product,
thus encouraging a continuous improvement
process.
• In general, the software industry will count with
updated information on the state-of-the-art as
regards users’ satisfaction, and the quality
attributes considered in the various software
products.
• Software users will have better chances for
acquiring products that may satisfy their
expectancies, because –in general- the
satisfaction needs are more frequently linked to
satisfying the functional requirements of the
application, and to the user’s culture in general,
rather than meeting the particular need of the
users.
The following section presents briefly the
measurement methodology used in this work.
Section 3 describes the proposal for automatic
generation of reliable questionnaires, whereas
Section 4 shows the main capabilities of the
proposed tool. Finally, Section 5 presents the
conclusions and comments on future work.
2 MEASUREMENT
METHODOLOGY
With the aim at measuring the software users’
satisfaction, the method proposed by Lund and
Zapata (Lund, 2000) will be used to generate a
reliable questionnaire. This method is based on a
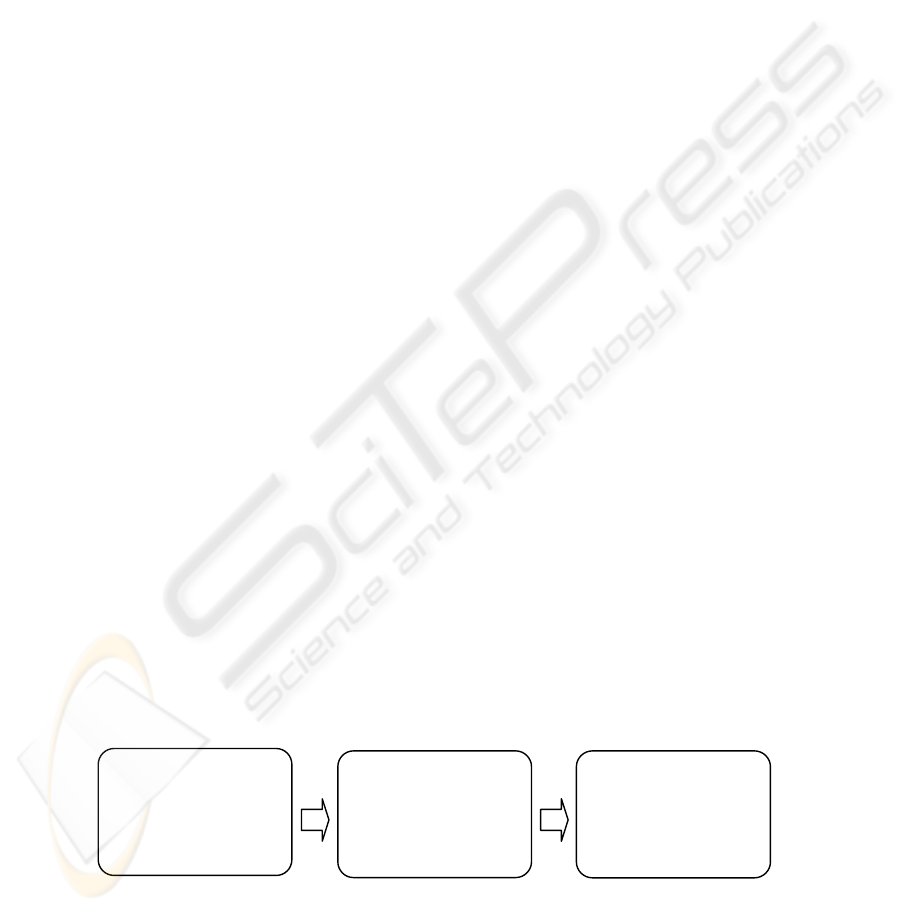
phases process, as shown in Figure 1.
In the first phase, the needs and requirements of
the users are determined. These are also called the
quality dimensions or quality attributes of the
software product under scrutiny. The relevant aspect
are that these quality attributes are obtained
straightforwardly from the user’s response, i.e., his
expectancies and desires for product quality. Hence,
the method relies on the hypothesis that the user is
the one in the best condition to state which are his
own needs and requirements. Therefore, the user is
involved throughout the entire measuring process.
Establishing the
user’s needs and
requirements
Development and
evaluation of the
questionnaire
Utilization of the
questionnaire results
Figure 1. General process of the method for measuring users’ satisfaction levels
.
For this initial phase, the critical incident technique
is used (Flanagan, 1954), which has been widely
employed in determining quality dimensions. Take
account that these dimensions will be different for
each software kind.
ICEIS 2004 - DATABASES AND INFORMATION SYSTEMS INTEGRATION
114

In the second phase of the proposed method, the
users’ satisfaction questionnaire is designed. The
factors to account for in this design are the number
of items or questions to include, the format for the
responses, the way questions are posed, and other
factors. These questions or inquiry items are selected
according to the quality dimensions detected in the
first phase.
This phase should warrant as well that the
resulting questionnaire be trustworthy; i.e., that it
reliable will measure whichever factor is desired to
be gauged, an that these pondering will not be
thwarted by casual errors and flaws. From the
various methods available for measuring the
reliability of questionnaires, the present work will
rely on the formula known as Cronbach’s Alpha
(Cronbach, 1951), which allows to measure the
reliability by using the correlation or covariance
matrix of all inquiry items or questions of the
questionnaire (Lund, 2001). In order to define this
matrix, a preliminary questionnaire is given to
software users; these preliminary data shall render
an initial panorama that may lead to a definite
outline of the final questionnaire, and improve its
reliability range as well. If this reliability level is
over 80%, it may be judged an appropriate
measuring tool and, as such, trustworthy to be used
in the survey of definite data on users’ satisfaction
for the software under evaluation.
The third and last phase involves the statistical
computations of the questionnaire-collected data,
aiming at attaining indexes that reflect the
satisfaction levels of users as well as to knowing
which quality dimensions are more satisfied; which
ones are the most important factors for the client,
and the like. The justification of the proposed
method is met by the correct attainment of these
metrics. They will allow the developer make the
right decisions on the software product itself or on
the development process applied. The following are
some relevant indexes that can be obtained:
• More satisfied quality attributes, as per
application type.
• More satisfied quality attributes, as per
application type.
• Application with the highest satisfaction index,
as per application type.
• Application with the lowest satisfaction index,
as per application type.
• Type of application with the highest satisfaction
index.
• Type of application with the lowest satisfaction
index.
• Quality dimensions with higher influence on the
satisfaction level, as per application type.
• Quality dimensions with lower influence on the
satisfaction level, as per application type.
• Time-evolution of each index above.
Users’ satisfaction is an important constitutive
aspect of software quality. The measurement of the
satisfaction level allows to attain not only the user’s
opinion, but also the indirect measurement of the
quality attributes of the product, such as: reliability,
performance, documenting, and the like. The results
of questionnaire inquires upon users’ opinions show
the satisfaction level for each quality attribute for the
evaluated product (Hayes, 1992) (Lund, 2000).This
information is useful for re-defining the
development process, as regards those aspects
impinging more heavily upon non-satisfied quality
attributes. This way, the survey approach turns to be
a tool for decision-making on the process, and which
allows as well to set forth a continuous re-
engineering of both the product and process.
Each application type of business software
(Laudon, 2000) calls for a tailored-type user’s
questionnaire. This individual approach is important
to obtain a greater specificity both in user’s
responses and from the analysis from the inquiry
results. The survey process is a delicate, expensive
and difficult-to-replicate task, which demands an
ensured reliability of all its measurement
instruments and components.
3 PROPOSAL FOR AUTOMATIC
GENERATION OF RELIABLE
QUESTIONNAIRES
This proposal does not intend to cover the entire
systematization of the measurement process, but
only the stages linked to the design and concretion
of the questionnaire, namely the first and second
phases of the process of Figure 1. This is so because
a former application —SUSE: Software User
Satisfaction Evaluator— that systematizes the third
phase has already been developed (Lund, 2002).
SUSE is in the testing phase, and it integrates the
parts of questionnaire responses, their processing,
and the presentation of results or indexes. Therefore,
the proposal presented here is a complement of the
former application with which the entire method is
thus completed.
The current proposal is intended to help in
satisfying the expectancies of developers around the
PROPOSAL FOR AUTOMATING THE GENERATION PROCESS OF QUESTIONNAIRES TO MEASURE THE
SATISFACTION LEVEL OF SOFTWARE USERS
115
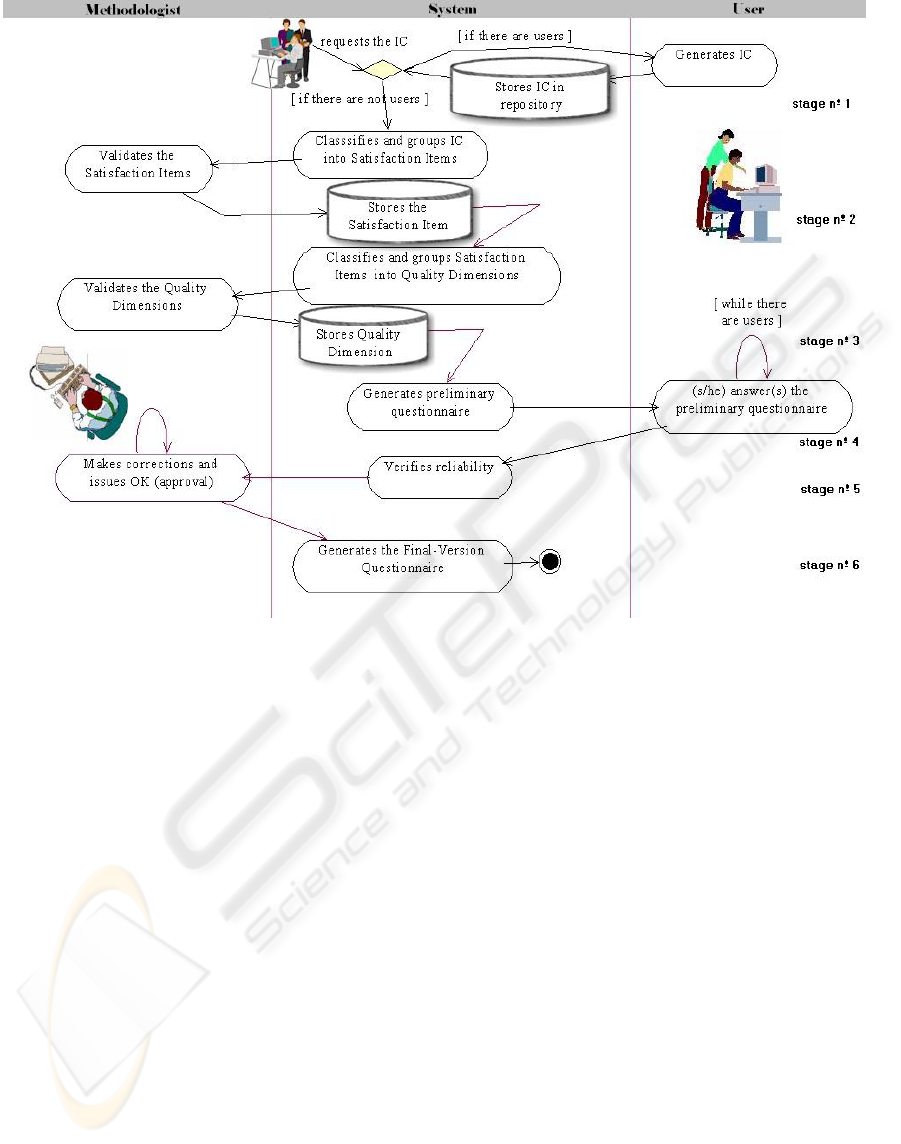
Figure 2: Questionnaire Generation Process
world. Therefore, the web is the most proper
technology for measuring software users’
satisfaction levels from their own workplaces,
wherever they may be at, and thus compile the most
diverse and complete information to this respect,
with the additional possibility of relating the
information from both users and developers
throughout the world.
3.1 Automatic process for
questionnaire generation
The process is divided into six stages, each of which
entails one part of the total questionnaire generation
process. The stages can be automated, manual or
combined; see Figure 2.
• “Generation of Critical Incidents” performed
through a web form to be completed by the real
users who have had a sizable number of
interactions with the software product. It will be
requested to enter 5 to 10 positive incidents and
5 to 10 negative ones. These will be stored in
the system's repository.
• “Generation of Satisfaction Items”: by
recovering the critical incidents from the
repository inquiry, the system will classify and
sort them automatically according to the
similarities in the responses. The methodologist
will then validate these satisfaction items thus
generated, which will be stored in the
repository.
• “Generation of Quality Dimensions”: by
recovering the satisfaction items, the system
will process and will sort them automatically
into quality dimensions. Then, the
methodologist will validate the process and will
store the attained quality dimensions.
• “Generation of the preliminary questionnaire”:
in this stage, several activities are carried out,
such as the “generation of questions”, that arise
from the satisfaction items, and are written with
an neutral tone; the “generation of the
questionnaire introduction”; and, finally, “the
development of the preliminary questionnaire”
itself, which is made up of an introductory
descriptive text, and of the attained dimensions
and items. This questionnaire is e-mailed to
some users, whose responses are latter stored.
These tasks are assisted by a graphical software
ICEIS 2004 - DATABASES AND INFORMATION SYSTEMS INTEGRATION
116

–which is a component part of the system- that
gives support to the methodologist in building
up the preliminary questionnaire. It allows as
well –via web interface- to store and post-
process the results of the preliminary
questionnaire.
• “Verification of the results of the preliminary
questionnaire”: this stages entails performing
automatically the computations for the
reliability analysis of the questionnaire. Upon
such results, the methodologist will decide on
the items to remain incorporated for each
dimension, i.e., the statistically reliable items.
• “Generation of the final questionnaire”: after
sorting out those items deemed unnecessary to
measure the quality level, or to change the
dimension items, the final questionnaire will be
generated automatically, i.e., the final product
of the process presented herein.
The software developer wishing to measure the
satisfaction level reached by its product will need,
first, to register himself as such into the web
application, and to register the product to be
evaluated. Then, the developer will have to
determine the reliable questionnaire the he will use
in inquiring the users. He will have two options for
determining this questionnaire: (a) to choose one
from the pre-defined questionnaire library that the
application will show; or (b) to generate a new
questionnaire by suing the proposal presented
herein. The new questionnaire thus generated will
also be incorporated into the library of predefined
questionnaires. Such library questionnaires will be
classified according to application type.
Once the definite questionnaire has been
determined, the web application will automatically
enable the inquiry module for the users, and will the
results form such inquire (questionnaire responses).
Once the deadline for answering and sending the
questionnaire had expired, the satisfaction indexes
will be calculated and published.
4 SUSE (SOFTWARE USER
SATISFACTION EVALUATOR)
The users’ satisfaction measuring tool linked to the
proposal herein stated is currently undergoing the
testing stage. Figure 3 depicts the outline of SUSE .
SUSE is a web-based tool integrated by two
frames. The left frame shows the various options
that describe its functionality. The right frame is
used to unfold the information and to interact with
the user. Figure 3 shows the information on the
private indexes associated to a software system
called “Claims System”. The processed information
corresponds to a time segment, and the attained
indexes are: functionality, technical support, ease of
use, ease to learn, and on-line assistance.
Through the indexes generated by the tool, the
user’ satisfaction level of the chosen item can be
displayed, as well as the importance level that is
given to such an item. The result form combining all
these values will render the information to decide
upon the quality dimensions that should be priory
improved.
SUSE interface of Figure 3 also feature the
option “Create a new questionnaire” that displays
the guideless to let the software users enter the
Critical Incidents. These are then analyzed and
processed according to the present proposal, finally
reaching at the desired questionnaire.
5 CONCLUSIONS AND FUTURE
WORK
The current work progresses toward the objective of
automating the entire measurement process on
software users’ satisfaction. To reach such an aim is
crucial for an effective application of these
questionnaire-based measurement techniques. The
main contribution of the present work lies on he
clear definition and relations stated for the various
stages composing the automatic generation process
of a reliable questionnaire.
The attainment of a reliable, practical,
technologically up-datable, and with world-wide
application capability as that offered by the
extension of the application SUSE to measure users’
satisfaction levels, may turn to be a valuable asset
for the quality improvement of general-type and
business software, as well as for the continuing
improvement of software development processes.
Although software applications to measure users
satisfaction based on surveys exists, does not ensure
the statistical reliability of questionnaires. In
addition, the questionnaires are not generated from
the perspective of the user, as proposed by this work.
A drawback to overcome is the resistance of
developers to expose their products to evaluation.
On this account, the developer should be given full
privacy warranty, and absolute discretion on the
attained results, despite the fact that such results will
be included in the global computation son quality
levels. Effort should be put as well on encouraging
PROPOSAL FOR AUTOMATING THE GENERATION PROCESS OF QUESTIONNAIRES TO MEASURE THE
SATISFACTION LEVEL OF SOFTWARE USERS
117
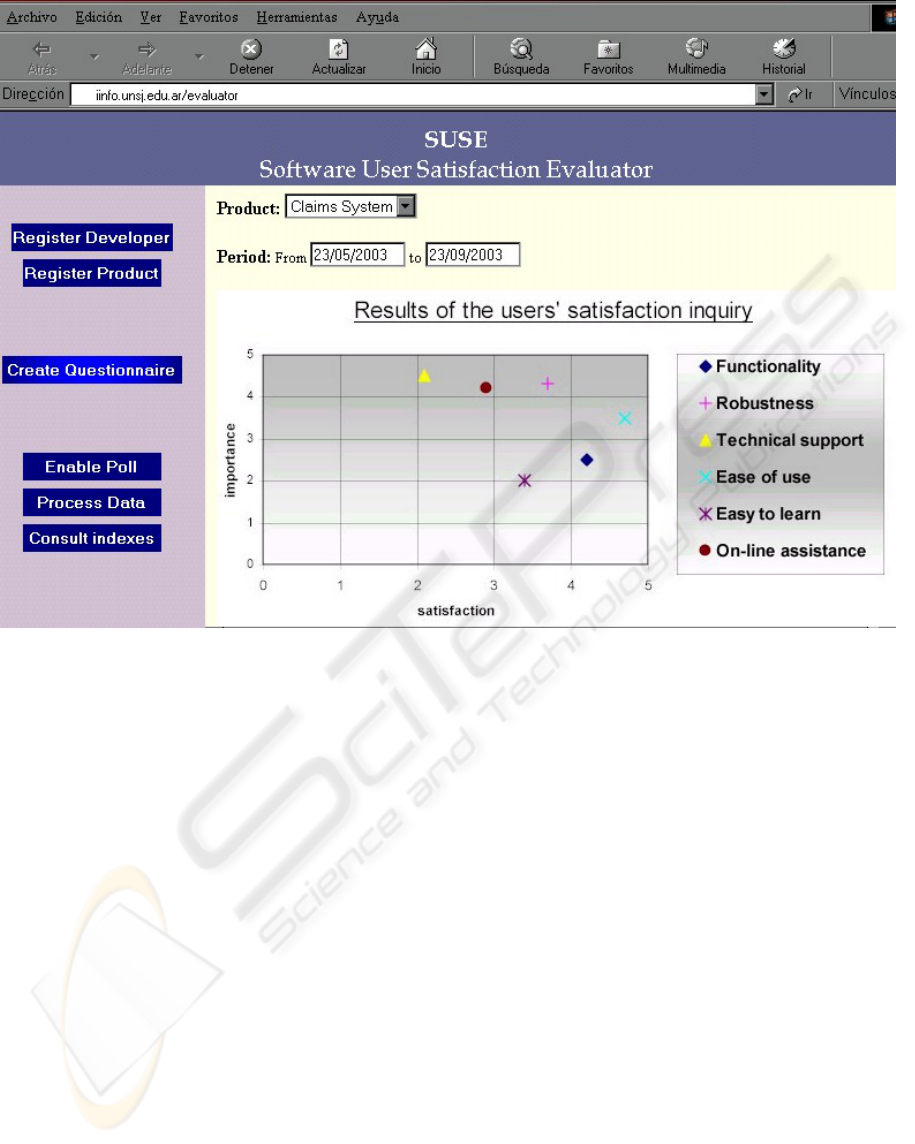
Figure 3: Interface of SUSE
the users to accept and respond the questionnaires on
the various software products under scrutiny.
At present, the proposed application is in its
advanced design stage, with a definite completion
scheduled for year’s end. The current work is
included within the project “Improvement in the
quality level of the software development process
used in local organizations”, undertaken and funded
by the Institute of Informatics, National University
of San Juan, Argentina.
REFERENCES
Cronbach, L., 1951. Coefficient alpha and the internal
structure of test. Psychometrika.
De Marco T., 1982. Controlling Software Projects.
Prentice Hall, New York.
Flanagan, J., 1954. The critical incident Technique.
Psychological Bulletin.
Ghezzi C., 1991. Fundamentals of Software Engineering.
Prentice Hall Int.
Hayes, B., 1992. Measuring Customer Satisfaction.
ASQC Quality Press, Milwaukee (Wisconsin-USA).
Kaner, C., Pels, D., 1998. Bad Software: What to Do
When Software Fails. John Wiley & Sons, Inc.
Kan, S., 1995. Metrics and Models in Software Quality
Engineering. Addison-Wesley Publishing Company.
Laudon, K. C., Laudon, J. P., 2000. Management
Information Systems. Prentice-Hall.
Lund, M., Zapata, S., 2000. Proposal to Measure Software
Customer Satisfaction. In Argentine Symposium on
Software Engineering. Argentina.
Lund, M., Forcada, B., Zapata, S., Herrera, M., 2001. Una
Experiencia en la Obtención de un Instrumento Fiable
para Medir Satisfacción de Clientes de Software. In
Jornadas de Ingeniería de Software y Bases de Datos.
Almagro, España.
Lund, M., Ochoa, S., Zapata, S., 2001b. Un método para
medir la Satisfacción de Usuarios de Courseware en
Escenarios de Educación a Distancia. In Jornadas
Chilenas de Computación. Punta Arenas. Chile.
Lund, M., Zapata, S., Ochoa, S., 2002. Una Herramienta
para la Medición Continua de la Satisfacción de
Usuarios de Software. In Workshop Chileno de
Ingeniería de Software. Copiapó, Chile.
ICEIS 2004 - DATABASES AND INFORMATION SYSTEMS INTEGRATION
118
